Plasma polyacrylic acid and hollow TiO2 spheres modified with rhodamine B for sensitive electrochemical sensing Cu(II)†
Zhihong
Zhang
*ab,
Hongfei
Ji
b,
Shuai
Zhang
ab,
Donglai
Peng
b,
Qixuan
Fu
b,
Minghua
Wang
b,
Linghao
He
b and
Lingyu
Yue
ab
aHenan Collaborative Innovation Center of Environmental Pollution Control and Ecological Restoration, P. R. China. E-mail: mainzhh@163.com
bState Laboratory of Surface and Interface Science of Henan Province Zhengzhou University of Light Industry, No. 166, Science Avenue, Zhengzhou 450001, P. R. China
First published on 23rd November 2015
Abstract
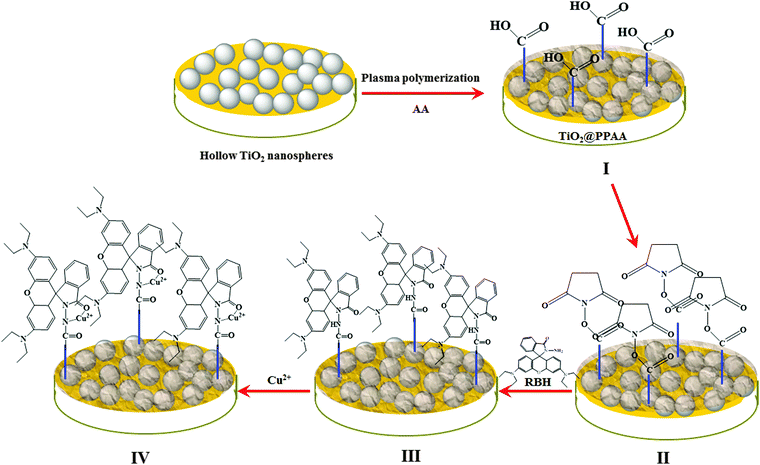
We report a novel nanocomposite of hollow TiO2 microspheres and plasma polyacrylic acid (TiO2@PPAA) modified with rhodamine B (TiO2@PPAA-RhB). This nanocomposite was further used as an electrochemical sensor for the ultra-sensitive and selective detection of Cu2+ in water. A gold electrode was modified with hollow TiO2 nanospheres, followed by the closely bonded layer of PPAA via plasma polymerization. Subsequently, the carboxyl groups of TiO2@PPAA nanocomposites were activated to ester groups by N-hydroxysuccinimide/1-ethyl-3-(3-dimethylaminoprolyl) carbodiimide hydrochloride. The resultant activated ester groups reacted with the amino groups on rhodamine to form the amide groups, leading to the modification of TiO2@PPAA nanocomposites with rhodamine. Considering the synergistic effect of strong electrostatic interaction between the carboxyl groups of PPAA and Cu2+, the direct adsorption of Cu2+ on the TiO2 surface, and the coordination chemistry formed between Cu2+ and rhodamine, the developed electrochemical biosensor exhibited high sensitivity of Cu2+ detection, with a detection limit of 0.404 pM within the range of 0.001–10 nM of Cu2+. Therefore, the fabricated electrochemical sensor based on TiO2@PPAA-RhB can be obtained via plasma polymerization and represents a highly promising tool for use in environmental monitoring.
1 Introduction
Metal ion recognition and sensing have received considerable attention because of their important roles in biological, industrial, and environmental processes. Among the essential heavy metal ions in the human body, Cu2+ is the third most abundant after Fe3+ and Zn2+; Cu2+ plays important roles in several biological processes.1 The toxicity of copper ions for humans is rather low compared with other heavy metals, but certain microorganisms are affected by even submicromolar Cu2+ concentrations.2 Consequently, effective Cu2+ detection in water or physiological samples is of toxicological and environmental importance.3 To date, several elaborate approaches, including fluorescence chemosensors,4 atomic absorption spectrometry,5 inductively coupled plasma atomic emission spectrometry,6 and electrochemical strategies,7 have been established for the determination of Cu2+. Electrochemical methods have recently attracted more attention because of their low cost, simple instrumentation, and easy to real-time and in situ detection.8Polyacrylic acid (PAA) is composed of numerous carboxyl groups on the line type macromolecular chains, thereby giving the rapid contact between heavy metal ions and carboxyl groups, and more binding sites at the interface.9 Recently, a number of researchers have investigated the adsorption of heavy metal ions onto linear or cross-linked PAA via the electrostatic interaction and specific complex formation. For example, PAA was used to modify the inorganic or polymeric adsorbent,10 such as magnetic mesoporous carbon,11 poly(glycidyl methoarylate),12 and polyhyaluronic acid13 with carboxyl-containing species, hence providing these materials with high adsorption ability of Cd2+, Cu2+, and Ca2+. The performance of heavy metal ion removal is improved by modifying graphene oxide and Fe3O4 nanocomposites with PAA and are used as new adsorbents, thus showing excellent recyclable removal of Pb2+, Cu2+, and Cd2+ ions from aqueous solution.14 PAA can also be prepared via plasma polymerization, in which plasma deposition affords strongly adherent pin-hole free film and functionalizes stent surfaces with high density of grafting sites that facilitate covalent attachment of biopharmaceuticals.15 Plasma polyacrylic acid (PPAA) has been studied to obtain coatings with a high density of carboxylic acid groups. Such carboxyl-group surfaces can have important industrial applications, such as improving adhesion and aging resistance of bonded components in the automotive industry and activating the polyolefin surface, thus replacing conventional treatments in the packing sector.16 However, PAA-related films are seldom used as the sensitive layer of electrochemical biosensors for detecting heavy ions, mainly because of the non-specific adsorption between the heavy metal ions and PAA and their poor electrochemical performance.17
Additionally, rhodamine B (RhB) derivatives are nonfluorescent and colorless, whereas ring opening of the corresponding spirolactam gives rise to strong fluorescence emission and a pink color.18 A spirolactam (nonfluorescent) to ring-opened amide (fluorescent) process was utilized for metal ion detection. Most of these sensors of rhodamine-based derivatives bearing a pyrene group as a chemosensor for Cu2+ were reported, in which the rhodamine ring-opening process was introduced to provide a colorimetric change and “turn-on” fluorescence signal toward Cu2+.19 Pyrene fluorescence is quenched upon Cu2+ addition; thus, the signal is not observed. Introducing another fluorophore to provide a strong fluorescence first upon binding with some other ions and show typical rhodamine fluorescence later by Cu2+ replacement could ensure ratiometric output signals.20 However, as an organic pollutant in the environment, the residue of rhodamine dyes threatens human health. Treating wastewater containing rhodamine produced through the normal determination method of heavy metal ions is difficult.21 Therefore, developing a much more convenient sensor based on rhodamine using a feasible method, which can be easily used in the natural environment and recycled after being used, is highly desirable.
TiO2 microsphere is a useful and functional material in the fields of dye-sensitized solar cells, photocatalysts, and environmental treatments because of its semiconductive properties, physical and chemical stabilities, and cost-effective fabrication.22 Metals, particularly heavy metals, are considered to be health risks to both humans and the ecosystem because of their toxicity. Hu et al. investigated the desorption of Pb(II), Cu(II), and Zn(II) from TiO2 nanoparticles.23 Similarly, Gao et al.24 conducted an experiment about the adsorption mechanism and behavior of Pb(II) and Cd(II) ions on different nanosized TiO2 crystals. More importantly, TiO2 leads to a high host–guest interface with improved light adsorption and photoactivity. Therefore, TiO2 is highly potential for adsorption of heavy metal materials. Especially, hollow TiO2 spheres (h-TiO2) exhibit highly photocatalytic and adsorption activity due to the high surface area and porous nanostructure.25
Combining the high Cu2+ adsorption of PPAA, selective interaction between Cu2+ and RhB, and high electrochemical performance of h-TiO2 spheres, the present work aims to investigate a novel nanocomposite of h-TiO2 microspheres and plasma polyacrylic acid (h-TiO2@PPAA) modified with rhodamine B (TiO2@PPAA-RhB). The resultant nanocomposite was further used as the electrochemical sensor for the ultra-sensitive detection of Cu2+ (Scheme 1). Compared with conventional methods, the present strategy have two advantages: (i) relatively good electrochemical properties because of the presence of h-TiO2 microspheres and (ii) high selectivity of Cu2+ detection caused by the high density of rhodamine in the 3D network of TiO2@PPAA-RhB.
2 Experimental section
2.1 Chemicals and materials
Acrylic acid, N-hydroxysuccinimide (NHS), 1-ethyl-3-(3-dimethylaminoprolyl) carbodiimide hydrochloride (EDC), n-butyl titanate, RhB, and anhydrous glucose were obtained from Aladdin (Shanghai, China). K4[Fe(CN)6]·H2O and K3[Fe(CN)6] were purchased from Alfa Aesar. All other reagents used were of analytical grade and employed as received.2.2 Solutions
Phosphate buffer solution (PBS,0.1 M, pH 7.4) was prepared by mixing the stock solution of 0.1 M NaH2PO4 and 0.1 M K2HPO4 with the proportion of v(Na2HPO4)![[thin space (1/6-em)]](https://www.rsc.org/images/entities/char_2009.gif) :
:![[thin space (1/6-em)]](https://www.rsc.org/images/entities/char_2009.gif) v(KH2PO4) = (8
v(KH2PO4) = (8![[thin space (1/6-em)]](https://www.rsc.org/images/entities/char_2009.gif) :
:![[thin space (1/6-em)]](https://www.rsc.org/images/entities/char_2009.gif) 2). A TiO2@PPAA-modified gold electrode was activated by incubating the electrodes at 4 °C for 2 h in PBS (pH 7.4) containing 1 mM NHS and 4 mM EDC. The RhB solution was dissolved in ethanol (0.1 mM). Different Cu2+ concentrations were diluted from the stock of 1 mM CuSO4 solution. Interference ions were diluted from the stock of 1 mM MnSO4, CoSO4, NiSO4, AgNO3, Pb(NO3)2, MgCl2, and ZnCl2 solutions.
2). A TiO2@PPAA-modified gold electrode was activated by incubating the electrodes at 4 °C for 2 h in PBS (pH 7.4) containing 1 mM NHS and 4 mM EDC. The RhB solution was dissolved in ethanol (0.1 mM). Different Cu2+ concentrations were diluted from the stock of 1 mM CuSO4 solution. Interference ions were diluted from the stock of 1 mM MnSO4, CoSO4, NiSO4, AgNO3, Pb(NO3)2, MgCl2, and ZnCl2 solutions.
2.3 Characterization
Chemical structures and components of TiO2, TiO2@PPAA, and TiO2@PPAA-RHB were characterized by Fourier transform infrared (FT-IR) and X-ray photoelectron spectroscopy (XPS). FT-IR spectra of the samples were acquired from samples in KBr pellets by using a Nicolet 5700 FT-IR instrument within the range of 400–4000 cm−1. XPS data were acquired using an AXIS HIS 165 spectrometer (Kratos Analytical, Manchester, UK) with a monochromatized Al KR X-ray source (1486.71 eV photons). Field emission scanning electron microscopy images (FE-SEM) were obtained using a JSM-6490LV SEM (Japan). Meanwhile, transmission electron microscopy (TEM) images were acquired using TEM [JEOL-2100 (UHR)]. UV-vis spectra were obtained through a computer-controlled UV-vis spectrometer (TU-1201, Beijing Instrument Company).2.4 Electrochemical measurements
All electrochemical measurements were performed using a CHI660D electrochemical workstation (Shanghai CH Instrument Company, Shanghai, China) and via a conventional three-electrode system composed of a gold electrode, a Pt slide auxiliary electrode, and a Ag/AgCl reference electrode in a 1![[thin space (1/6-em)]](https://www.rsc.org/images/entities/char_2009.gif) :
:![[thin space (1/6-em)]](https://www.rsc.org/images/entities/char_2009.gif) 1 mixture of 5 mM K3[Fe(CN)6]/K4[Fe(CN)6], 0.14 M NaCl, and 2 mM KCl. In cyclic voltammetry (CV) experiments, the scan rate was 100 mV s−1. Electrochemical impedance spectra (EIS) was performed in a frequency range of 1 mHz–1 MHz and analyzed using Zview2 software, which is described in the ESI† (Fig. S1). All electrochemical experiments were carried out at room temperature (25 ± 1 °C). Three parallel experiments were conducted for each measurement, and their average values were applied in the present work.
1 mixture of 5 mM K3[Fe(CN)6]/K4[Fe(CN)6], 0.14 M NaCl, and 2 mM KCl. In cyclic voltammetry (CV) experiments, the scan rate was 100 mV s−1. Electrochemical impedance spectra (EIS) was performed in a frequency range of 1 mHz–1 MHz and analyzed using Zview2 software, which is described in the ESI† (Fig. S1). All electrochemical experiments were carried out at room temperature (25 ± 1 °C). Three parallel experiments were conducted for each measurement, and their average values were applied in the present work.
2.5 Construction of the developed electrochemical sensor
3. Results and discussion
The chemical structure of the h-TiO2@PPAA composite depended on the plasma input power used. The FT-IR spectra of the h-TiO2@PPAA composite deposited at 20 W exhibited high intensity of the remaining carboxyl groups, which would facilitate RhB binding (Fig. S2, ESI†). Therefore, more Cu2+ ions can be coordinated with RhB and determined.3.1 Surface morphology of the h-TiO2@PPAA nanocomposite
Fig. 1 shows SEM and TEM analyses on the as-prepared h-TiO2 microspheres and h-TiO2@PPAA nanocomposites. As shown in Fig. 1a, SEM images show a spherical morphology with a diameter approximately 300–420 nm. The spherical balls also indicate a porous microstructure. After PPAA deposition onto the surface of h-TiO2 microspheres, a dense layer of the composite with a rough surface was observed (Fig. 1b and c). Fig. 1d illustrates the typical TEM images of the h-TiO2@PPAA composite in high magnification. h-TiO2 microspheres are uniformly covered by the PPAA layer. The wall thickness of the TiO2@PPAA microcomposite is approximately 25–33 nm, as estimated from Fig. 1e. The high-resolution lattice image shown in Fig. 1f indicates that h-TiO2 is well crystallized into the single anatase phase with a crystallographic spacing of 0.34 nm, which is the preferred [101] growth direction.27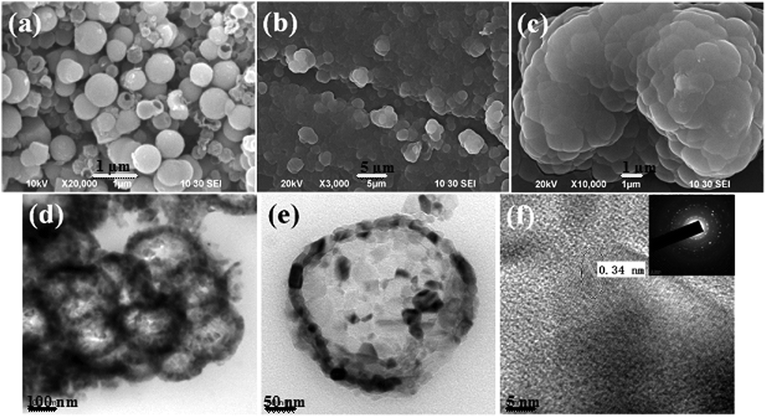 | ||
| Fig. 1 SEM images of (a) h-TiO2 microspheres and (b and c) TiO2@PPAA composites deposited at 20 W for 1 min, and (d–f) TEM images. | ||
3.2 Chemical structure of the h-TiO2@PPAA-RhB composite
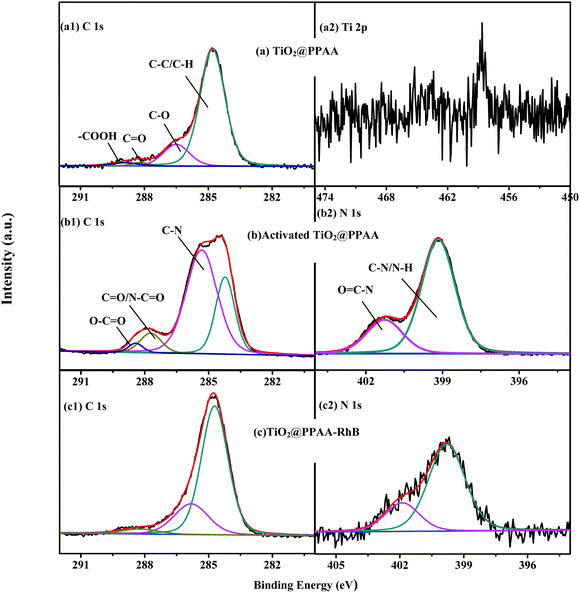
The modification procedure of the h-TiO2@PPAA composite with RhB was characterized using XPS, thus providing a detailed variation of chemical structures and components of the composite surface. As shown in Fig. S3 (ESI†), the XPS survey scan spectra of the samples at different steps, including the h-TiO2@PPAA composite deposited at 20 W for 1 min, activation of the nanocomposite using EDC/NHS, and modification of the nanocomposites with RhB (h-TiO2@PPAA-RhB), show the presence of C 1s and O 1s. After activation via EDC/NHS and subsequent modification with RhB, an additional N 1s signal was observed in curves b and c. Table S1 (ESI†) summarizes the corresponding atomic% of the samples at different steps. The high-resolution XPS spectra of each element further reveal the variations of the surface functional groups of the h-TiO2@PPAA composite after being activated through EDC/NHS and modified by RhB. The high-resolution XPS spectrum of C 1s contained in the h-TiO2@PPAA nanocomposite can be fitted by four peaks at ∼284.8, ∼286.5, ∼288.2, and ∼288.9 eV, which correspond to C–C/C–H, C–O, C![[double bond, length as m-dash]](https://www.rsc.org/images/entities/char_e001.gif) O, and O
O, and O![[double bond, length as m-dash]](https://www.rsc.org/images/entities/char_e001.gif) C–O groups, respectively (Fig. 2a). After activation, a new peak at the binding energy (BE) of ∼285.32 eV was observed (Fig. 2b), which was caused by the C–N groups. When the carboxyl groups contained in h-TiO2@PPAA-RhB were transferred to the activated ester groups, the nitrogen elements were introduced. Thus, the possible presence of N–C
C–O groups, respectively (Fig. 2a). After activation, a new peak at the binding energy (BE) of ∼285.32 eV was observed (Fig. 2b), which was caused by the C–N groups. When the carboxyl groups contained in h-TiO2@PPAA-RhB were transferred to the activated ester groups, the nitrogen elements were introduced. Thus, the possible presence of N–C![[double bond, length as m-dash]](https://www.rsc.org/images/entities/char_e001.gif) O at ∼287.72 and O
O at ∼287.72 and O![[double bond, length as m-dash]](https://www.rsc.org/images/entities/char_e001.gif) C–O at ∼288.42 eV in the activated composites was proven. However, after surface modification by RhB, only three peaks in the high-resolution XPS spectra of C 1s were obtained (Fig. 2c). These peaks include ∼284.71, ∼285.81, and ∼288.21 eV, which are attributed to C–C/C–H, C–N, and N–C
C–O at ∼288.42 eV in the activated composites was proven. However, after surface modification by RhB, only three peaks in the high-resolution XPS spectra of C 1s were obtained (Fig. 2c). These peaks include ∼284.71, ∼285.81, and ∼288.21 eV, which are attributed to C–C/C–H, C–N, and N–C![[double bond, length as m-dash]](https://www.rsc.org/images/entities/char_e001.gif) O groups, respectively. The results show that the carboxyl groups of h-TiO2@PPAA composite are fully changed to the N–C
O groups, respectively. The results show that the carboxyl groups of h-TiO2@PPAA composite are fully changed to the N–C![[double bond, length as m-dash]](https://www.rsc.org/images/entities/char_e001.gif) O groups via RhB modification, thereby leading to the chemical bonding of RhB onto the composite via this feasible method. Furthermore, according to the peak area, the relative content of each functional group can be evaluated. The C–N density in the activated h-TiO2@PPAA was higher than that in the h-TiO2@PPAA-RhB because of the introduction of other RhB components. The high N% of activated h-TiO2@PPAA (16.95%) was also proven. As shown in Fig. 2b, the high-resolution XPS spectrum of N 1s in the activated h-TiO2@PPAA is fitted into two parts, with BEs of ∼399.16 and ∼401.26 eV assigned with N–H/C–N and O
O groups via RhB modification, thereby leading to the chemical bonding of RhB onto the composite via this feasible method. Furthermore, according to the peak area, the relative content of each functional group can be evaluated. The C–N density in the activated h-TiO2@PPAA was higher than that in the h-TiO2@PPAA-RhB because of the introduction of other RhB components. The high N% of activated h-TiO2@PPAA (16.95%) was also proven. As shown in Fig. 2b, the high-resolution XPS spectrum of N 1s in the activated h-TiO2@PPAA is fitted into two parts, with BEs of ∼399.16 and ∼401.26 eV assigned with N–H/C–N and O![[double bond, length as m-dash]](https://www.rsc.org/images/entities/char_e001.gif) C–N groups, respectively. The same peaks were observed in the N 1s high-resolution spectrum of the modified composite (Fig. 2c). Apart from the observed C 1s and N 1s in the samples, an extremely weak Ti 2p signal was obtained because the TiO2 layer was completely covered by the polymerized plasma film (Fig. 2a).
C–N groups, respectively. The same peaks were observed in the N 1s high-resolution spectrum of the modified composite (Fig. 2c). Apart from the observed C 1s and N 1s in the samples, an extremely weak Ti 2p signal was obtained because the TiO2 layer was completely covered by the polymerized plasma film (Fig. 2a).
3.3 Cu2+ detection using the fabricated electrochemical sensor
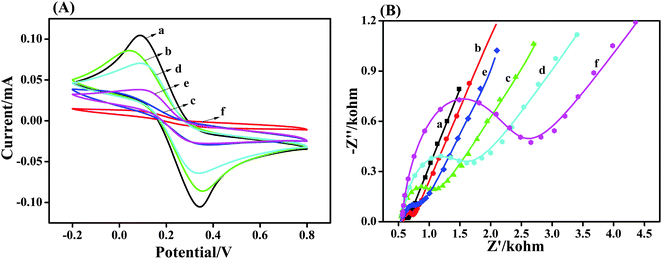
CV was employed to monitor the fabrication process of the electrochemical sensor using an [Fe(CN)]3−/4− redox probe. CV provides information about the integrity properties of surface modification on gold surfaces, such as defects, insulating properties, and density of the adsorbed layer. Fig. 3a shows the CVs recorded for the bare gold electrode, h-TiO2 microspheres-(h-TiO2/Au), h-TiO2@PPAA-(h-TiO2@PPAA/Au), activated h-TiO2@PPAA-(A-h-TiO2@PPAA/Au), and h-TiO2@PPAA-RhB-modified electrode (h-TiO2@PPAA-RhB/Au). Moreover, h-TiO2@PPAA-RhB/Au was incubated in Cu2+ solution for 0.5 h and recorded by CV. Fig. 3a shows a well-defined quasi-reversible redox cyclic voltammogram with an anodic to cathodic peak ratio of approximately one and peak-to-peak separation ΔEp of 256 mV for the bare gold electrode (curve a). After dropping the h-TiO2 nanospheres onto the gold electrode (curve b), the reversibility was maintained the same as that for the bare gold electrode, and the peak current (Ia = 86 μA) was significantly lower than that of the bare gold electrode (Ia = 106 μA). Furthermore, the ΔEp between the reduction and oxidation waves increased to 314 mV, hence suggesting that the h-TiO2 nanospheres decreased the electrode conductivity and reduced the electrode transfer rate between the redox probe and the electrode surface.28 For the h-TiO2@PPAA composite-modified electrode (curve c), the peak current value (Ia = 70.6 μA) decreased substantially with a reduced peak current of 36.5 μA. This result indicates that the coverage of polymerized plasma film evidently prevents the electron transfer and exhibits relatively varying low electrochemical activity.29 However, when the h-TiO2@PPAA composite was activated using EDC/NHS (curve d), the peak current increased to 70.7 μA. Therefore, activation can promote electron transfer at the interface.30 As the peak current decreased again because of the modification with RhB, the layer with low electrochemical activity was formed between the activated composite and RhB.7,31 The peak current further decreased to the lowest value when Cu2+ ions were coordinated with RhB (h-TiO2@PPAA-RhB-Cu2+/Au), which may be due to the insulation layer produced.26EIS is another informative and commonly used technique to investigate biosensors. This technique is applied in this study, in parallel with CV measurement, for the characterization of an h-TiO2@PPAA electrochemical sensing process (Fig. 3b). The impedance spectra represented in the Nyquist plot are composed of semicircles at high frequencies, which indicate an electron transfer process, and a linear part at low frequencies that correspond to the diffusion-controlled process. Modified Randles equivalent circuit was employed to fit the impedance spectra of the h-TiO2@PPAA electrochemical sensing (Fig. S1, ESI†). This circuit consists of the electrolyte resistance between the working and reference electrodes, Rs; Warburg impedance associated with the diffusion process of redox probe ions from the bulk solution to the electrode-solution interface, Zw; electron transfer resistance, Ret; and constant phase element CPE (related to the double-layer capacitance) (Table S2, ESI†).
R et shows the largest variation during the assembly process of electrochemical sensing. Therefore, Ret is more suitable as a parameter for sensing the interfacial properties of the prepared sensing during the fabrication steps. The bare gold electrode exhibited a small semicircle at high frequency (curve a) of the Ret value (50.21 Ω). After dropping the h-TiO2 microspheres on the surface of the gold electrode h-TiO2/Au (curve b), the Ret value of the composite electrode increased to 139.9 Ω; it further increased to 426.8 Ω after the deposition of the PPAA layer (curve c). This observation may be attributed to the combined low conductivity of the plasma polymer, which efficiently promotes the electron transfer resistance, consequently decreasing the diffusion-controlled process.32 The deposited PPAA containing the negatively charged carboxyl groups in aqueous solution may also cause electron transfer retardation between the electrode surface and the negative [Fe(CN)6]3−/4− probe. However, the Ret value decreased to 354.2 Ω because of the activation using EDC/NHS.33 As RhB was applied to modify the activated electrode, the Ret value substantially increased to 797.2 Ω. The coordination of Cu2+ with the surface of the h-TiO2@PPAA-RhB/Au electrode (curve e) enlarged the semicircle diameter, and Ret significantly increased to 1510 Ω because of the electrode surface blockage by the h-TiO2@PPAA-RhB-Cu2+.7 The results obtained from EIS measurements agree with the results extracted from CV, thus confirming again the successful coordination of Cu2+ on the RhB-modified h-TiO2@PPAA-RhB/Au electrode and fabrication of Cu2+ sensing.
The same electrochemical measurements of Cu2+ detection were carried out to investigate the direct adsorption efficiency of Cu2+ by utilizing different modified electrodes using the h-TiO2 microspheres, pristine PPAA nanofilm, and h-TiO2@PPAA composites (Fig. S4, ESI†). The continuous increase of Ret values was also observed during Cu2+ detection (Fig. S5, ESI†). Comparing the three samples, PPAA nanofilm exhibited the poorest electrochemical performance, with the highest Ret value of 1.34 kohm, whereas the hollow TiO2 microspheres showed a relatively good electrochemical activity. In addition, the results exhibited that Cu2+ ions in the water can be adsorbed onto three kinds of materials, in which the adsorption efficiency of Cu2+ onto the h-TiO2@PPAA composite is the most promising. The sorption of Cu(II) by h-TiO2 occurs through the formation of inner-sphere surface complexes, which originated from the interaction of Cu2+ with the hydroxyl groups of the TiO2 surface.34 For the PPAA nanofilm, the –COOH groups were deprotonated, thereby resulting in the negatively charged ligands (–COO−), which easily attract positively charged Cu2+.35 The intensity of –COOH contained in PPAA is not extremely high, thus leading to the small amounts of Cu2+ on its surface. Consequently, h-TiO2 cannot only enhance the electrochemical properties of PPAA but also improve the adsorption amounts of Cu2+, so that the h-TiO2@PPAA composite can be used as an electrode material for sensing. However, the developed h-TiO2@PPAA composite also shows high adsorption efficiency toward other metal ions, such as Pb2+, Co2+, Mn2+, Ni2+, Zn2+, and Mg2+ (Fig. S6, ESI†). The metal ions could possibly coordinate with the carboxylic acid groups and form an inner-sphere complex structure.41 Hence, modifying the h-TiO2@PPAA composite for its selectivity toward Cu2+ ions is necessary.
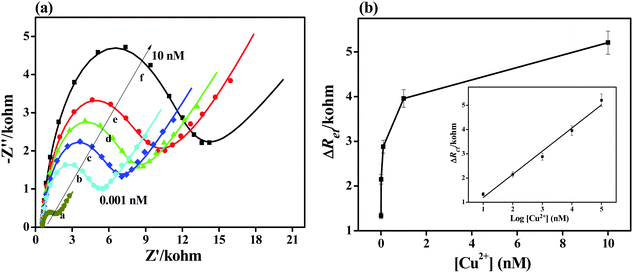
3.4 Sensitivity of the fabricated electrochemical sensor toward Cu2+ detection
Fig. 4 shows the impedance spectra for the electrochemical sensor obtained from various Cu2+ concentrations. The diameter of the semicircle gradually increases in the Nyquist plots as the Cu2+ concentration is increased (Fig. 4a). This observation indicates a significant increase in the electron transfer resistance and thus increases the barrier for the electron transfer between the redox probe and the electrode surface. The relative electron transfer resistance values ΔRet = Ret,(2) − Ret,(1) were used; Ret,(2) and Ret,(1) are the electron transfer resistances of the RhB layer before and after binding with Cu2+, respectively.As shown in Fig. 4, a linear increase in ΔRet is obtained with increasing Cu2+ concentrations from 0.001 nM to 10 nM by using the regression equation ΔRet = 0.241 + 0.955![[thin space (1/6-em)]](https://www.rsc.org/images/entities/char_2009.gif) log(C) nM, R2 = 0.983. And it has a very low limit of detection (LOD), down to 0.404 pM based on a multiple of 3 the standard deviation of the baseline signal. The samples were dipped in 1 nM Cu2+ standard solution four times and the impedance responses were recorded to further investigate the reproducibility of the developed Cu2+ sensor. The LOD was not only more superior than the previously reported methods (Table 1) but also lower than the maximum level of Cu in drinking water permitted by the United States Environmental Protection Agency.42
log(C) nM, R2 = 0.983. And it has a very low limit of detection (LOD), down to 0.404 pM based on a multiple of 3 the standard deviation of the baseline signal. The samples were dipped in 1 nM Cu2+ standard solution four times and the impedance responses were recorded to further investigate the reproducibility of the developed Cu2+ sensor. The LOD was not only more superior than the previously reported methods (Table 1) but also lower than the maximum level of Cu in drinking water permitted by the United States Environmental Protection Agency.42
| Sensitive layer | Detection technology | Linear range | LOD | Ref. |
|---|---|---|---|---|
| Adamantane-modified rhodamine and cyclodextrin-modified Fe3O4@SiO2 | UV-vis spectra | 0.01–10 mM | 5.99 μM | 36 |
| P(NIPAM-co-RHBBA) | UV-vis spectra | 0–20 μM | 0.18 μM | 37 |
| Rhodamine B-based fluorescent probe RL | Fluorescence and adsorption spectra | 0–8 μM | 0.739 nM | 38 |
| Graphite-like carbon nitride | Electrogenerated chemiluminescence | 2.5–100 nM | 0.9 nM | 39 |
| Carbon dot-based silica nanoparticles | Fluorescence spectra | 0–10 μM | 35.2 nM | 40 |
| TiO2 modified by fluorescein hydrozin-3,6-diacetic acid | EIS | 5 pM–1 μM | 4.29 pM | 26 |
| h-TiO2@PPAA-RhB | EIS | 1 pM–10 nM | 0.404 pM | This work |
3.5 Selectivity
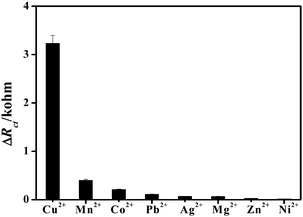
The complexity of the water system presents a significant challenge to the analytical methods for metal ion detection not only in sensitivity but also more importantly in selectivity. Selectivity experiments were carried out by monitoring the Ret value of the h-TiO2@PPAA-RhB/Au electrode in the Fe(CN)63−/4− solution with the addition of other metal ions. Various metal ions, such as Mn2+, Co2+, Pb2+, Ag+, Mg2+, Zn2+, and Ni2+, with 100-fold concentration as that of Cu2+ were initially tested. Remarkably, as shown in Fig. 5, no evident electrochemical responses were observed for the other metal ions compared with that obtained for Cu2+. Furthermore, these potential metal ion interferences showed negligible effects on the electrochemical signal for Cu2+ sensing. The high selectivity of the present biosensor for Cu2+ should be ascribed to the specific and stable affinity of RhB toward Cu2+. In conclusion, the described protocol based on h-TiO2@PPAA-RhB could be generalized for other heavy ions by changing the specific fluorescence target for targeted ion testing with high specificity and sensitivity.3.6 Real samples
The practical application of the developed chemical sensing for detecting Cu2+ was measured by determining the apparent recovery of the spiked Cu2+ ions in tap water and river water. The sample was filtered through 0.2 μm membranes to remove impurities. Subsequently, standard Cu2+ solutions with different concentrations (0.001, 0.01, and 0.1 nM) were added to the pretreated water sample. The spiked samples were analyzed separately using the designed electrochemical sensor; the results are shown in Table 2. Apparent recovery values that range from 102% to 130% were obtained, which indicate that the designed sensor is applicable for analyzing Cu2+ in real water.| Real sample | Amount added (nM) | ΔRet (kohm) | Found (nM) | Recovery (%) | RSD% |
|---|---|---|---|---|---|
| Tap water | 0.001 | 0.30 | 0.0012 | 120 | 1.3 |
| 0.01 | 3.10 | 0.0123 | 123 | 1.8 | |
| 0.1 | 3.72 | 0.106 | 106 | 2.5 | |
| River water | 0.001 | 0.33 | 0.0013 | 130 | 2.1 |
| 0.01 | 3.22 | 0.011 | 110 | 2.7 | |
| 0.1 | 3.69 | 0.098 | 102 | 3.1 | |
4. Conclusions
In summary, a highly sensitive and selective electrochemical sensing is reported for the quantitative detection of Cu2+ based on the rhodamine B-modified h-TiO2@PPAA composites via the coordination between Cu2+ and rhodamine B. The synergistic effect of the presence of TiO2 and PPAA promoted Cu2+ adsorption and subsequently enhanced detection sensitivity. ΔRet before and after Cu2+ addition allowed the detection and quantitative analysis with a low limit of detection of 0.404 pM within the range of 0.001–10 nM (R2 = 0.9828). Excellent selectivity toward interfering metal ions, such as Mn2+, Co2+, Pb2+, Ag+, Mg2+, Zn2+, and Ni2+, can be obtained. Therefore, this new strategy may offer a new approach for the development of sensitive sensors for Cu2+ determination and could find widespread environmental applications. However, since plasma polymers were not very stable in aqueous solution, it is time-consuming for the fabrication of the electrochemical sensors more or less.Acknowledgements
This work was supported by Program for the National Natural Science Foundation of China (NSFC: Account No. 51173172) and Science and Technology Opening Cooperation Project of Henan Province (Account No. 132106000076).Notes and references
- P. Wang, L. Liu, P. Zhou, W. Wu, J. Wu, W. Liu and Y. Tang, Biosens. Bioelectron., 2015, 72, 80–86 CrossRef CAS PubMed.
- J. Wang and Q. Zong, Sens. Actuators, B, 2015, 216, 572–577 CrossRef CAS.
- S. Hu, J. Song, F. Zhao, X. Meng and G. Wu, Sens. Actuators, B, 2015, 215, 241–248 CrossRef CAS.
- K. Kandasamy, S. Ganesabaskaran, M. P. Pachamuthu and A. Ramanathan, Spectrochim. Acta, Part A, 2015, 148, 184–188 CrossRef CAS PubMed.
- S. Arain, T. Kazi, H. Afridi, N. Ullah, M. Arain and A. Panhwar, Anal. Methods, 2015, 7, 3431–3437 RSC.
- H. Shoaee, M. Roshdi, N. Khanlarzadeh and A. Beiraghi, Spectrochim. Acta, Part A, 2012, 98, 70–75 CrossRef CAS PubMed.
- M. Kang, D. Peng, Y. Zhang, Y. Yang, L. He, F. Yan, S. Sun, S. Fang, P. Wang and Z. Zhang, New J. Chem., 2015, 39, 3137–3144 RSC.
- Y. Chang, Y. Chai, S. Xie, Y. Yuan, J. Zhang and R. Yuan, Analyst, 2014, 139, 4264–4269 RSC.
- E. Abdel-Halim and S. S. Al-Deyab, React. Funct. Polym., 2014, 75, 1–8 CrossRef CAS.
- C. Mbareck, Q. T. Nguyen, O. T. Alaoui and D. Barillier, J. Hazard. Mater., 2009, 171, 93–101 CrossRef CAS PubMed.
- G. Zeng, Y. Liu, L. Tang, G. Yang, Y. Pang, Y. Zhang, Y. Zhou, Z. Li, M. Li and M. Lai, Chem. Eng. J., 2015, 259, 153–160 CrossRef CAS.
- M. Cvek, M. Mrlik, M. Ilcikova, T. Plachy, M. Sedlacik, J. Mosnacek and V. Pavlinek, J. Mater. Chem. C, 2015, 3, 4646–4656 RSC.
- Y. Nakagawa, S. Nakasako, S. Ohta and T. Ito, Carbohydr. Polym., 2015, 117, 43–53 CrossRef CAS PubMed.
- W. Zhang, X. Shi, Y. Zhang, W. Gu, B. Li and Y. Xian, J. Mater. Chem. A, 2013, 1, 1745–1753 RSC.
- P. Rivolo, S. M. Severino, S. Ricciardi, F. Frascella and F. Geobaldo, J. Colloid Interface Sci., 2014, 416, 73–80 CrossRef CAS PubMed.
- F. Michelotti and E. Descrovi, Appl. Phys. Lett., 2011, 99, 231107 CrossRef.
- G. Gangadhara, U. Maheshwarib and S. Guptac, Nanosci. Nanotechnol., 2012, 2, 141 Search PubMed.
- C. Yu, Y. Wen, X. Qin and J. Zhang, Anal. Methods, 2014, 6, 9825–9830 RSC.
- D. Guo, Z. Dong, C. Luo, W. Zan, S. Yan and X. Yao, RSC Adv., 2014, 4, 5718–5725 RSC.
- H. Zhang, X. Zeng, D. Chen, Y. Guo, W. Jiang, L. Xu and F. Fu, RSC Adv., 2015, 5, 45847–45852 RSC.
- D. Wan, G. Wang, W. Li, K. Chen, L. Lu and Q. Hu, Appl. Surf. Sci., 2015, 349, 988–996 CrossRef CAS.
- Z. Q. Li, Y. P. Que, L. E. Mo, W. C. Chen, Y. Ding, Y. M. Ma, L. Jiang, L. Hu and S. Dai, ACS Appl. Mater. Interfaces, 2015, 7, 10928–10934 Search PubMed.
- J. Hu and H. J. Shipley, Sci. Total Environ., 2012, 431, 209–220 CrossRef CAS PubMed.
- X. Xie and L. Gao, Curr. Appl. Phys., 2009, 9, S185–S188 CrossRef.
- S. Yoon and A. Manthiram, J. Phys. Chem. C, 2011, 115, 9410–9416 CrossRef CAS.
- M. Kang, M. Wang, S. Zhang, X. Dong, L. He, Y. Zhang, D. Guo, P. Wang, S. Fang and Z. Zhang, Electrochim. Acta, 2015, 161, 186–194 CrossRef CAS.
- Q. Shang, X. Tan, T. Yu, Z. Zhang, Y. Zou and S. Wang, J. Colloid Interface Sci., 2015, 445, 134–444 CrossRef PubMed.
- Z. Yang, Y. Xu, J. Li, Z. Jian, S. Yu, Y. Zhang, X. Hu and D. D. Dionysiou, Microchim. Acta, 2015, 1–8 Search PubMed.
- T. Homma, M. Kondo, T. Kuwahara and M. Shimomura, Eur. Polym. J., 2015, 62, 139–144 CrossRef CAS.
- Z. Zhang, S. Zhang, L. He, D. Peng, F. Yan, M. Wang, J. Zhao, H. Zhang and S. Fang, Biosens. Bioelectron., 2015, 74, 384–390 CrossRef CAS PubMed.
- J. Austin, I. Harrison and T. Quickenden, J. Phys. Chem., 1986, 90, 1839–1843 CrossRef CAS.
- C. M. Weikart, Y. Matsuzawa, L. Winterton and H. K. Yasuda, J. Biomed. Mater. Res., 2001, 54, 597–607 CrossRef CAS PubMed.
- R. Pauliukaite, M. E. Ghica, O. Fatibello-Filho and C. M. Brett, Electrochim. Acta, 2010, 55, 6239–6247 CrossRef CAS.
- C. Ludwig and P. W. Schindler, J. Colloid Interface Sci., 1995, 169, 284–290 CrossRef CAS.
- N. Li and R. Bai, Ind. Eng. Chem. Res., 2006, 45, 7897–7904 CrossRef CAS.
- Y. Zhang, W. Wang, Q. Li, Q. Yang, Y. Li and J. Du, Talanta, 2015, 141, 33–40 CrossRef CAS PubMed.
- G. Li, F. Tao, H. Wang, Y. Li and L. Wang, Sens. Actuators, B, 2015, 211, 325–331 CrossRef CAS.
- Y. Yuan, S. Sun, S. Liu, X. Song and X. Peng, J. Mater. Chem. B, 2015, 3, 5261–5265 RSC.
- C. Cheng, Y. Huang, X. Tian, B. Zheng, Y. Li, H. Yuan, D. Xiao, S. Xie and M. M. Choi, Anal. Chem., 2012, 84, 4754–4759 CrossRef CAS PubMed.
- X. Liu, N. Zhang, T. Bing and D. Shangguan, Anal. Chem., 2014, 86, 2289–2296 CrossRef CAS PubMed.
- W. Li, H. Zhao, P. Teasdale, R. John and S. Zhang, React. Funct. Polym., 2002, 52, 31–41 CrossRef CAS.
- E. M. Thurman, D. A. Goolsby, M. T. Meyer, M. S. Mills, M. L. Pomes and D. W. Kolpin, Environ. Sci. Technol., 1992, 26, 2440–2447 CrossRef CAS.
Footnote |
| † Electronic supplementary information (ESI) available. See DOI: 10.1039/c5nj02483h |
| This journal is © The Royal Society of Chemistry and the Centre National de la Recherche Scientifique 2016 |

