
Selective detection of non-aromatic pesticides via cyclodextrin-promoted fluorescence modulation†
Dana J.
DiScenza
and
Mindy
Levine
*
Department of Chemistry, University of Rhode Island, 51 Lower College Road, Kingston, RI 02881, USA. E-mail: mlevine@chm.uri.edu; Fax: +1-401-874-5072; Tel: +1-401-874-4243
First published on 23rd November 2015
Abstract
Reported herein is the detection of aliphatic pesticides using cyclodextrin-promoted fluorescence modulation. The introduction of the pesticide leads to noticeable changes in the emission of a fluorophore held in close proximity by cyclodextrin, leading to a pesticide detection system that operates with 100% successful differentiation and low limits of detection.
Introduction
The widespread use of pesticides is of significant concern due to the known and suspected toxicities of many small-molecule pesticides,1 as well as their long-term environmental persistence.2 Currently used methods for pesticide detection overwhelmingly rely on chromatography for the purification of the small molecule pesticides, followed by mass spectrometry for accurate pesticide identification.3 Although such methods are highly sensitive for individual pesticides, they tend to suffer from tedious sample preparations, which limits the ability to conduct high throughput assays of multiple samples for multiple pesticide analytes.4 Newer detection methods such as nanoparticle-based Raman spectroscopy5 and electrochemical assays6 have recently been developed.The use of fluorescence-based methods for pesticide detection would be highly advantageous, as fluorescence spectroscopy is sensitive to even trace amounts of a target analyte,7 can rapidly generate response signals,8 and is amenable to the development of high throughput assays for rapid screening of multiple environmental samples.9 Fluorescence assays for non-photophysically active compounds such as organochlorine pesticides (compounds 1–4, Fig. 1) are complicated by the fact that the analytes themselves do not have notable fluorescence signals, and require either derivatization10 or an indirect method for efficient fluorescence detection.11
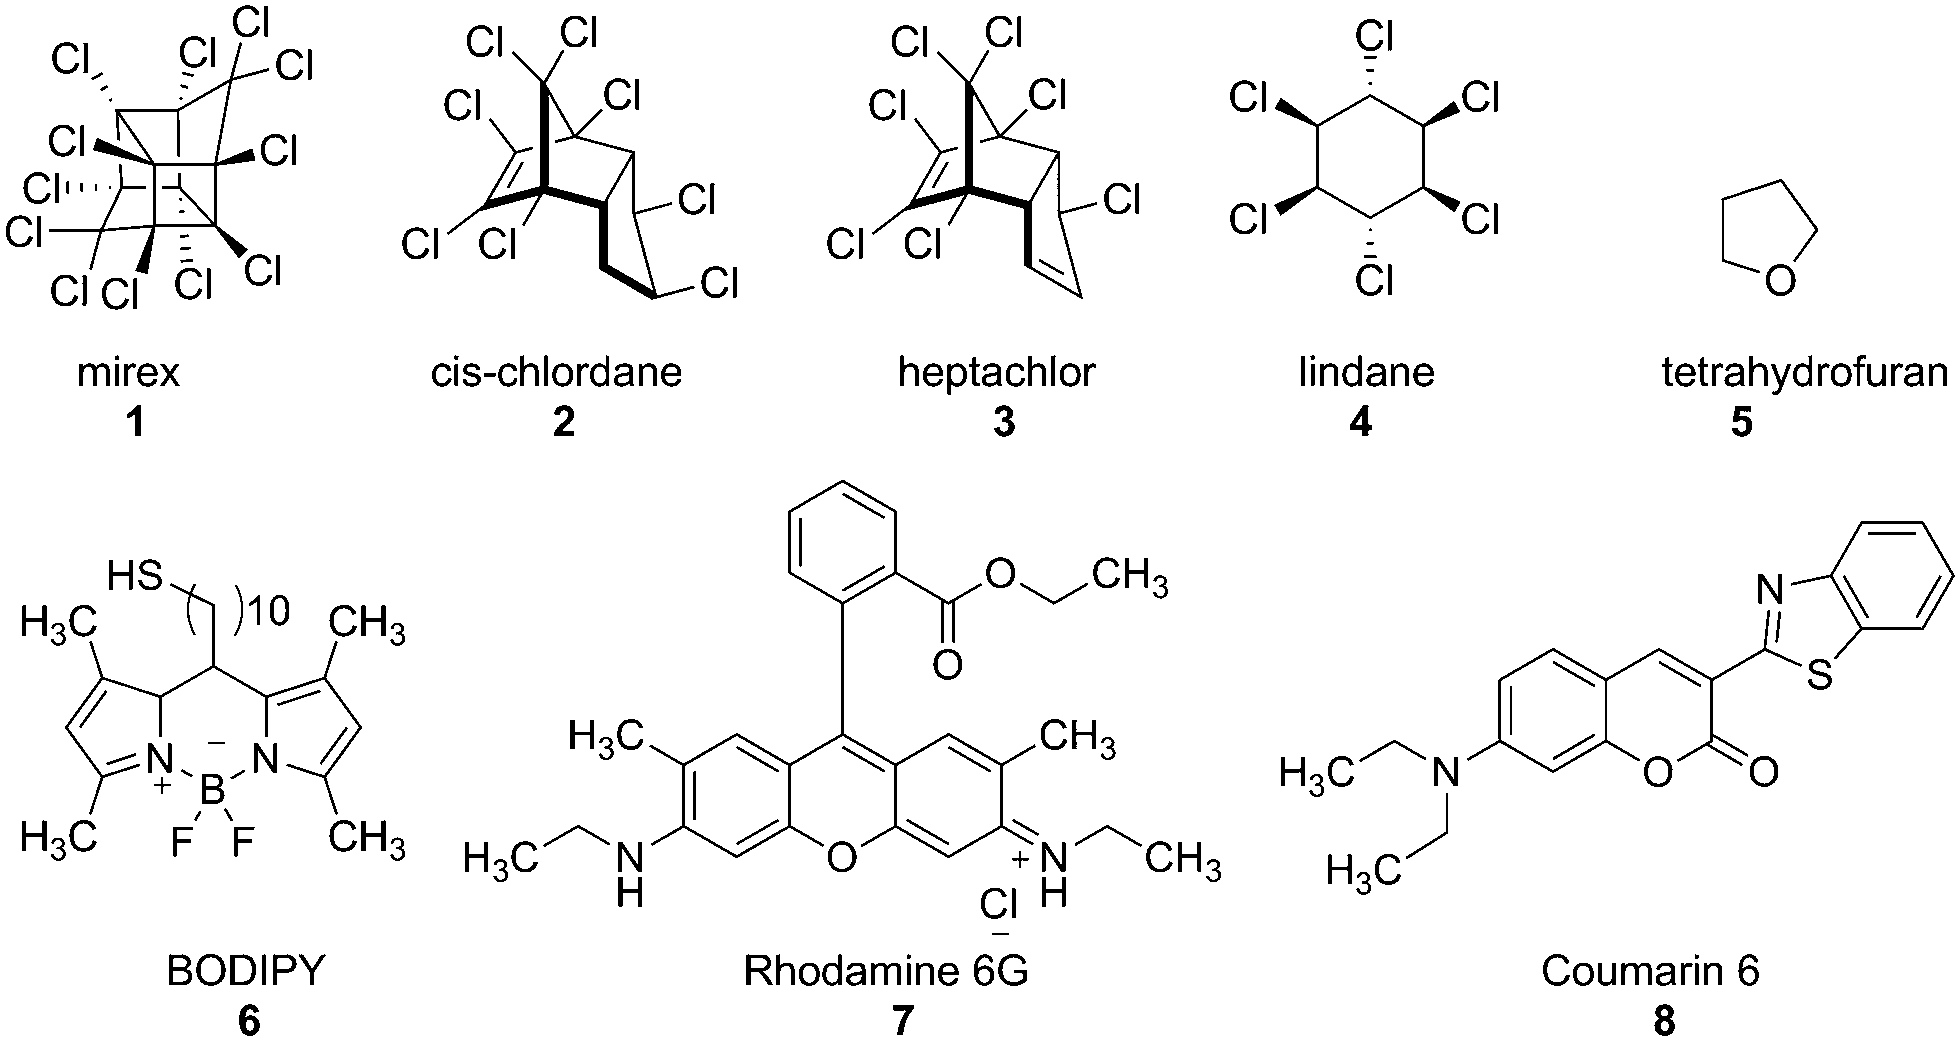 | ||
| Fig. 1 Pesticides (1–4), control analyte 5, and fluorophores (6–8) under investigation. | ||
Previous research in our laboratory led to the development of cyclodextrin-promoted energy transfer for the detection of aromatic toxicants and toxicant metabolites12 in multiple complex environments.13 This system uses the aromatic analytes as energy donors in combination with high quantum yield fluorophore acceptors, which are held in close proximity by the supramolecular cyclodextrin scaffold.
Recently, we have developed a new concept termed “fluorescence modulation,” which enables the detection of aliphatic analytes that do not participate in cyclodextrin-promoted energy transfer. These analytes are detectable through quantifying proximity-induced changes in the fluorescence spectrum of a high quantum yield fluorophore upon introduction of the analyte (Fig. 2), with the cyclodextrin acting as a supramolecular scaffold to ensure productive analyte-fluorophore interactions. Reported herein is the use of such fluorescence modulation for the sensitive and selective detection of aliphatic pesticides 1–4, with detection limits as low as 5.2 μM and 100% selectivity in array-based identification.
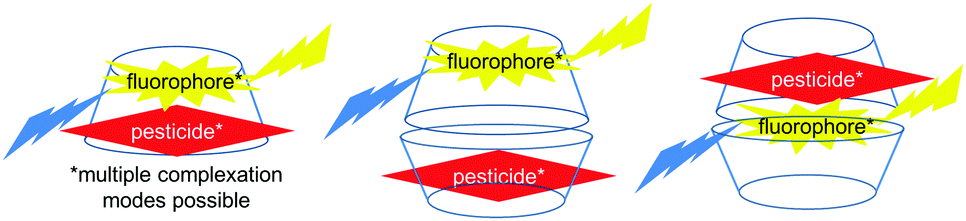 | ||
| Fig. 2 Schematic illustration of cyclodextrin-promoted fluorescence modulation with several potential association complexes. | ||
Experimental section
All analytes and cyclodextrins were obtained from Sigma-Aldrich. Fluorophore 6 was synthesized according to literature procedures.17 All fluorescence measurements were performed using a Shimadzu RF 5301 spectrophotometer. All fluorescence spectra were integrated vs. wavenumber on the X-axis using OriginPro. All arrays were generated using SYSTAT.Fluorescence modulation experiments: the fluorescence spectra were integrated vs. wavenumber on the X-axis, and fluorescence modulation was quantified using eqn (1).
Limit of detection experiments: The limit of detection (LOD) is defined as the lowest concentration of analyte at which a signal can be detected. The limit of quantification is defined at the lowest concentration of analyte that can be accurately quantified. These experiments were conducted following literature-reported procedures.5
Selection of cyclodextrins
A variety of cyclodextrin scaffolds were investigated, including β-cyclodextrin (β-CD) and methyl-β-cyclodextrin (Me-β-CD) that are known to bind to small molecule fluorophores.14 Also included were 2-hydroxypropyl-β-cyclodextrin (2-HPCD), which has been shown to promote proximity-induced energy transfer,15 and α-cyclodextrin (α-CD), which is capable of acting as a supramolecular scaffold despite its limited cavity size.16 All results were compared to those obtained in a cyclodextrin-free phosphate buffered saline (PBS) solution, buffered at pH 7.4.Selection of fluorophores
The fluorophores chosen have all been investigated previously for their ability to participate in cyclodextrin-promoted energy transfer.12 They are either commercially available (7 and 8) or were synthesized following literature-reported procedures.17Quantification of fluorescence changes
The changes in the fluorophore emission spectra of fluorophores 6–8 with introduction of the pesticide analyte were determined by combining small amounts of fluorophores 6–8 in tetrahydrofuran with a 10 mM aqueous cyclodextrin solution. The fluorescence emission of the fluorophores in the cyclodextrin solution were compared to their emission after the introduction of small amounts of pesticides 1–4 in tetrahydrofuran, and the results were quantified according to eqn (1):| Fluorophore ratio = (Flanalyte)/Flblank | (1) |
Results and discussion
When combined with fluorophore 6 in α-CD, β-CD, or 2-HPCD, compounds 1–4 induced significant increases in the fluorophore's emission spectra (Table 1). In each of these cases, the changes in fluorescence emission were even greater in the absence of a CD host (indicated by higher fluorophore emission ratios in PBS).| Analyte | α-CD | β-CD | Me-β-CD | 2-HPCD | PBS |
|---|---|---|---|---|---|
| 1 | 1.12 | 1.15 | 1.01 | 1.10 | 1.22 |
| 2 | 1.15 | 1.15 | 0.97 | 1.14 | 1.33 |
| 3 | 1.30 | 1.24 | 0.96 | 1.18 | 1.27 |
| 4 | 1.26 | 1.15 | 0.99 | 1.08 | 1.34 |
These results suggest that pesticide-fluorophore interactions result in increases in the fluorophore emission of compound 6, and that cyclodextrin hosts modulate the degree of fluorescence enhancement by partially shielding the fluorophore from such close interactions with the pesticide analytes. This hypothesis is supported by the limited fluorescence changes observed in Me-β-CD systems, which we have previously shown to be the most efficient cyclodextrin for the binding and extraction of fluorophore 6.13
Moreover, a closer examination of the absolute fluorescence intensities in each of the cyclodextrin hosts (Fig. 3) indicates that the fluorescence emission of compound 6 in methyl-β-cyclodextrin was markedly higher than its emission in any of the other hosts. Increases in absolute fluorescence intensity generally indicate strong binding in a supramolecular host (due to the elimination of non-radiative decay pathways),18 and support the hypothesis that strong binding of the fluorophore in the cyclodextrin (in this case fluorophore 6 in Me-β-CD) limits its intermolecular interactions with the pesticide analyte.
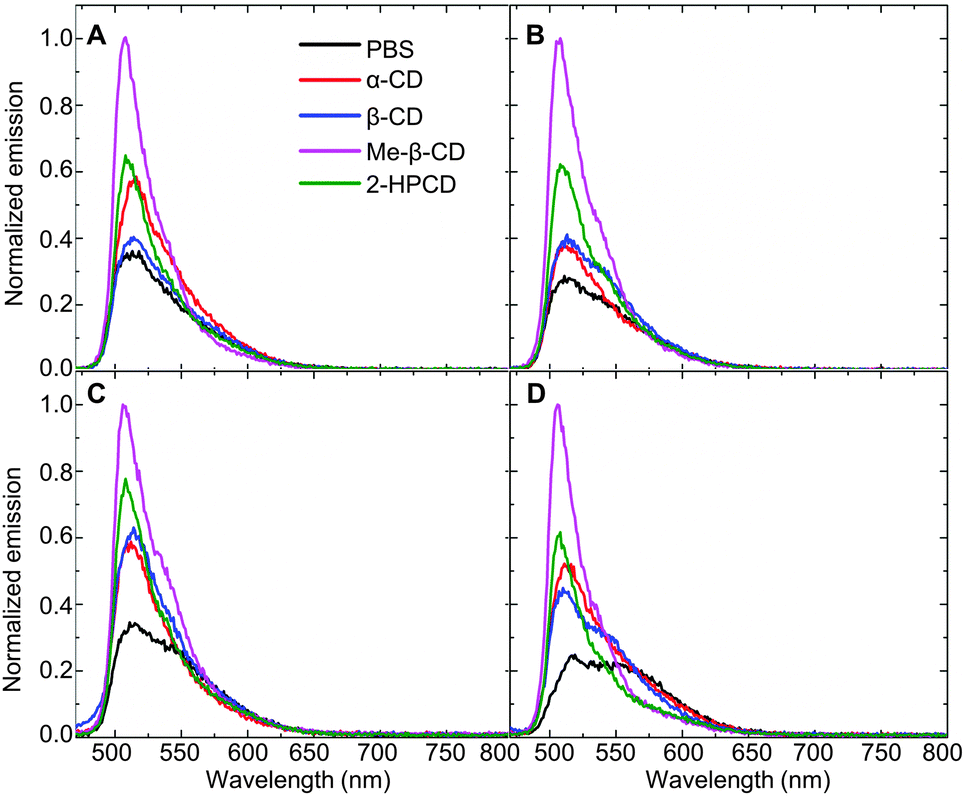 | ||
| Fig. 3 Fluorescence changes in fluorophore 6 upon introduction of: (A) analyte 1; (B) analyte 2; (C) analyte 3; and (D) analyte 4 (λex = 460 nm). | ||
Fluorophore 7 showed no significant changes in its fluorescence emission when combined with analytes 1 and 2 (Table 2). Analytes 3 and 4, by contrast, led to noticeable changes in the fluorescence emission of fluorophore 7 in the presence of α-CD, β-CD, 2-HPCD and in the absence of any CD. In the presence of Me-β-CD, no significant changes in fluorophore 7's emission spectrum was observed, in line with the results observed for fluorophore 6 and in good agreement with our previously reported results.13
| Analyte | α-CD | β-CD | Me-β-CD | 2-HPCD | PBS |
|---|---|---|---|---|---|
| 1 | 1.09 | 1.00 | 1.00 | 1.02 | 1.00 |
| 2 | 0.98 | 1.00 | 0.99 | 0.97 | 1.00 |
| 3 | 1.08 | 0.96 | 1.04 | 0.99 | 0.88 |
| 4 | 1.28 | 1.05 | 1.03 | 0.99 | 1.09 |
Fluorophore 8 showed an increase in fluorescence emission when combined with analytes 1–4 in the presence of α-CD; decrease in the fluorescence emission when combined with analytes 1–4 in the presence of Me-β-CD and 2-HPCD, and variable, analyte-dependent fluorescence changes when combined with analytes 1–4 in the presence of β-CD (Table 3). Uniform increases in fluorescence were observed in the absence of any CD, which supports the notion of pesticide-mediated fluorescence increases that are being attenuated in the presence of favorably interacting cyclodextrin hosts.
| Analyte | α-CD | β-CD | Me-β-CD | 2-HPCD | PBS |
|---|---|---|---|---|---|
| 1 | 1.21 | 1.01 | 0.97 | 0.88 | 1.22 |
| 2 | 1.07 | 1.03 | 0.87 | 0.94 | 1.10 |
| 3 | 1.08 | 1.24 | 0.94 | 0.88 | 1.23 |
| 4 | 1.21 | 1.08 | 0.83 | 0.94 | 1.23 |
Mechanism of differentiation
Each component of the system has structural features that facilitate intermolecular interactions: (a) Cyclodextrins bind small molecule guests using a range of intermolecular forces, including hydrophobic association, hydrogen bonding, and van der Waals interactions.19 (b) Fluorophores 6–8 can participate in intermolecular interactions through aromatic π-stacking,20 hydrophobic association and hydrogen bonding. (c) Pesticides 1–4 are expected to participate in intermolecular interactions largely through hydrophobic association and/or through intermolecular interactions with the chlorine moieties.21Electrostatic potential surfaces of pesticides 1–4 are shown in Fig. 4 and quantitative data is summarized in Table 4. These marked differences in solvent accessible surface area and in electrostatic potential surfaces contributes to the differences in the interactions of these analytes with fluorophores and cyclodextrins, which gives rise to the unique fluorescence modulation patterns. These patterns enable high levels of selectivity in array-based detection (vide infra), even though the quantitative binding constants of the analytes in β-cyclodextrin are relatively weak (Table 4).
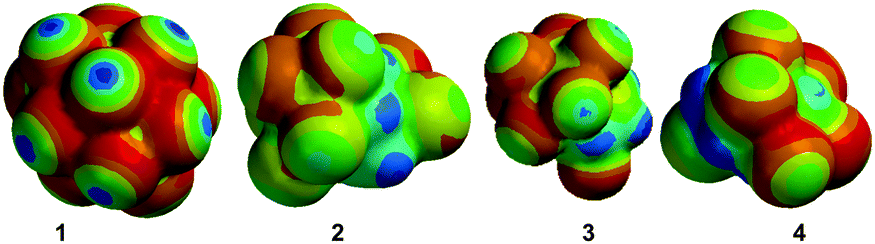 | ||
| Fig. 4 Electrostatic potential surfaces of analytes 1–4, calculated using Spartan 10, version 1.1.0. The red colour represents the electron-rich regions and the blue colour represents electron-deficient regions. | ||
| Analyte | Binding in β-CDa (mM−1) | Solvent-accessible surface areac (Å2) | Electrostatic potential (min/max)c (kJ mol−1) |
|---|---|---|---|
| a Calculated by 1H NMR titrations. b 1H NMR titrations indicated no measurable binding. c Calculated using Spartan 10, version 1.1.0. | |||
| 1 | 0.067 | 171 | −50/102 |
| 2 | 148 | −118/100 | |
| 3 | 0.067 | 160 | −75/150 |
| 4 | 0.017 | 139 | −96/174 |
Overall, the low degrees of fluorescence modulation and weak binding affinities observed in these systems indicate the possibility that variable binding geometries may exist, including those in which the pesticide and fluorophore are each bound to a different cyclodextrin molecule (Fig. 2).
Literature precedent shows that halogen atoms interact with planar aromatic surfaces under a variety of conditions.22 In our system, we observe a similar degree of intermolecular interactions between the halogenated pesticides 1–4 and the aromatic surface areas of fluorophores 6–8 in the cyclodextrin-free solution, which results in quantifiable enhancements in the fluorescence emission spectra. In the presence of a variety of cyclodextrin hosts, the fluorophores preferentially bind to the cyclodextrin (Ka in β-CD = 0.11 mM−1 for fluorophore 7; 0.30 mM−1 for fluorophore 8). In such cases, the introduction of the pesticide analyte leads to attenuated interactions between the pesticide and the fluorophore, resulting in generally lower degrees of fluorescence enhancements.
Array-based detection
Overall, the observed fluorescence modulation responses are unique to each analyte-fluorophore-cyclodextrin combination, with the reported modulation providing a snapshot of the complicated interplay of intermolecular interactions between the three components. These unique responses generate well-separated signals for all of the pesticides investigated using linear discriminant analysis (LDA) methods (Fig. 5),23 with even a single cyclodextrin host providing sufficient differentiation for all target analytes. Interestingly, these responses are markedly different than the response pattern obtained using tetrahydrofuran 5 as a control, which confirms that the fluorescence modulation is due to pesticide-specific interactions and is not a result of the small amount of tetrahydrofuran used to dissolve the pesticide analyte prior to addition.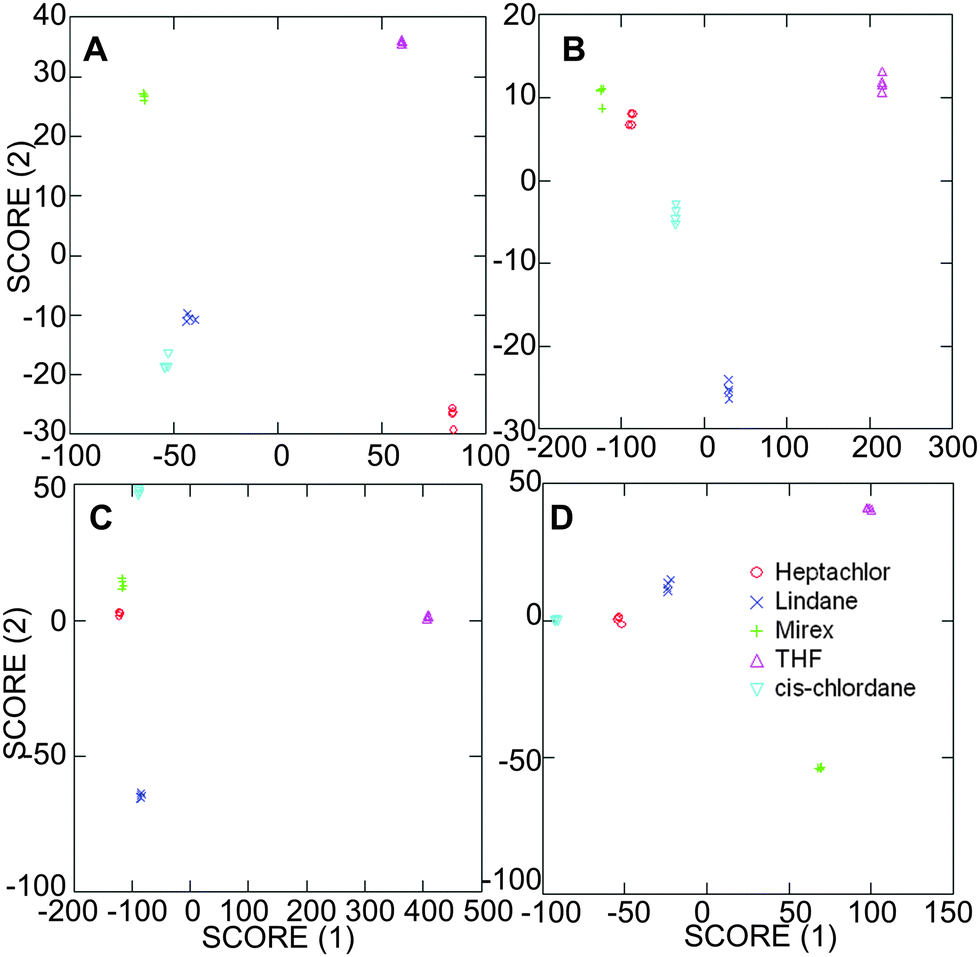 | ||
| Fig. 5 Selected array results with hosts: (A) α-CD; (B) β-CD; (C) Me-β-CD; and (D) PBS. | ||
Control experiments in the absence of any cyclodextrin (Fig. 5D) indicate well-separated signals for the analytes; however, the scale of the X-axis indicates a markedly lower degree of separation in PBS and in α-cyclodextrin compared to the results obtained in β-cyclodextrin and Me-β-cyclodextrin, which highlights stronger intermolecular interactions with the larger cyclodextrin systems compared to the results obtained with the smaller α-cyclodextrin or without a cyclodextrin host.
The limits of detection (LODs) and limits of quantification (LOQs) of cyclodextrin-promoted fluorescence modulation were assayed using literature-reported methods,5 and some select results are highlighted in Table 5. Detection limits as low as 5 μM were obtained. These results are slightly higher than literature reported values for other pesticide detection systems; however, the system reported herein has a number of notable operational advantages that make it attractive from a practical detection perspective.24 The negative calculated values occur because the limit of detection calculations use the assumption of a linear relationship between the fluorescence emission and the analyte concentration. Because the fluorescence emission in this case is a result of complicated intermolecular interactions between the analyte, fluorophore, and cyclodextrin, there are cases where that linear relationship does not hold.
| Analyte | In β-CD (μM) | In PBS (μM) |
|---|---|---|
| a Efforts to calculate limits of detection for these analyte–fluorophore–cyclodextrin combinations led to negative calculated values; current efforts are focused on understanding these phenomena. | ||
| 1 | 82 | |
| 2 | ||
| 3 | 31 | |
| 4 | 189 | 5 |
The practicality of this system would be markedly enhanced by its ability to detect a broader range of lipophilic compounds with high sensitivity. Aromatic organochlorine pesticides have already been detected by our group using cyclodextrin-promoted energy transfer to fluorophores 6–8,25 and a variety of aliphatic alcohols have been detected via cyclodextrin-promoted fluorescence modulation (Table 6).26 In general, the limits of detection for the alkanols are higher than those of the aliphatic organochlorine pesticides, highlighting a lower degree of sensitivity for these other analytes.
Conclusions
In summary, measurable changes in fluorescence emission spectra are seen upon addition of an aliphatic analyte to a high quantum yield fluorophore. The degree of intermolecular interactions between the two components strongly depends on the structures of each component, as well as on the supramolecular host. These changes, termed “fluorescence modulation,” enable the rapid, sensitive, and selective detection of analytes such as aliphatic organochlorine pesticides, with 100% success in identifying unique response patterns for each analyte-CD-fluorophore combination and low limits of detection. The use of this fluorescence modulation technique for aliphatic alcohol detection in complex mixtures represents a significant challenge in terms of selectivity and sensitivity, and current efforts in our laboratory are focused on addressing these challenges and optimizing detection in complex environments. Results of these and other investigations will be reported in due course.Acknowledgements
This research was funded by the National Science Foundation grant #1453483.References
- B. Sharma, P. Sharma and S. C. Joshi, World J. Pharm. Res., 2014, 3, 280 Search PubMed; D. Bhattacharjee and S. Das, J. Chem. Pharm. Res., 2013, 5, 90 Search PubMed; E. J. Mrema, F. M. Rubino, G. Brambilla, A. Moretto, A. M. Tsatsakis and C. Colosio, J. Toxicol., 2013, 307, 74 CrossRef CAS PubMed.
- C. Betianu and M. Gavrilescu, Environ. Eng. Manage. J., 2006, 5, 1011 Search PubMed; S. Alikhanidi and Y. Takahashi, J. Comput. Chem., Jpn., 2004, 3, 59 CrossRef CAS; K. Fenner, M. Scheringer and K. Hungerbuhler, Environ. Pollut., 2004, 128, 189 CrossRef PubMed.
- R. Zhao, in Food Chemical Hazard Detection, ed. S. Wang, 2014, p. 3 CAS; C. Corcellas, E. Eljarrat, D. Barcelo and D. Barcelo, Compr. Anal. Chem., 2013, 61, 203 CAS; J. W. Wong, D. G. Hayward, K. Zhang and D. Barcelo, Compr. Anal. Chem., 2013, 61, 3 Search PubMed.
- K. Mastovska and S. J. Lehotay, J. Chromatogr. A, 2003, 1000, 153 CrossRef CAS PubMed.
- B. Saute and R. Narayanan, J. Raman Spectrosc., 2013, 44, 1518 CrossRef CAS; B. Saute, R. Premasiri, L. Ziegler and R. Narayanan, Analyst, 2012, 137, 5082 RSC.
- Y. Guo, Z. Gong, Y. Cao, X. Wang and X. Sun, Sens. Transducers J., 2013, 156, 374 CAS.
- S. W. Thomas III, G. D. Joly and T. M. Swager, Chem. Rev., 2007, 107, 1339 CrossRef CAS PubMed; R. Parkesh, E. B. Veale, T. Gunnlaugsson, B. Wang and E. V. Anslyn, Chemosensors, 2011, 229 Search PubMed; L. Pu, Acc. Chem. Res., 2012, 45, 150 CrossRef PubMed.
- H. Peng, W. Chen, S. Burroughs and B. Wang, Curr. Org. Chem., 2013, 17, 641 CrossRef CAS.
- B.-H. Jun, H. Kang, Y.-S. Lee and D. H. Jeong, Molecules, 2012, 17, 2474 CrossRef CAS PubMed; W. Zhong, Anal. Bioanal. Chem., 2009, 394, 47 CrossRef PubMed.
- Z. Dai, Z. Wu, S. Jia and G. Wu, J. Chromatogr. B: Anal. Technol. Biomed. Life Sci., 2014, 964, 116 CrossRef CAS PubMed; D. Nardiello, S. Lo Magro, M. Iammarino, C. Palermo, M. Muscarella and D. Centonze, Curr. Anal. Chem., 2014, 10, 355 CrossRef.
- J. G. Weis and T. M. Swager, ACS Macro Lett., 2015, 4, 138 CrossRef CAS; S. Rochat and T. M. Swager, Angew. Chem., Int. Ed., 2014, 53, 9792 CrossRef PubMed; J. R. Cox, P. Muller and T. M. Swager, J. Am. Chem. Soc., 2011, 133, 12910 CrossRef PubMed.
- N. Serio, D. F. Moyano, V. M. Rotello and M. Levine, Chem. Commun., 2015, 51, 11615 RSC; N. Serio, L. Prignano, S. Peters and M. Levine, Polycyclic Aromat. Compd., 2014, 34, 561 CrossRef CAS PubMed; N. Serio, C. Chanthalyma, L. Prignano and M. Levine, Supramol. Chem., 2014, 26, 714 CrossRef PubMed; N. Serio, K. Miller and M. Levine, Chem. Commun., 2013, 49, 4821 RSC; T. Mako, P. Marks, N. Cook and M. Levine, Supramol. Chem., 2012, 24, 743 CrossRef.
- N. Serio and M. Levine, Mar. Pollut. Bull., 2015, 95, 242 CrossRef CAS PubMed; N. Serio, C. Chanthalyma, S. Peters, D. Levine and M. Levine, J. Inclusion Phenom. Macrocyclic Chem., 2015, 81, 341 CrossRef; N. Serio, C. Chanthalyma, L. Prignano and M. Levine, ACS Appl. Mater. Interfaces, 2013, 5, 11951 Search PubMed.
- B. Aswathy and G. Sony, J. Lumin., 2014, 154, 541 CrossRef CAS; A. P. Lazzo, C. T. Hoefer, L. Jicsinszky, E. Fenyvesi, L. Szente, J. Schiller, A. Herrmann and P. Mueller, Chem. Phys. Lipids, 2012, 165, 505 CrossRef PubMed.
- O. Guryev, B. Abrams, C. Lomas, Q. Nasraty, E. Park and T. Dubrovsky, Anal. Chem., 2011, 83, 7109 CrossRef CAS PubMed.
- A. Vyas, S. Saraf and S. Saraf, J. Inclusion Phenom. Macrocyclic Chem., 2008, 62, 23 CrossRef CAS.
- J. L. Shepherd, A. Kell, E. Chung, C. W. Sinclar, M. S. Workentin and D. Bizzotto, J. Am. Chem. Soc., 2004, 126, 8329 CrossRef CAS PubMed.
- A. Misra and M. Shahid, J. Phys. Chem. C, 2010, 114, 16726 CAS.
- H.-J. Schneider, Acc. Chem. Res., 2015, 48, 1815 CrossRef CAS PubMed; F. Biedermann, W. M. Nau and H.-J. Schneider, Angew. Chem., Int. Ed., 2014, 53, 11158 CrossRef PubMed; H.-J. Schneider, Acc. Chem. Res., 2013, 46, 1010 CrossRef PubMed.
- D. Philp and J. F. Stoddart, Angew. Chem., Int. Ed., 1996, 35, 1155 CrossRef CAS.
- C. Wang, L. Guan, D. Danovich, S. Shaik and Y. Mo, J. Comput. Chem., 2015 DOI:10.1002/jcc.23946.
- E. Cadoni, G. Ferino, P. Pitzanti, F. Secci, C. Fattuoni, F. Nicolo and G. Bruno, ChemistryOpen, 2015, 4, 161 CrossRef CAS PubMed; S. D'Agostino, F. Grepioni, D. Braga and B. Ventura, Cryst. Growth Des., 2015, 15, 2039 Search PubMed; N. K. Beyeh, A. Valkonen, S. Bhowmik, F. Pan and K. Rissanen, Org. Chem. Front., 2015, 2, 340 RSC.
- N. D. B. Le, M. Yazdani and V. M. Rotello, Nanomedicine, 2014, 9, 1487 CrossRef CAS PubMed; K. L. Diehl and E. V. Anslyn, Chem. Soc. Rev., 2013, 42, 8596 RSC; Y. Zhao, G. Markopoulos and T. M. Swager, J. Am. Chem. Soc., 2014, 136, 10683 CrossRef PubMed.
- Y. Ma, S. Xu, S. Wang and L. Wang, TrAC, Trends Anal. Chem., 2015, 67, 209 CrossRef CAS; N. Verma and A. Bhardwaj, Appl. Biochem. Biotechnol., 2015, 175, 309 Search PubMed; I. C. Yadav, N. L. Devi, J. H. Syed, Z. Cheng, J. Li, G. Zhang and K. C. Jones, Sci. Total Environ., 2015, 511, 123 CrossRef PubMed.
- N. Serio, J. Roque, A. Badwal and M. Levine, Analyst, 2015, 140, 7503 RSC.
- D. J. DiScenza and M. Levine, Supramol. Chem., 2015 Search PubMed , submitted.
Footnote |
| † Electronic supplementary information (ESI) available: Synthesis of fluorophore 6, experimental details for fluorescence modulation experiments, limit of detection experiments, and fluorescence array experiments, summary tables and figures for all experiments. See DOI: 10.1039/c5nj02357b |
| This journal is © The Royal Society of Chemistry and the Centre National de la Recherche Scientifique 2016 |