
The contribution of polar C–H hydrogen bonds to anion binding†
Yusun
Choi
,
Taehoon
Kim
,
Soonmin
Jang
* and
Jongmin
Kang
*
Department of Chemistry, Sejong University, Seoul, 143-747, South Korea. E-mail: kangjm@sejong.ac.kr
First published on 23rd November 2015
Abstract
The contribution of C–H hydrogen bonds is one of the key factors to consider in anion binding receptor design. To investigate the participation of C–H hydrogen bonds through C–H polarization in an anion binding event, we have designed and synthesized three new anion receptors (receptors 1, 2 and 3). Essentially, the only difference between these receptors is the relative magnitude of the C–H(Ha) polarization. These receptors utilize two amide N–H, two aromatic C–H(Ha), anthracene 9-C–H and possibly two methyl groups as hydrogen bonding moieties. From the titrations and DFT calculations, we found that the anion binding abilities of these receptors mainly depend on the magnitude of the polarization of C–H(Ha) and receptors 1 and 2 are selective for H2PO4−.
Introduction
The design and synthesis of efficient receptors capable of binding biologically and environmentally important anionic species is an emerging field in supramolecular chemistry.1–5Hydrogen bonds are important anion recognition elements due to their directionality. As anions display a wide range of geometries, the directionality of hydrogen bonds is frequently utilized to achieve complementarity between anions and receptors. While most hydrogen bonding anion receptors utilize a N–H⋯anion or an O–H⋯anion hydrogen bond, only a few examples are reported about receptors utilizing C–H⋯anion hydrogen bonds6–13 even though C–H⋯anion hydrogen bonds play an important role in nature.14–20 Although there have been many examples which show that C–H hydrogen bonds contribute to anion binding events, there appears to be a general consensus among supramolecular chemists that C–H hydrogen bonds are much weaker than the traditional O–H and N–H donors.
However, when attached to polarizing substituents, C–H groups act as moderate-to-strong hydrogen bond donors, exhibiting interaction energies comparable to those obtained from O–H and N–H groups.21–32
To investigate the participation of C–H hydrogen bonds through C–H polarization in an anion binding event, we have designed and synthesized new anion receptors 1, 2 and 3 as shown below.
These receptors utilize two amide N–H, two aromatic C–H(Ha) and anthracene 9-C–H as hydrogen bonding moieties. From our experiments, we found that the binding abilities of these receptors depend on the magnitude of polarization of C–Ha. Here we report the synthesis and binding properties of these receptors.
Experimental section
Materials
Tetra-n-butylammonium hydroxide, tetra-n-butylammonium fluoride, tetra-n-butylammonium dihydrogen phosphate, tetra-n-butylammonium acetate (TBAA), tetra-n-butylammonium bromide, tetra-n-butylammonium chloride (TBACl), tetra-n-butylammonium hydrogen sulphate were purchased from Sigma-Aldrich Chemical Co., Inc., and used as received.Measurements
Absorption spectra were recorded using a biochrom Libra S70 spectrophotometer (Biochrom Ltd, England). NMR spectra were recorded using a BRUKER spectrometer operated at 500 MHz. ESI MS spectra were obtained using a JMS 700 (Jeol, Japan) double focusing magnetic sector mass spectrometer. All measurements were carried out at room temperature (298 K).Synthesis
For the synthesis of receptor 1, nicotinic acid and oxalyl chloride were reacted to give nicotinoyl chloride 4 in quantitative yield. The reaction between nicotinoyl chloride and anthracene-1,8-diamine33 in the presence of diisopropylethylamine gave N,N′-(anthracene-1,8-diyl)dinicotinamide 5 in 20% yield. Then compound 5 was reacted with 14 equivalents of methyl iodide at 70 °C. Anion exchange with ammonium hexafluorophosphate gave receptor 1 in 72% yield. Receptors 2 and 3 were synthesized by the reaction between anthracene-1,8-diamine and 3-nitrobenzoyl chloride (or benzoyl chloride). All compounds were characterized by 1H NMR, 13C NMR, and high-resolution mass spectrometry (Scheme 1). | ||
| Scheme 1 Synthetic procedure for anion receptors 1, 2 and 3. | ||
Compound 4
A suspension of 150 mg (1.22 mmol) of nicotinic acid in 1 mL of oxalyl chloride was stirred for 30 min at room temperature. After evaporation of oxalyl chloride in vacuo, compound 4 was obtained in quantitative yields and used for the next reaction without any purification. 1H NMR (CDCl3, 500 MHz) δ 9.45(s, 1H), 9.06(d, 1H, J = 4.5 Hz), 8.91(d, 1H, J = 8 Hz), 8.05(t, 1H, J = 5.5 Hz).Compound 5
To a solution of anthracene-1,8-diamine (127 mg, 0.61 mmol) in dichloromethane (7 mL), nicotinoyl chloride (173 mg, 1.22 mmol) and diisopropylethylamine (212 μl, 1.22 mmol) were added and stirred for 1 hour at room temperature. The precipitate was collected by filtration, washed with methanol and dried in a vacuum to give a dark brown solid (52 mg) in 20% yield. mp 264–268 °C 1H NMR (DMSO-d6, 500 MHz) 10.80(s, 2H), 9.21(s, 2H), 8.91(s, 1H), 8.78(d, H, J = 4.5 Hz), 8.74(s, 1H), 8.36(d, 2H, J = 7.5 Hz), 8.08(d, 2H, J = 8.5 Hz), 7.75(d, 2H, J = 7 Hz), 7.66(t, 2H, J = 7.5 Hz), 7.48(m, 2H), 13C NMR (DMSO-d6, 125 MHz) δ 162.83, 146.25, 143.93, 142.39, 133.14, 132.45, 131.84, 126.95, 126.51, 126.33, 126.05, 125.58, 122.31, 118.18 HRMS(EI) m/z calcd for C26H18N4O2: 418.1430. Found: 418.1427.Receptor 1
To a solution of N,N′-(anthracene-1,8-diyl)dinicotinamide 5 (35 mg, 0.084 mmol) in DMF (3 mL), methyl iodide (73 μl, 1.18 mmol) was added and stirred for 1 hour at 70 °C. After the reaction mixture was cooled to room temperature, 10 mL of water was added. Then, 5 mL of 1 M NH4PF6 solution was added to give a dark brown precipitate. The precipitate was collected by filtration, washed with water and dried in a vacuum to give a dark brown solid (44.7 mg) in 72% yield. mp > 300 °C 1H NMR (DMSO-d6, 500 MHz) δ 11.12(s, 2H), 9.60(s, 2H), 9.15(m, 4H), 8.95(s, 1H), 8.81(s, 1H), 8.26(t, 2H, J = 6.5 Hz), 8.15(d, 2H, J = 8.5 Hz), 7.87(d, 2H, J = 7 Hz), 7.67(t, 2H, J = 7.5 Hz), 5.51(s, 6H) 13C NMR (DMSO-d6, 125 MHz) δ 161.48, 147.42, 146.11, 143.17, 133.86, 132.44, 131.83, 127.53, 127.16, 127.03, 126.38, 125.58, 122.77, 117.08, 48.27 HRMS (FAB), m/z calcd for C28H24F12O2P2: 738.1183. Found: 738.1177.Receptor 2
To a solution of anthracene-1,8-diamine (70 mg, 0.34 mmol) in dichloromethane (16 mL), 3-nitrobenzoyl chloride (125 mg, 0.68 mmol) and pyridine (127 μl, 1.58 mmol) were added and stirred for 15 min. The precipitate was collected by filtration, washed with methanol and dried in a vacuum to give a light brown solid (110 mg) in 65% yield. mp > 300 °C 1H NMR (DMSO-d6, 500 MHz) δ 10.92(s, 2H), 8.76(m, 3H), 8.71(s, 1H), 8.35(m, 4H), 8.11(d, 2H, J = 7 Hz), 7.62(m, 6H) 13C NMR(DMSO-d6, 125 MHz) δ 164.01, 147.51, 135.56, 133.88, 133.61, 131.85, 129.89, 129.89, 127.34, 126.98, 126.03, 125.46, 123.66, 122.21, 118.075 HRMS (FAB), m/z calcd for C28H18N4O6–H+: 505.1146. Found: 505.1142.Receptor 3
To a solution of anthracene-1,8-diamine (60 mg, 0.29 mmol) in dichloromethane (9 mL), benzoyl chloride (80 mg, 0.57 mmol) and pyridine (109 μl, 1.35 mmol) were added and stirred for 30 min. The precipitate was collected by filtration, washed with methanol and dried in a vacuum to give a black solid receptor 3 (70 mg) in 59% yield. mp 274–276 °C 1H NMR (DMSO-d6, 500 MHz) δ 10.59(s, 2H), 8.92(s, 1H), 8.71(s, 1H), 8.04(m, 6H), 7.70(d, 2H, J = 6.5 Hz), 7.59(q, 4H, J = 6.5 Hz), 7.42(m, 4H) HRMS (FAB), m/z calcd for C28H19N2O2–H+: 415.1445. Found: 415.1441.Results and discussion
Interactions with dihydrogen phosphate
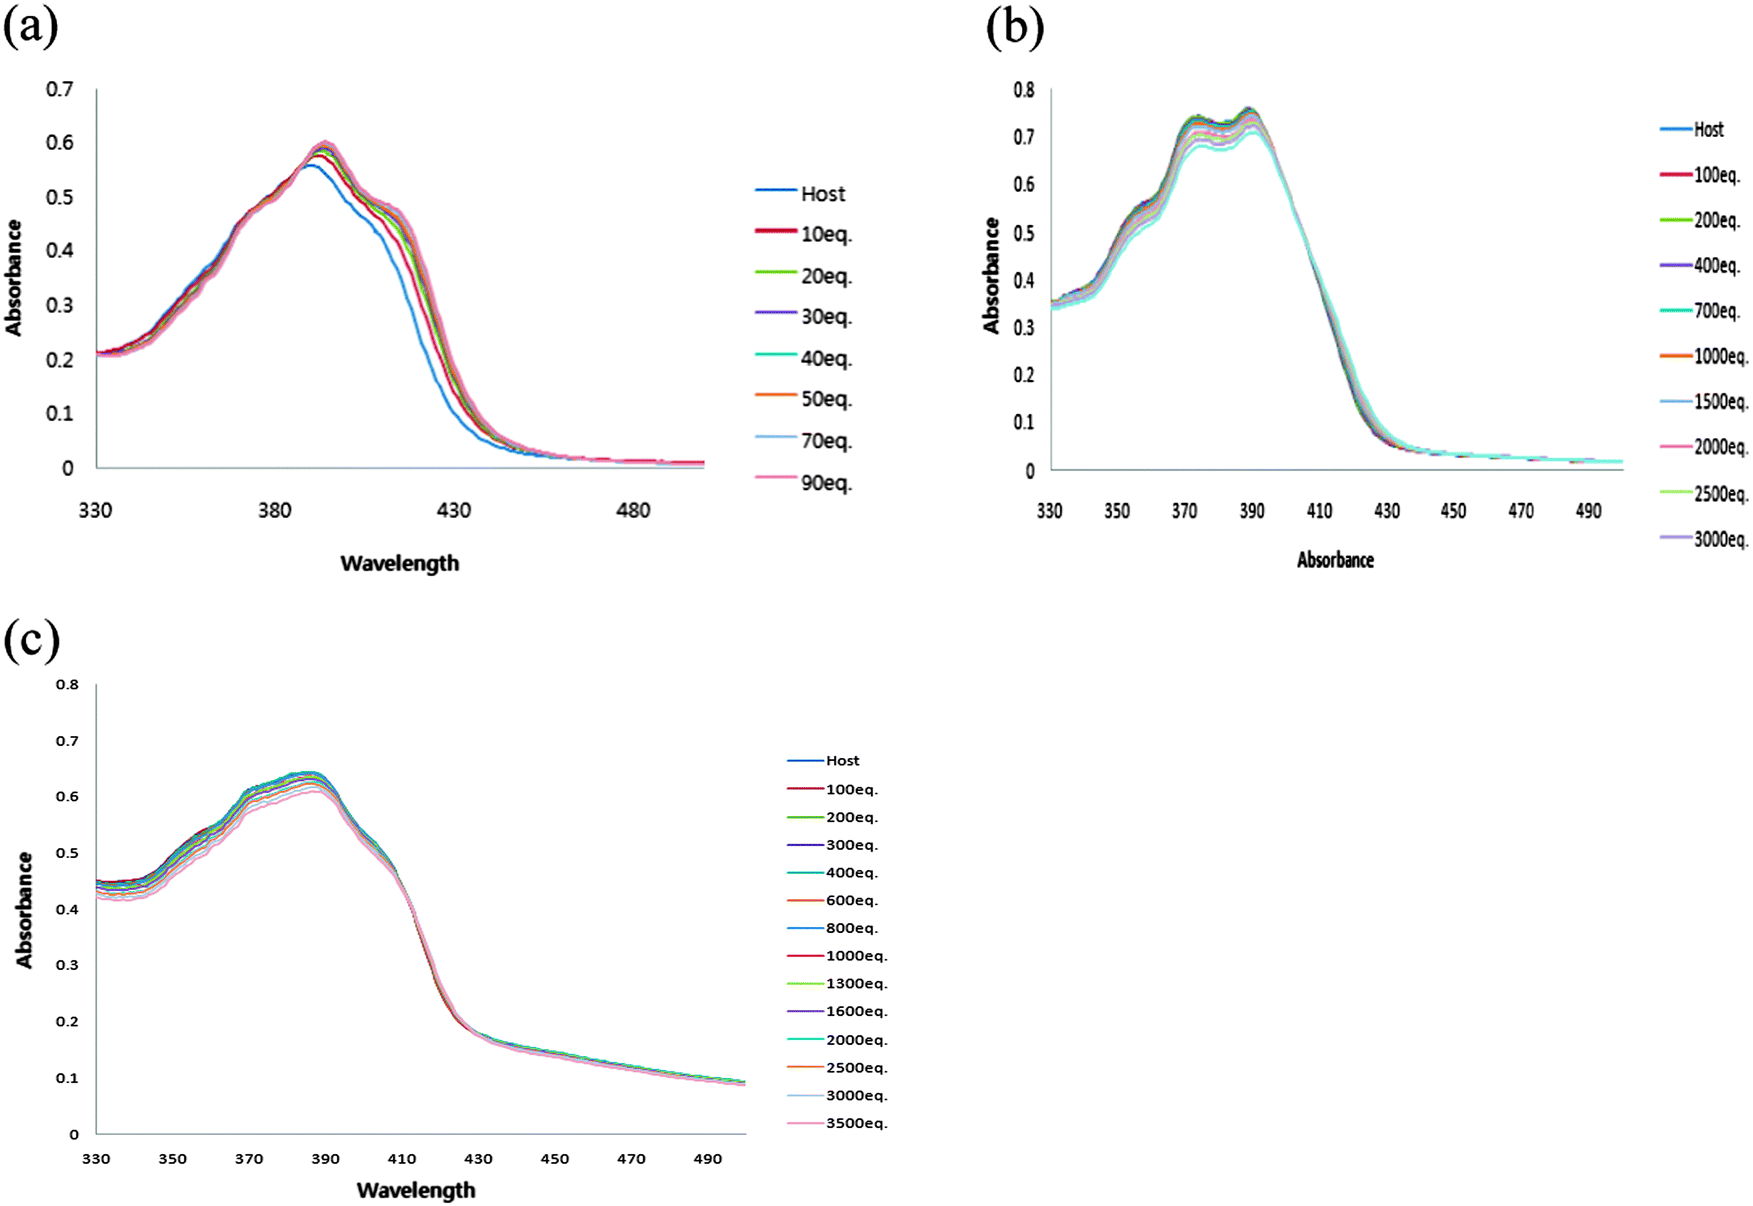
The ability of receptor 1 to recognize dihydrogen phosphate was studied first in DMSO using UV-vis titration spectra. Receptor 1 displayed absorption bands at 390 nm. Upon addition of increasing amounts of H2PO4−, moderate increases in absorption at 455 nm and an isosbestic point was observed at 386 nm, suggesting the formation of a typical hydrogen bonding complex between receptor 1 and dihydrogen phosphate (Fig. 1a).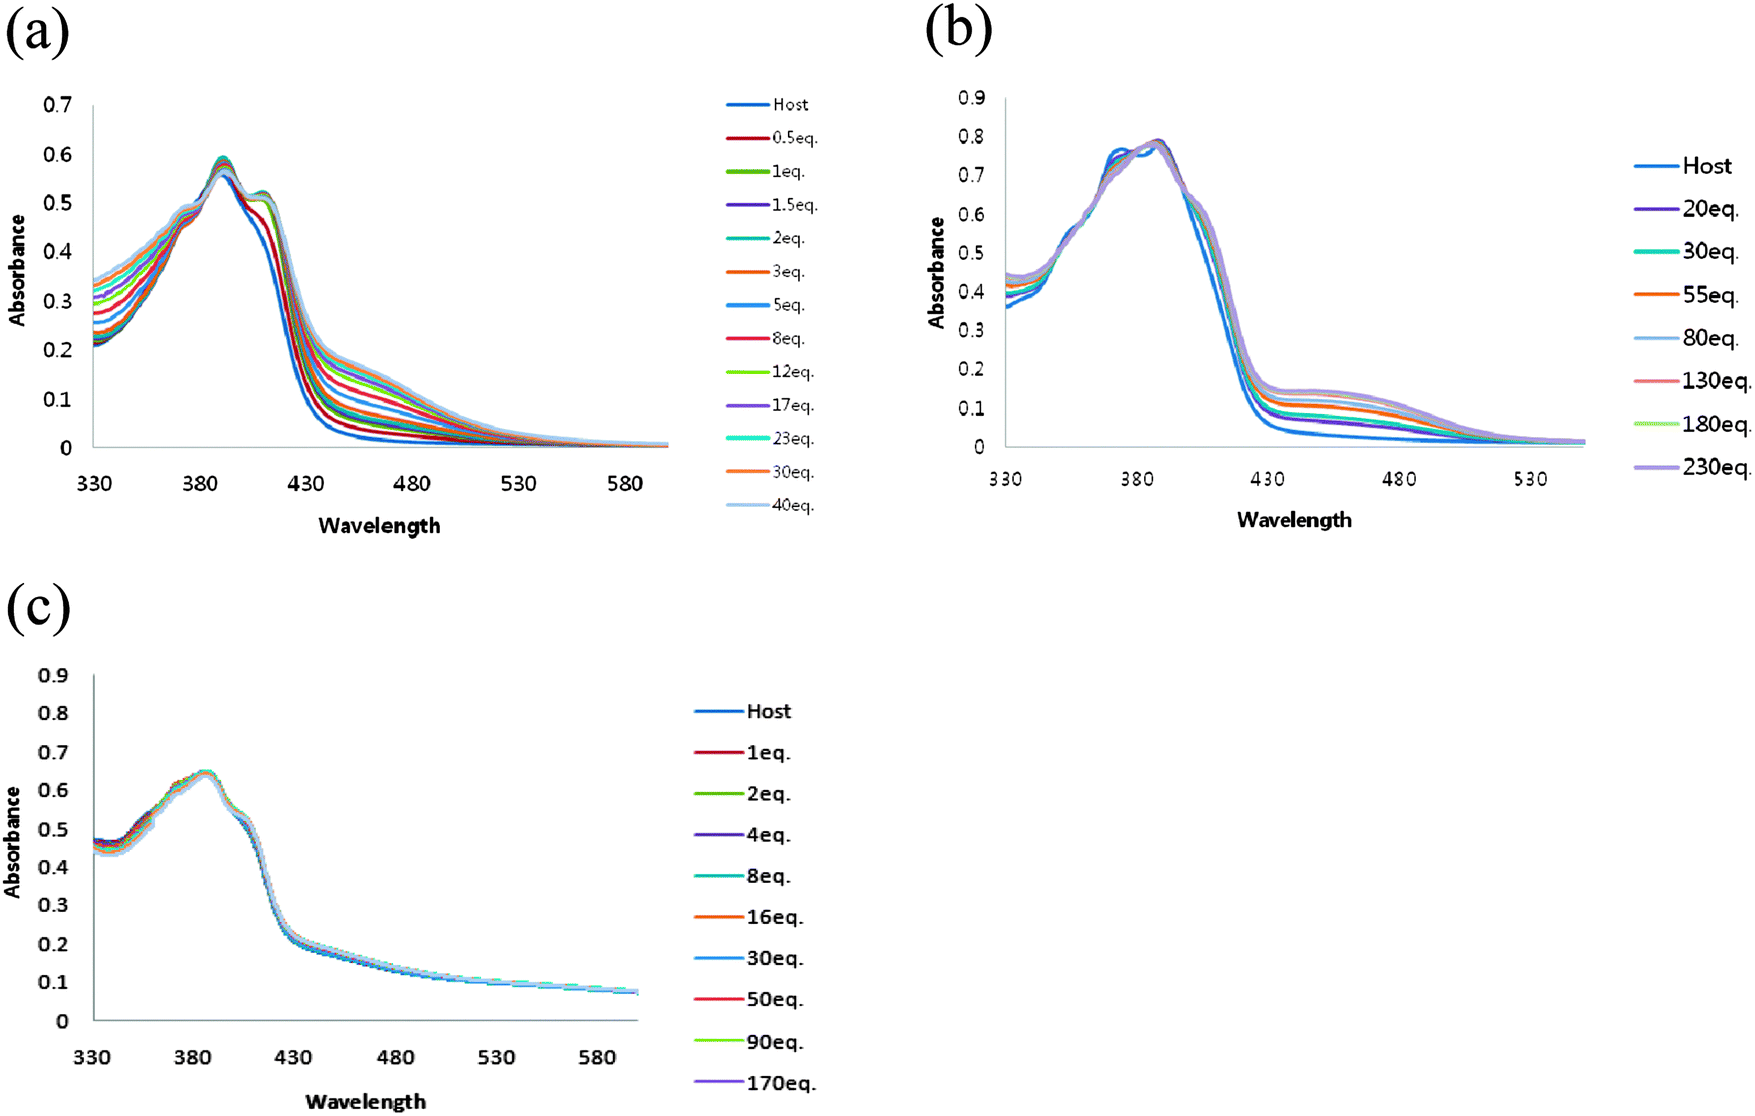 | ||
| Fig. 1 UV-vis spectra recorded over the course of titration of 100 μM DMSO solution of receptors 1(a), 2(b) and 3(c) with the standard solution tetrabutylammonium dihydrogen phosphate. | ||
In order to discriminate hydrogen bonding interaction from deprotonation, UV-vis titration of receptor 1 with tetrabutylammonium hydroxide was carried out (Fig. 2a). The changes in the absorbance spectra with hydroxide were clearly different from those with dihydrogen phosphate. Furthermore, isosbestic points observed at 406 nm and 370 nm were different from those observed with dihydrogen phosphate. In addition, the UV-vis spectral changes of the receptors upon addition of excessive fluoride or acetate were nearly identical to those triggered by hydroxide (Fig. 2b and c).
 | ||
| Fig. 2 UV-vis spectra recorded over the course of titration of 100 μM DMSO solution of the receptor 1 with the standard solutions tetrabutylammonium hydroxide (a), tetrabutylammonium fluoride (b) and tetrabutylammonium acetate (c). | ||
Receptor 1 showed a strong fluorescence emission spectrum in DMSO as expected. The excitation wavelength was 381 nm and the emission wavelength was 442 nm. The intensity of the emission spectrum from 20 μM solution of receptor 1 gradually increased as the concentration of tetrabutylammonium dihydrogen phosphate salts was increased (1–35 equiv.), which also indicate the association between receptor 1 and dihydrogen phosphate (Fig. 3).
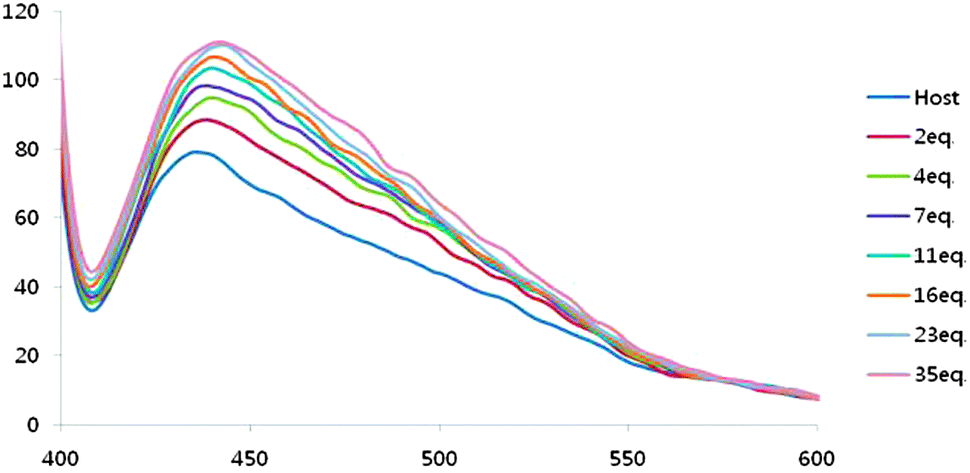 | ||
| Fig. 3 The change in fluorescence spectra over the course of titration of 20 μM DMSO solutions of receptor 1 when tetrabutylammonium dihydrogen phosphate was added. The change in the fluorescence of the intensity was measured at 442 nm. | ||
The stoichiometry between receptor 1 and dihydrogen phosphate was determined to be 1![[thin space (1/6-em)]](https://www.rsc.org/images/entities/char_2009.gif) :1 using a UV-vis Job plot in DMSO (Fig. 4).
:1 using a UV-vis Job plot in DMSO (Fig. 4).
 | ||
| Fig. 4 Job plots of receptor 1 with tetrabutylammonium dihydrogen phosphate and tetrabutylammonium chloride obtained by UV-vis spectrum in DMSO. | ||
The complexation abilities of receptor 1 to dihydrogen phosphate were also measured by standard 1H NMR titration experiments in DMSO-d6 using a constant host concentration (2 mM) and increasing concentrations of dihydrogen phosphate. The addition of tetrabutylammonium dihydrogen phosphate salts to the solution of receptor 1 in DMSO-d6 resulted in a downfield shift of C–Ha and anthracene 9-C–H peaks. For example, the C–Ha peak moved from 9.602 ppm to 9.925 ppm and anthracene 9-C–H moved from 8.952 ppm to 9.473 ppm. However, no downfield shift of the amide N–H peak was observed due to severe line broadening (Fig. 5). This result indicates that the added dihydrogen phosphate is complexed by receptor 1 through amide N–H, C–Ha and anthracene 9-C–H. In addition, all peaks from anthracene showed an upfield shift except for the 9-C–H peak. In fact, two effects are expected as a result of hydrogen bond formation between receptor 1 and the anion. (i) A through-bond propagation increases the electron density in the anthracene ring, which causes a shielding effect and promotes an upfield shift; (ii) a through-space effect increases the polarization of C–H bonds, which causes deshielding and promotes a downfield shift. In this case, the through-bond propagation dominates, and an upfield shift is observed for all hydrogen peaks from anthracene.
 | ||
| Fig. 5 1H NMR spectra of 2 mM of receptor 1 containing increasing amounts of tetrabutylammonium dihydrogen phosphate (0–2.3 equiv.) in DMSO-d6. | ||
A Benesi–Hildebrand plot34 drawn by plotting the change at 455 nm in the UV-vis spectrum and the change at 442 nm in the fluorescence spectrum gave the association constant for dihydrogen phosphate. The calculated association constants for dihydrogen phosphate were found to be 1.5 × 10³ and 1.6 × 10³ from the UV-vis spectrum and the fluorescence spectrum, respectively. In addition, the chemical shifts of these hydrogens were analyzed by EQN MR35 and the association constant calculated from 1H NMR titration was found to be 1.3 × 10³, which is similar to the values obtained from UV-vis and fluorescence titrations.
In the case of receptor 2, absorption bands appeared at 374 and 388 nm in DMSO. Upon addition of increasing amounts of H2PO4−, the formation of a hydrogen bonding complex was also observed. A new λmax was observed at 447 nm and the isosbestic point was observed at 399 nm (Fig. 1b).
Receptor 2 also showed the hydrogen bond formation through 1H NMR titration. Until 8 equivalents of dihydrogen phosphate were added, the amide N–H peak moved from 10.9 to 12.2 ppm although line broadening was observed (Fig. 6). In addition, downfield shifts of the C–Ha peak (at the para position to the NO2 group) and anthracene 9-C–H were observed. For example, the C–Ha peak moved from 8.35 ppm to 8.87 ppm and anthracene 9-C–H moved from 8.69 ppm to 9.06 ppm. This result indicates that these hydrogens are major hydrogens involved in hydrogen bonding with anions during titration and added dihydrogen phosphate is complexed by receptor 2 through amide N–H, C–Ha and anthracene 9-C–H. The calculated association constants between receptor 2 and dihydrogen phosphate were found to be 2.1 × 10² from UV-vis titration and 2.2 × 10² from 1H NMR.
 | ||
| Fig. 6 1H NMR spectra of 2 mM of receptor 2 containing increasing amounts of tetrabutylammonium dihydrogen phosphate (0–13.4 equiv.) in DMSO-d6. | ||
No change in the spectrum was observed with receptor 3 (Fig. 1c). Most probably the two amide N–H hydrogen bonds and the polarization of anthracene 9-H and C–Ha are not strong enough to make a complex with dihydrogen phosphate, which indicates the importance of polarization of C–Ha in receptors 1 and 2.
Interactions with halides
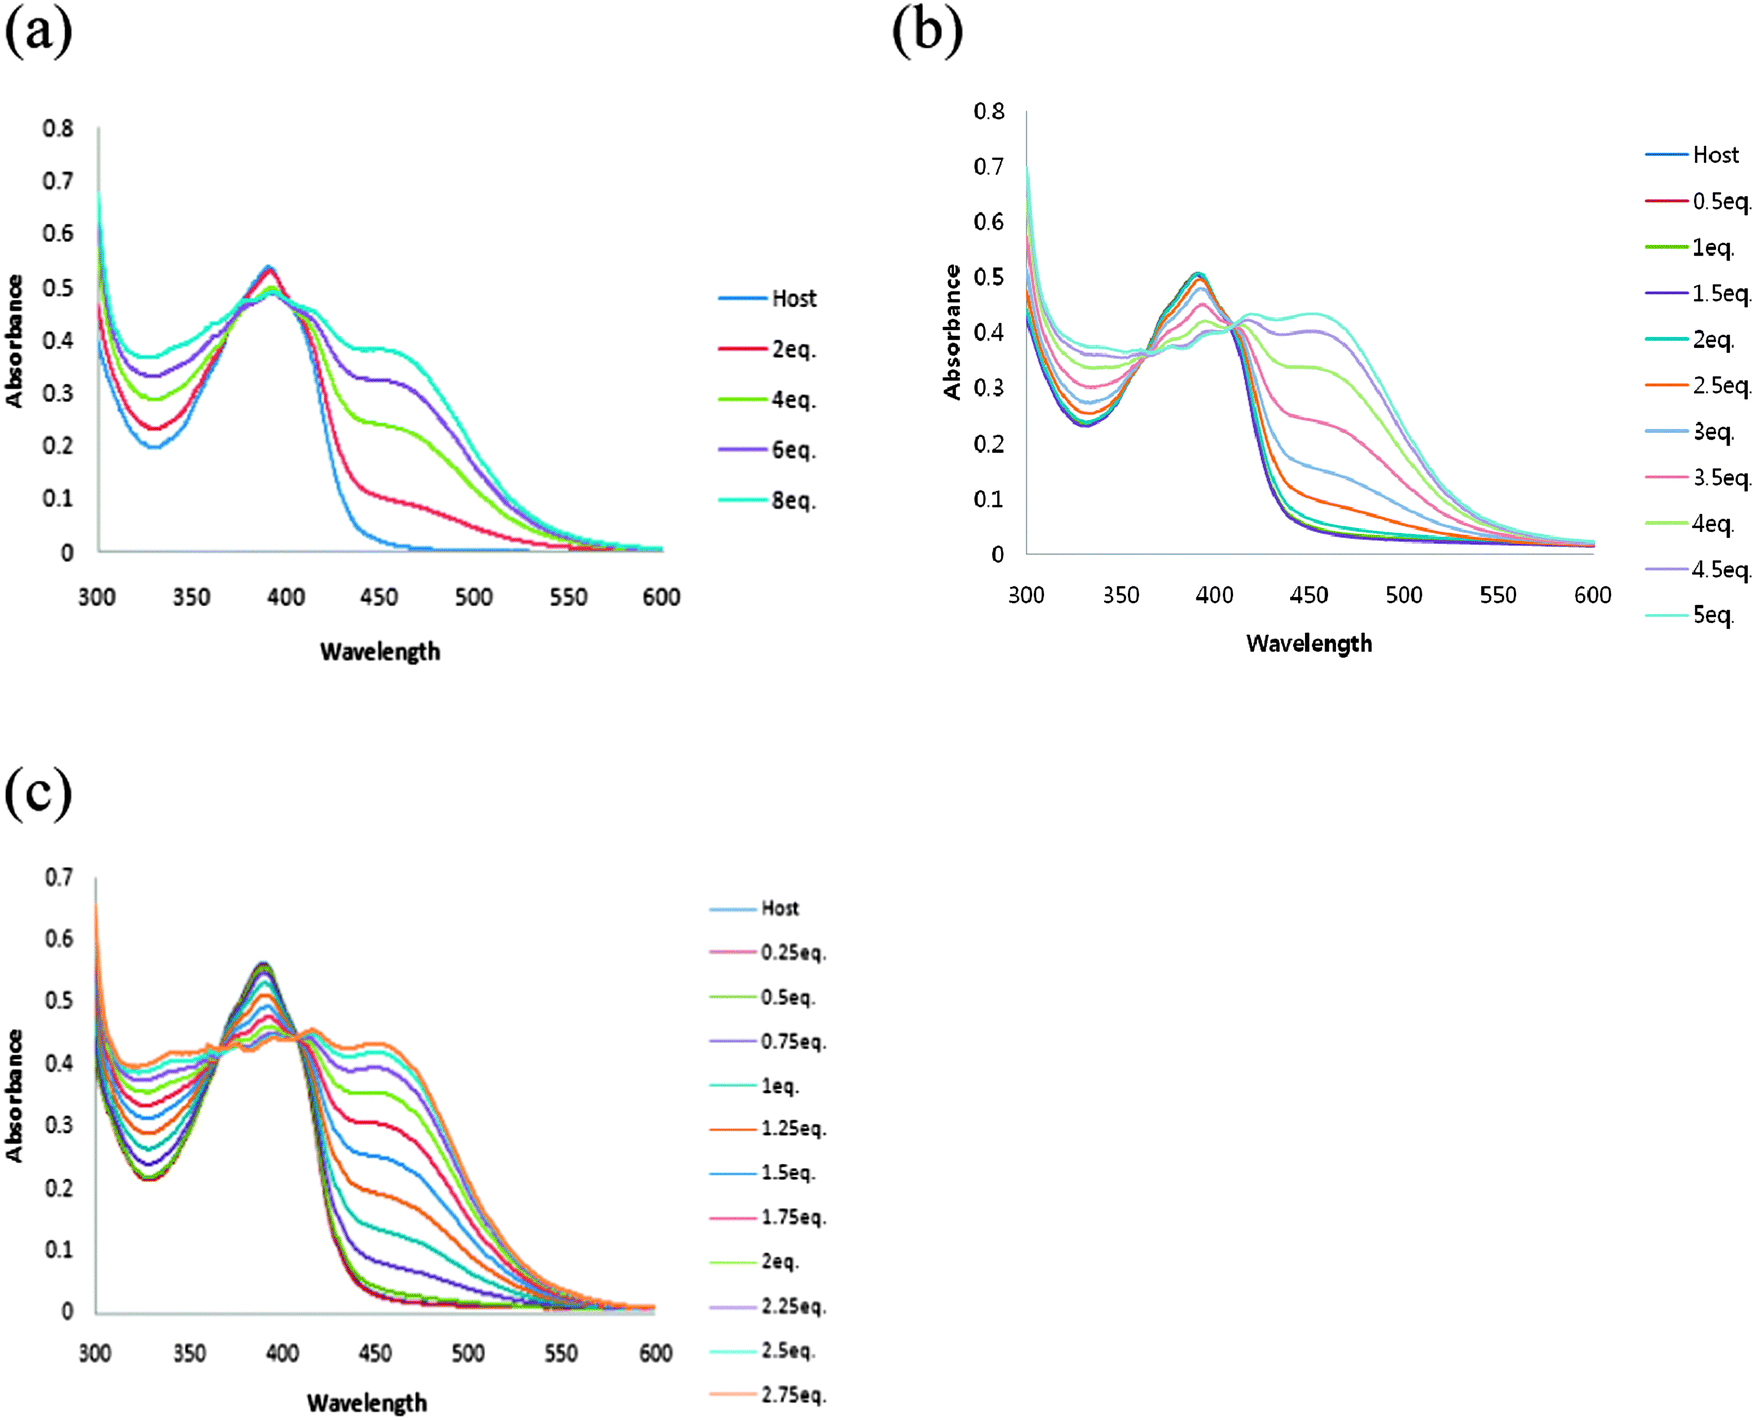
The abilities of receptor 1 to recognize halides were also studied in DMSO using UV-vis titration spectra. When the amount of chloride was increased, moderate decreases in absorbance below the isosbestic point and moderate increases in absorbance above the isosbestic point were observed (Fig. 7a). The isosbestic point was observed at 387 nm, suggesting the formation of a typical hydrogen bonding complex between receptor 1 and the chloride anion. The existence of isosbestic point for UV-vis titrations of receptor 1 with the chloride anion suggests a 1:1 complexation, and this was also confirmed by Job's plot analysis (Fig. 4).
 | ||
| Fig. 7 UV-vis spectra recorded over the course of titration of 100 μM DMSO solution of the receptor 1(a), 2(b) and 3(c) with the standard solution tetrabutylammonium chloride. | ||
However, no changes in spectra due to the chloride anion were observed with receptors 2 and 3. (Fig. 7b and c), which also indicate the importance of polarization of C–Ha in these receptors.
The formation of the hydrogen bond between receptor 1 and the chloride anion was clearly observed by 1H NMR titration. Until 45 equivalents of the chloride anion were added, the amide N–H peak moved from 11.12 to 11.54 ppm. In addition, a downfield shift of the C–Ha peak and anthracene 9-C–H was observed. For example, the C–Ha peak moved from 9.60 ppm to 9.93 ppm and anthracene 9 C–H moved from 8.95 ppm to 9.54 ppm. The association constant calculated for the chloride anion was found to be 7.1 × 10². The bromide anion exhibited similar behavior to the chloride anion in UV-vis titration and in 1H NMR titration (see the ESI†). The calculated binding constants for other anions are summarized in Table 1.
| Anion | 1 | 2 | ||
|---|---|---|---|---|
| UV | NMR | UV | NMR | |
| H2PO4− | 1.5 × 10³ | 1.3 × 10³ | 2.1 × 10² | 2.2 × 10² |
| Cl− | 7.3 × 10² | 7.1 × 10² | nb | nb |
| Br− | 1.6 × 10² | 1.6 × 10² | nb | nb |
| HSO4− | 7.0 × 10 | 3.5 × 10 | nb | nb |
Modeling studies
To account for the binding affinity of the anions, we have carried out a series of DFT electronic structure calculation of each receptor, two anions, i.e. H2PO4− and Cl−, and their complexes. We prepared the initial geometry of each compound with Spartan'1036 and performed a systematic conformational search by DFT calculation by changing the dihedral angles of the receptors with the Gaussian09 package.37 In this stage, we also included three low energy conformers obtained from simulated annealing, using a molecular mechanics forcefield (MMFF) as implemented in Spartan'10, followed by DFT optimization calculation. As for the complex, we placed the anions on the DFT optimized receptors and performed separate DFT optimization by changing the location/orientation of the anion relative to the receptor. All DFT calculations were done at the B3LYP/6-311+G(d,p) level under the polarizable continuum model (PCM) using DMSO as a solvent as implemented in the Gaussian09 package. Basically, the receptors do not have a significant amount of structural flexibility due to the highly conjugated nature with the exception of several dihedral angles. Therefore, we believe that the current scheme is more than enough for searching the lowest energy conformer in this study. During DFT calculations, we have not imposed any conditions on symmetry. The binding energies of each receptor with H2PO4− and Cl− anions are obtained from the DFT energy difference between the complex and the receptor + anion. For all six cases, three receptors in combination with two anions, the complex energy is lower than the combined energy of the receptor and the anion alone. The final structures of receptor 1 in complex with anions are shown in Fig. 8. The complex structures of the other two receptors are essentially the same and are therefore not shown here. All figures are drawn using Pymol.38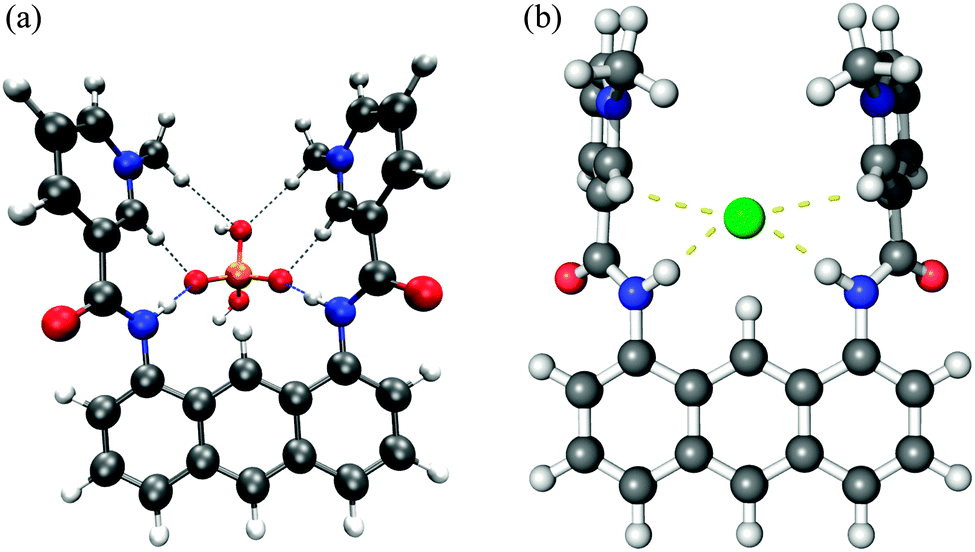 | ||
| Fig. 8 Receptor 1 in a complex with H2PO4− (a) and Cl− (b). | ||
One can immediately notice that the H2PO4− anions are making a complex with the receptors by hydrogen bonds between two non-hydrogen connected oxygen atoms on H2PO4− and amide hydrogens and aromatic hydrogens (C–Ha) on the receptor.
The binding energies, obtained from the energy difference as stated above, of each receptor with both anions are given in Table 2.
| Receptor 1 | Receptor 2 | Receptor 3 | |
|---|---|---|---|
| H2PO4− | −29.45 | −18.48 | −16.63 |
| Cl− | −12.13 | −5.10 | −3.17 |
The binding energy table shows that receptor 1 is one of the most capable receptors for both H2PO4− and Cl− anions among the three receptors, and receptors 2 and 3 have a similar binding affinity. For all receptors the binding affinity with the H2PO4− anion is higher than that with the Cl− anion. All these results are in agreement with experiment at least qualitatively.
We are particularly interested in the partial charges on the C–Ha hydrogen and the hydrogen on the amide N–H. The partial charges of these hydrogens, before and after complex formation, obtained from Mulliken population analysis are given in Table 3.
| Receptor 1 | Receptor 2 | Receptor 3 | |||||||
|---|---|---|---|---|---|---|---|---|---|
| No anion | H2PO4− | Cl− | No anion | H2PO4− | Cl− | No anion | H2PO4− | Cl− | |
| C–Hα | 0.189 | 0.213 (0.218) | 0.199 | 0.138 | 0.168 | 0.148 | 0.116 | 0.136 (0.150) | 0.136 |
| N–H | 0.263 | 0.328 (0.321) | 0.281 | 0.256 | 0.316 (0.314) | 0.269 | 0.253 | 0.317 | 0.270 |
We also provided the bond distances involved in hydrogen bonds in Table 4.
| Receptor 1 | Receptor 2 | Receptor 3 | ||||
|---|---|---|---|---|---|---|
| H2PO4− | Cl− | H2PO4− | Cl− | H2PO4− | Cl− | |
| C–Ha | 1.9785 (1.9593) | 2.7466 | 2.1016 (2.1013) | 2.5922 (2.5916) | 2.1981 (2.1901) | 2.6816 |
| N–H | 1.7689 (1.7870) | 2.4441 | 1.8030 (1.7971) | 2.6038 (2.6044) | 1.8118 (1.8163) | 2.6332 |
Consistent with the binding energy trend, receptor 1 has the shortest hydrogen bond distances between the receptor and the anion while the distances are comparable between receptors 2 and 3. Both from the charge table and the hydrogen bond distance table, it is clear that both hydrogens on C–Ha and amide N–H of receptor 1 have a highly positive charge compared to the two other receptors, indicating that compound 1 is the more efficient anion receptor, supporting our experimental results. Based on these calculations, the enhanced anion binding affinity of receptor 1 is attributed not only to the hydrogen partial charge on C–Ha, but also the increased positive charge on the amide hydrogens. We also noted that there are very weak charge–charge interactions between the hydrogen atoms on the methyl group and one of the hydrogen bound oxygen atoms in the H2PO4− anion for receptor 1. Their distance is about 2.5 Å and this might have played an extra role in the complex of receptor 1 with the H2PO4− anion.
Conclusion
The contribution of C–H hydrogen bonds through C–H polarization was demonstrated through three new anion receptors 1, 2 and 3. These receptors utilize two amide N–H, two aromatic C–H(Ha), anthracene 9-C–H and possibly two methyl groups as hydrogen bonding moieties and only the relative magnitude of C–H(Ha) polarization makes differences in the anion binding events among these receptors. From the titration and DFT calculation, we found that the binding abilities of these receptors mainly depend on the magnitude of polarization, or charge separation of C–H(Ha) and receptors 1 and 2 are selective for H2PO4−.Acknowledgements
This research was supported by the Basic Science Research Program of the Korean National Research Foundation funded by the Korean Ministry of Education, Science and Technology (2010-0021333). SJ acknowledges financial support from the Korean National Research Foundation (2012R1A1A2009242).References
- P. de Hoog, P. Gamez, I. Mutikainen, U. Turpeinen and J. Reedijik, Angew. Chem., 2004, 116, 5939–5941 CrossRef.
- J. L. Sessler and D. Seidel, Angew. Chem., 2003, 115, 5292–5333 CrossRef.
- P. D. Beer and P. A. Gale, Angew. Chem., 2001, 113, 502–532 CrossRef.
- J. Y. Kwon, N. J. Singh, H. N. Kim, S. K. Kim, K. S. Kim and J. Yoon, J. Am. Chem. Soc., 2004, 126, 8892–8893 CrossRef CAS PubMed.
- F. P. Schmidtchen and M. Berger, Chem. Rev., 1997, 97, 1609–1646 CrossRef CAS PubMed.
- D.-W. Yoon and H. C.-H. Lee, Angew. Chem., Int. Ed., 2002, 41, 1757–1759 CrossRef CAS.
- W. S. Jonathan, Chem. Commun., 2006, 2637–2649 Search PubMed.
- K. Ghosh and G. Masanta, Tetrahedron Lett., 2008, 49, 2592–2597 CrossRef CAS.
- H. F. Maria, D. Terry, D. Humphries, R. T. David, K. Ritu, K. Jaanus and W. S. Jonathan, Chem. Commun., 2006, 156–158 Search PubMed.
- J. Cai and J. L. Sessler, Chem. Soc. Rev., 2014, 43, 6198–6213 RSC.
- N. H. Evans and P. D. Beer, Angew. Chem., Int. Ed., 2014, 53, 11716–11754 CrossRef CAS PubMed.
- L. M. Hancock, E. Marchi, P. Ceroni and P. D. Beer, Chem. – Eur. J., 2012, 18, 11277–11283 CrossRef CAS PubMed.
- N. G. White and P. D. Beer, Chem. Commun., 2012, 48, 8499–8501 RSC.
- S. Metzger and B. Lippert, J. Am. Chem. Soc., 1996, 118, 12467–12468 CrossRef CAS.
- P. Auffinger, S. Louise-May and E. Westof, J. Am. Chem. Soc., 1996, 118, 1181–1189 CrossRef CAS.
- G. R. Desiraju, Acc. Chem. Res., 1991, 24, 290–296 CrossRef CAS.
- T. Steiner and W. Saenger, J. Am. Chem. Soc., 1992, 114, 10146–10154 CrossRef CAS.
- C. V. K. Sharma and G. R. Desiraju, J. Chem. Soc., Perkin Trans. 2, 1994, 2345–2352 RSC.
- T. Steiner, J. Chem. Soc., Perkin Trans. 2, 1995, 1315–1319 RSC.
- J. D. Chaney, C. R. Goss, K. Folting, B. D. Santarsiero and M. D. Hollingworth, J. Am. Chem. Soc., 1996, 118, 9432–9433 CrossRef CAS.
- S. In, S. J. Cho, K. H. Lee and J. Kang, Org. Lett., 2005, 7, 3993–3996 CrossRef CAS PubMed.
- S. K. Kim, N. J. Singh, S. J. Kim, H. G. Kim, J. K. Kim, J. W. Lee, K. S. Kim and J. Yoon, Org. Lett., 2003, 5, 2083–2086 CrossRef CAS PubMed.
- S. Yun, H. Ihm, H. G. Kim, C.-W. Lee, B. Indrajit, K. S. Oh, Y. J. Gong, J. W. Lee, J. Yoon, H. C. Lee and K. S. Kim, J. Org. Chem., 2003, 68, 2467–2470 CrossRef CAS PubMed.
- H. Ihm, S. Yun, H. G. Kim, J. K. Kim and K. S. Kim, Org. Lett., 2002, 4, 2897–2900 CrossRef CAS PubMed.
- K. Sato, S. Arai and T. Yamagishi, Tetrahedron Lett., 1999, 40, 5219–5222 CrossRef CAS.
- F. Garcia, M. R. Torres, E. Matesanz and L. Sanchez, Chem. Commun., 2011, 47, 5016–5018 RSC.
- V. Amendola, L. Fabbrizzi and E. Monzani, Chem. – Eur. J., 2004, 10, 76–82 CrossRef CAS PubMed.
- S.-I. Kondo, Supramol. Chem., 2011, 23, 29–36 CrossRef CAS.
- R. O. Ramabhadran, Y. Hua, Y.-J. Li, A.-H. Flood and K. Raghavachari, Chem. – Eur. J., 2011, 17, 9123–9129 CrossRef CAS PubMed.
- S. K. Dey, B. Ojha and G. Das, CrystEngComm, 2011, 13, 269–278 RSC.
- Y. Li and A. H. Flood, Angew. Chem., Int. Ed., 2008, 47, 2649–2652 CrossRef CAS PubMed.
- Y. Hua, R. O. Ramabhadran, E. O. Uduehi, J. K. Karty, K. Raghavachari and A. H. Flood, Chem. – Eur. J., 2011, 17, 312–321 CrossRef CAS PubMed.
- J. L. Sessler, T. D. Mody, D. A. Ford and V. Lynch, Angew. Chem., Int. Ed., 1992, 31, 452–455 CrossRef.
- H. Benesi and H. Hildebrand, J. Am. Chem. Soc., 1949, 71, 2703–2707 CrossRef CAS.
- M. J. Hynes, J. Chem. Soc., Dalton Trans., 1993, 311–312 RSC.
- Spartan'10 Wave function, Inc. Irvine, CA, USA, 2011.
- M. J. Frisch, G. W. Trucks, H. B. Schlegel, G. E. Scuseria, M. A. Robb, J. R. Cheeseman, G. Scalmani, V. Barone, B. Mennucci, G. A. Petersson, H. Nakatsuji, M. Caricato, X. Li, H. P. Hratchian, A. F. Izmaylov, J. Bloino, G. Zheng, J. L. Sonnenberg, M. Hada, M. Ehara, K. Toyota, R. Fukuda, J. Hasegawa, M. Ishida, T. Nakajima, Y. Honda, O. Kitao, H. Nakai, T. Vreven, J. A. Montgomery, Jr., J. E. Peralta, F. Ogliaro, M. Bearpark, J. J. Heyd, E. Brothers, K. N. Kudin, V. N. Staroverov, R. Kobayashi, J. Normand, K. Raghavachari, A. Rendell, J. C. Burant, S. S. Iyengar, J. Tomasi, M. Cossi, N. Rega, J. M. Millam, M. Klene, J. E. Knox, J. B. Cross, V. Bakken, C. Adamo, J. Jaramillo, R. Gomperts, R. E. Stratmann, O. Yazyev, A. J. Austin, R. Cammi, C. Pomelli, J. W. Ochterski, R. L. Martin, K. Morokuma, V. G. Zakrzewski, G. A. Voth, P. Salvador, J. J. Dannenberg, S. Dapprich, A. D. Daniels, O. Farkas, J. B. Foresman, J. V. Ortiz, J. Cioslowski and D. J. Fox, Gaussian 09, Revision C.01, Gaussian, Inc., Wallingford CT, 2009 Search PubMed.
- The Open-Source PyMol Molecular Graphics System, Version 1.7.2.1, Schrödinger, LLC, 2015.
Footnote |
| † Electronic supplementary information (ESI) available. See DOI: 10.1039/c5nj01457c |
| This journal is © The Royal Society of Chemistry and the Centre National de la Recherche Scientifique 2016 |