A highly selective and sensitive fluorescent turn-on Al3+ chemosensor in aqueous media and living cells: experimental and theoretical studies†
In Hong
Hwang
a,
Ye Won
Choi
a,
Kyung Beom
Kim
a,
Gyeong Jin
Park
a,
Jae Jun
Lee
a,
LeTuyen
Nguyen
b,
Insup
Noh
b and
Cheal
Kim
*a
aDepartment of Fine Chemistry and Department of Interdisciplinary Bio IT Materials, Seoul National University of Science and Technology, Seoul 139-743, Korea. E-mail: chealkim@seoultech.ac.kr; Fax: +82-2-973-9149; Tel: +82-2-970-6693
bDepartment of Chemical and Biomolecular Engineering, and Convergence Program of Biomedical Engineering and Biomaterials, Seoul National University of Science & Technology, Seoul 139-743, Republic of Korea
First published on 21st October 2015
Abstract
A highly selective and sensitive fluorescent chemosensor (1) based on a 2-aminobenzoic acid Schiff base has been synthesized in one step. The binding properties of 1 with metal ions were investigated by fluorescence, UV-vis, 1H NMR and electrospray ionization mass spectra. This sensor exhibited enhanced fluorescence in the presence of Al3+ in aqueous solution and also in living cells. The sensing mechanism of 1 toward Al3+ was explained by DFT/TDDFT calculations. The binding constant was determined to be 3.1 × 10⁸ M−1 which is one of the highest binding affinities among such simple Schiff bases for Al3+ in buffer solution. The calibration curve for the analytical performance of Al3+ was found to be linear over a concentration range with a very low detection limit of 290 nM (3σ).
1. Introduction
The development of selective and sensitive chemosensors for the detection of metal ions has received considerable attention because of their important roles in medicine, living systems and the environment.1–7 Among metals, aluminum is the third most prevalent metallic element in the Earth. People are widely exposed to aluminum because of its widespread use in food additives, aluminum-based pharmaceuticals and storage/cooking utensils.8–13 The World Health Organization (WHO) prescribed the average human intake of aluminum to be around 3–10 mg day−1 and limited its drinking water concentration to 7.41 μM. Tolerable weekly aluminum intake in the human body is estimated to be 7 mg kg−1 body weight.14–16 The superfluous ingestion of aluminum influences the absorption of calcium in the bowel, causing softening of the bone, atrophy and even aberrance, and also affects the absorption of iron in blood, causing anemia. In addition, the toxicity of aluminum causes damage to the central nervous system, is suspected to be involved in neurodegenerative diseases such as Alzheimer's and Parkinson's, and is responsible for intoxication in hemodialysis patients.17–19In recent years, much effort has been devoted to design various chemosensors specific for Al3+ detection.20–61 However, many of them have suffered from the cost of synthesis, the number of synthesis steps, selectivity, binding constants, detection limits, use of harmful organic solvents, and poor water solubility. Therefore, it is necessary to develop new sensors for selectively detecting Al3+ in aqueous solution. To increase the water solubility, we used 2-aminobenzoic acid with a carboxylic group acting as a hydrophilic character. To the best of our knowledge, very few studies have been reported on the use of aminobenzoic acid as a fluorescent chemosensor for the detection of metal ions.32,62–65
Herein, we report an aminobenzoic acid-based Schiff base 1 as a highly selective and sensitive fluorescent chemosensor for Al3+. 1 showed one of the highest binding affinities (Ka = 3.0 × 10⁸ M−1) among such simple Schiff bases for Al3+ in aqueous solution and quite a low detection limit (2.9 × 10⁻⁷ M) of a nanomolar concentration level.
2. Experimental section
2.1. Materials and instrumentation
All the solvents and reagents (analytical grade and spectroscopic grade) were obtained from Sigma-Aldrich and used as received. The Live/Dead assay (LIVE/DEAD® Viability/Cytotoxicity Kit) kit was purchased from Life Technologies Company. 1H NMR measurements were performed on a Varian 400 MHz spectrometer and chemical shifts were recorded in ppm. Electrospray ionization mass spectra (ESI-MS) were collected on a Thermo Finnigan (San Jose, CA, USA) LCQ™ Advantage MAX quadruple ion trap instrument. Elemental analysis for carbon, nitrogen, and hydrogen was carried out by using a Flash EA 1112 elemental analyzer (thermo) in the Organic Chemistry Research Center of Sogang University, Korea. Absorption spectra were recorded at 25 °C using a Perkin Elmer model Lambda 2S UV/vis spectrometer. Fluorescence measurements were performed on a Perkin Elmer model LS45 fluorescence spectrometer.2.2. Synthesis of the fluorescence sensor 1
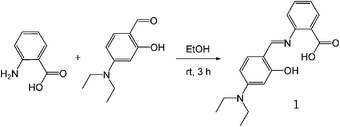
A solution of 2-aminobenzoic acid (0.14 g, 1 mmol) in ethanol was added to a solution containing 4-(diethylamino)-2-hydroxybenzaldehyde (0.19 g, 1 mmol) in ethanol and the mixture was stirred for 5 min. Then, two drops of HCl were added into the reaction solution and it was stirred for 3 h at room temperature. The solvent was evaporated and a bright yellow product was recrystallized from acetonitrile. The yield: 0.23 g (74.3%). 1H NMR (DMSO-d6, 400 MHz) δ: 8.72 (s, 1H), 7.93 (d, 1H, J = 7.6 Hz), 7.58 (d, 2H, J = 6.8 Hz), 7.44 (d, 1H, J = 8.8 Hz), 7.29 (m, 1H, J = 7.6 Hz), 6.41 (d, 1H, J = 8.4 Hz), 6.39 (s, 1H), 3.45 (q, 4H, J = 6.8 Hz), 1.14 (t, 6H, J = 7.0 Hz). ESI-mass m/z [M − H+]−: calcd, 311.14; found, 311.33. Anal. calcd for C18H20N2O3 (312.15): C, 69.21; H, 6.45; N, 8.97. Found: C, 69.60; H, 6.30; N, 8.70%.2.3. Fluorescence and UV-vis measurements
For fluorescence measurements, sensor 1 (1.6 mg, 0.005 mmol) was dissolved in methanol (5 mL) and 30 μL of sensor 1 (1 mM) were diluted with 2.97 mL bis-tris buffer (10 mM, pH 7.0, water![[thin space (1/6-em)]](https://www.rsc.org/images/entities/char_2009.gif) :
:![[thin space (1/6-em)]](https://www.rsc.org/images/entities/char_2009.gif) CH3OH = 1
CH3OH = 1![[thin space (1/6-em)]](https://www.rsc.org/images/entities/char_2009.gif) :
:![[thin space (1/6-em)]](https://www.rsc.org/images/entities/char_2009.gif) 1 (v/v)) to make the final concentration of 10 μM. Al(NO3)3·9H2O (37.5 mg, 0.1 mmol) was dissolved in methanol (5 mL). 1.5–28.5 μL of the Al3+ solution (20 mM) were transferred to each sensor solution (10 μM) prepared above. After mixing them for a few seconds, fluorescence spectra were obtained at room temperature.
1 (v/v)) to make the final concentration of 10 μM. Al(NO3)3·9H2O (37.5 mg, 0.1 mmol) was dissolved in methanol (5 mL). 1.5–28.5 μL of the Al3+ solution (20 mM) were transferred to each sensor solution (10 μM) prepared above. After mixing them for a few seconds, fluorescence spectra were obtained at room temperature.
For UV-vis measurements, all experimental conditions were identical as above. 1.5–21 μL of the Al3+ solution (10 mM) were transferred to each sensor solution (10 μM) prepared above. After mixing them for a few seconds, UV-vis spectra were taken at room temperature.
2.4. Job plot measurements
Sensor 1 (1.6 mg, 0.005 mmol) was dissolved in methanol (5 mL). 30, 27, 24, 21, 18, 15, 12, 9, 6, 3 and 0 μL of the sensor 1 solution were taken and transferred to vials. Each vial was diluted with bis-tris buffer (10 mM, pH 7.0, water![[thin space (1/6-em)]](https://www.rsc.org/images/entities/char_2009.gif) :
:![[thin space (1/6-em)]](https://www.rsc.org/images/entities/char_2009.gif) CH3OH = 1
CH3OH = 1![[thin space (1/6-em)]](https://www.rsc.org/images/entities/char_2009.gif) :
:![[thin space (1/6-em)]](https://www.rsc.org/images/entities/char_2009.gif) 1 (v/v)) to make a total volume of 2.97 mL. Al(NO3)3·9H2O (1.9 mg, 0.005 mmol) was dissolved in methanol (5 mL). 0, 3, 6, 9, 12, 15, 18, 21, 24, 27 and 30 μL of the Al(NO3)3 solution were added to each diluted sensor 1 solution. Each vial had a total volume of 3 mL. After shaking the vials for a few seconds, fluorescence spectra were taken at room temperature.
1 (v/v)) to make a total volume of 2.97 mL. Al(NO3)3·9H2O (1.9 mg, 0.005 mmol) was dissolved in methanol (5 mL). 0, 3, 6, 9, 12, 15, 18, 21, 24, 27 and 30 μL of the Al(NO3)3 solution were added to each diluted sensor 1 solution. Each vial had a total volume of 3 mL. After shaking the vials for a few seconds, fluorescence spectra were taken at room temperature.
2.5. NMR titration
For 1H NMR titration of sensor 1 with Al3+, four NMR tubes of sensor 1 (31.2 mg, 0.1 mmol) dissolved in DMSO-d6 (700 μL) were prepared and then four different concentrations (0, 0.02, 0.05 and 0.1 mmol) of Al(NO3)3·9H2O dissolved in DMSO were added to each solution of sensor 1. After shaking them for a minute, 1H NMR spectra were recorded at room temperature.2.6. Competition with other metal ions
Sensor 1 (1.6 mg, 0.005 mmol) was dissolved in methanol (5 mL) and 30 μL of sensor 1 (1 mM) were diluted with 2.97 mL bis-tris buffer (10 mM, water![[thin space (1/6-em)]](https://www.rsc.org/images/entities/char_2009.gif) :
:![[thin space (1/6-em)]](https://www.rsc.org/images/entities/char_2009.gif) CH3OH = 1
CH3OH = 1![[thin space (1/6-em)]](https://www.rsc.org/images/entities/char_2009.gif) :
:![[thin space (1/6-em)]](https://www.rsc.org/images/entities/char_2009.gif) 1 (v/v)) to make the final concentration of 10 μM. MNO3 (M = Na, K, 0.1 mmol) or M(NO3)2 (M = Mn, Co, Ni, Cu, Zn, Cd, Hg, Mg, Ca, Pb and Cr3+, 0.1 mmol) or M(NO3)3 (M = Fe, Al, Ga, In, 0.1 mmol) were separately dissolved in methanol (5 mL). 27 μL of each metal solution (20 mM) were taken and added into 3 mL of each sensor 1 solution (10 μM) prepared above to make 18 equiv. Then, 27 μL of Al(NO3)3 solution (20 mM) were added into the mixed solution of each metal ion and sensor 1 to make 18 equiv. After mixing them for a few seconds, fluorescence spectra were recorded at room temperature.
1 (v/v)) to make the final concentration of 10 μM. MNO3 (M = Na, K, 0.1 mmol) or M(NO3)2 (M = Mn, Co, Ni, Cu, Zn, Cd, Hg, Mg, Ca, Pb and Cr3+, 0.1 mmol) or M(NO3)3 (M = Fe, Al, Ga, In, 0.1 mmol) were separately dissolved in methanol (5 mL). 27 μL of each metal solution (20 mM) were taken and added into 3 mL of each sensor 1 solution (10 μM) prepared above to make 18 equiv. Then, 27 μL of Al(NO3)3 solution (20 mM) were added into the mixed solution of each metal ion and sensor 1 to make 18 equiv. After mixing them for a few seconds, fluorescence spectra were recorded at room temperature.
2.7. Methods for cell imaging and cytotoxicity
Human dermal fibroblast cells in low passage were cultured in FGM-2 medium (Lonza, Switzerland) supplemented with 10% fetal bovine serum, 1% penicillin/streptomycin in an in vitro incubator with 5% CO2 at 37 °C. Cells were seeded onto a 12 well plate (SPL Lifesciences, Korea) at a density of 2 × 10⁵ cells per well and then incubated at 37 °C for 4 h after the addition of various concentrations (0–200 μM) of Al(NO3)3 dissolved in DMSO. After washing with phosphate buffered saline (PBS) two times to remove the remaining Al(NO3)3, the cells were incubated with 1 dissolved in a medium/DMSO solution (FGM-2-medium![[thin space (1/6-em)]](https://www.rsc.org/images/entities/char_2009.gif) :
:![[thin space (1/6-em)]](https://www.rsc.org/images/entities/char_2009.gif) DMSO = 9
DMSO = 9![[thin space (1/6-em)]](https://www.rsc.org/images/entities/char_2009.gif) :
:![[thin space (1/6-em)]](https://www.rsc.org/images/entities/char_2009.gif) 1 v/v) at room temperature for 30 min. The cells were observed using a microscope (Olympus, Japan). The fluorescent images of the cells were obtained using a fluorescence microscope (Leica DMLB, Germany) at the excitation wavelength of 410 nm.
1 v/v) at room temperature for 30 min. The cells were observed using a microscope (Olympus, Japan). The fluorescent images of the cells were obtained using a fluorescence microscope (Leica DMLB, Germany) at the excitation wavelength of 410 nm.
To observe cell viability, a live & dead assay was performed for 1 and the 1-Al3+ complex. Fibroblasts (P = 5) were in vitro cultured to reach 70% confluence. The cells were incubated with 1 (10 μM) dissolved in a medium/DMSO solution (FGM-2-medium![[thin space (1/6-em)]](https://www.rsc.org/images/entities/char_2009.gif) :
:![[thin space (1/6-em)]](https://www.rsc.org/images/entities/char_2009.gif) DMSO = 9
DMSO = 9![[thin space (1/6-em)]](https://www.rsc.org/images/entities/char_2009.gif) :
:![[thin space (1/6-em)]](https://www.rsc.org/images/entities/char_2009.gif) 1 v/v) for 1 h, 12 h and 24 h, respectively. The reagent (400 μL) of the live & dead assay was added into each cell culture plate. In case of the 1-Al3+ complex, the cells were incubated with Al(NO3)3 (150 μM) dissolved in MeCN. After washing with phosphate buffered saline (PBS) two times to remove the remaining Al(NO3)3, the cells were incubated with 1 dissolved in a medium/DMSO solution (FGM-2-medium
1 v/v) for 1 h, 12 h and 24 h, respectively. The reagent (400 μL) of the live & dead assay was added into each cell culture plate. In case of the 1-Al3+ complex, the cells were incubated with Al(NO3)3 (150 μM) dissolved in MeCN. After washing with phosphate buffered saline (PBS) two times to remove the remaining Al(NO3)3, the cells were incubated with 1 dissolved in a medium/DMSO solution (FGM-2-medium![[thin space (1/6-em)]](https://www.rsc.org/images/entities/char_2009.gif) :
:![[thin space (1/6-em)]](https://www.rsc.org/images/entities/char_2009.gif) DMSO = 9
DMSO = 9![[thin space (1/6-em)]](https://www.rsc.org/images/entities/char_2009.gif) :
:![[thin space (1/6-em)]](https://www.rsc.org/images/entities/char_2009.gif) 1 v/v) at room temperature for 1 h, 12 h and 24 h, respectively. The reagent (400 μL) of the live & dead assay was added into each cell culture plate. Both viability and morphological changes of the cells were observed using a fluorescence microscope (Leica DMLB, Leica; Wetzlar, Germany).
1 v/v) at room temperature for 1 h, 12 h and 24 h, respectively. The reagent (400 μL) of the live & dead assay was added into each cell culture plate. Both viability and morphological changes of the cells were observed using a fluorescence microscope (Leica DMLB, Leica; Wetzlar, Germany).
2.8. Theoretical calculations
All theoretical calculations were performed by using the Gaussian 03 suite.66 The singlet ground states (S0) of 1 and the Al3+–2·1 complex were optimized by DFT methods with Becke's three parameterized Lee–Yang–Parr (B3LYP) exchange functional67,68 with the 6-31G** basis set.69,70 In vibrational frequency calculations, there was no imaginary frequency for 1 and the Al3+–2·1 complex, suggesting that the optimized 1 and the Al3+–2·1 complex represented local minima. For all calculations, the solvent effect was considered by using the Cossi and Barone's CPCM (conductor-like polarizable continuum model).71,72 To investigate the electronic properties of singlet excited states, time-dependent DFT (TDDFT) was performed in the ground state geometries of 1 and the Al3+–2·1 complex. The 20 singlet–singlet excitations were calculated and analyzed. The GaussSum 2.173 was used to calculate the contributions of molecular orbitals in electronic transitions.3. Results and discussion
3.1. Spectroscopic measurements of 1 toward Al3+
Sensor 1 was obtained by coupling 2-aminobenzoic acid with 4-(diethylamino)-2-hydroxybenzaldehyde with 74% yield in ethanol (Scheme 1), and characterized by 1H NMR, ESI-mass spectrometry, and elemental analysis.We studied the fluorescence response behaviors of 1 towards various metal ions in bis-tris buffer (10 mM, pH 7.0, water![[thin space (1/6-em)]](https://www.rsc.org/images/entities/char_2009.gif) :
:![[thin space (1/6-em)]](https://www.rsc.org/images/entities/char_2009.gif) CH3OH = 1
CH3OH = 1![[thin space (1/6-em)]](https://www.rsc.org/images/entities/char_2009.gif) :
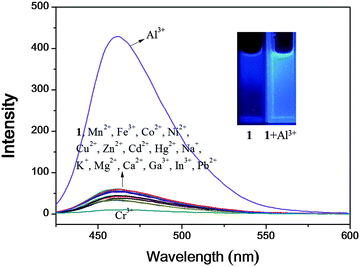
:![[thin space (1/6-em)]](https://www.rsc.org/images/entities/char_2009.gif) 1 (v/v)). As shown in Fig. 1, sensor 1 alone displayed a very weak fluorescence emission upon excitation at 410 nm. The addition of Al3+ resulted in a prominent fluorescence enhancement (11-fold) at 460 nm. In contrast, other metal ions such as Mn2+, Fe3+, Co2+, Ni2+, Cu2+, Zn2+, Cd2+, Hg2+, Na+, K+, Mg2+, Ca2+, Pb2+ and Cr3+ caused almost no fluorescence increase. Importantly, the addition of Ga3+ or In3+, which belong to the same group with Al3+ in the periodic table, had no significant effect on the fluorescence, demonstrating that sensor 1 was even highly selective for Al3+ over Ga3+ and In3+. So far, only a few selective sensors which can discriminate Al3+ from both Ga3+ and In3+ have been reported.20–22,26 The selectivity of 1 toward Al3+ in bis-tris buffer alone was also observed, but fluorescence enhancement was not high enough (Fig. S1, ESI†).
1 (v/v)). As shown in Fig. 1, sensor 1 alone displayed a very weak fluorescence emission upon excitation at 410 nm. The addition of Al3+ resulted in a prominent fluorescence enhancement (11-fold) at 460 nm. In contrast, other metal ions such as Mn2+, Fe3+, Co2+, Ni2+, Cu2+, Zn2+, Cd2+, Hg2+, Na+, K+, Mg2+, Ca2+, Pb2+ and Cr3+ caused almost no fluorescence increase. Importantly, the addition of Ga3+ or In3+, which belong to the same group with Al3+ in the periodic table, had no significant effect on the fluorescence, demonstrating that sensor 1 was even highly selective for Al3+ over Ga3+ and In3+. So far, only a few selective sensors which can discriminate Al3+ from both Ga3+ and In3+ have been reported.20–22,26 The selectivity of 1 toward Al3+ in bis-tris buffer alone was also observed, but fluorescence enhancement was not high enough (Fig. S1, ESI†).
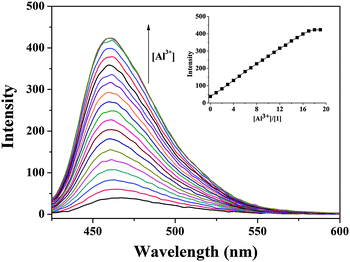
To further study the fluorescence sensing behavior of 1, a quantitative investigation of the binding affinity of 1 with Al3+ was studied by fluorescence titration (Fig. 2). When sensor 1 was titrated with Al3+, the fluorescence intensity increased up to 18 equiv. and then no change was observed, which might be due to a combinational effect of the inhibition of C![[double bond, length as m-dash]](https://www.rsc.org/images/entities/char_e001.gif) N isomerization and the activation of chelation enhanced fluorescence (CHEF).45,74–76 Imines are poorly fluorescent in part due to isomerization of the C
N isomerization and the activation of chelation enhanced fluorescence (CHEF).45,74–76 Imines are poorly fluorescent in part due to isomerization of the C![[double bond, length as m-dash]](https://www.rsc.org/images/entities/char_e001.gif) N double bond in the excited state. The C
N double bond in the excited state. The C![[double bond, length as m-dash]](https://www.rsc.org/images/entities/char_e001.gif) N isomerization might be inhibited upon complexation with certain metal ions. Therefore, the stable chelation of 1 with Al3+ ions made the C
N isomerization might be inhibited upon complexation with certain metal ions. Therefore, the stable chelation of 1 with Al3+ ions made the C![[double bond, length as m-dash]](https://www.rsc.org/images/entities/char_e001.gif) N isomerization of 1 inhibited, resulting in fluorescence enhancement. Moreover, the complexation of 1 with Al3+ ions induced rigidity in the resulting molecule and tended to produce a chelation-enhanced fluorescence detection. The fluorescence quantum yields of sensor 1 without and with Al3+ were 0.0062 and 0.4240, respectively.77
N isomerization of 1 inhibited, resulting in fluorescence enhancement. Moreover, the complexation of 1 with Al3+ ions induced rigidity in the resulting molecule and tended to produce a chelation-enhanced fluorescence detection. The fluorescence quantum yields of sensor 1 without and with Al3+ were 0.0062 and 0.4240, respectively.77
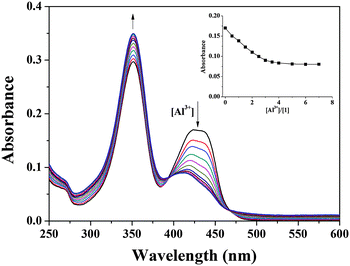
The binding properties of 1 with Al3+ were further studied by UV-vis titration experiments (Fig. 3). On treating Al3+ with the solution of 1, the absorption peak at 425 nm gradually decreased while the peak at 352 nm increased. Two clear isosbestic points were observed at 395 and 468 nm, indicative of a clean conversion of 1 into the 1-Al3+ complex.
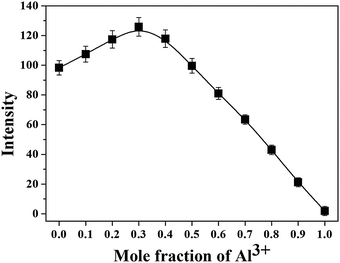
The Job plot for the binding between 1 and Al3+ exhibited a 2![[thin space (1/6-em)]](https://www.rsc.org/images/entities/char_2009.gif) :
:![[thin space (1/6-em)]](https://www.rsc.org/images/entities/char_2009.gif) 1 stoichiometry (Fig. 4).78 Also, the negative-ion mass spectrum for the reaction of 1 with Al3+ showed the formation of the [2·1(-4H+) + Al3+]− complex [m/z: 647.27; calcd, 647.24] (Fig. S2, ESI†). From the fluorescence titration, the association constant was calculated to be 3.1 × 10⁸ M−1 from Li's equations (see the ESI,† and Fig. S3).79 This value is one of the highest binding affinities among such simple Schiff bases for Al3+ in buffer solution, indicating that the carboxylic group showed the most effective binding property among other functional groups such as imine, amine, and quinolone (Table S1, ESI†).80–82
1 stoichiometry (Fig. 4).78 Also, the negative-ion mass spectrum for the reaction of 1 with Al3+ showed the formation of the [2·1(-4H+) + Al3+]− complex [m/z: 647.27; calcd, 647.24] (Fig. S2, ESI†). From the fluorescence titration, the association constant was calculated to be 3.1 × 10⁸ M−1 from Li's equations (see the ESI,† and Fig. S3).79 This value is one of the highest binding affinities among such simple Schiff bases for Al3+ in buffer solution, indicating that the carboxylic group showed the most effective binding property among other functional groups such as imine, amine, and quinolone (Table S1, ESI†).80–82
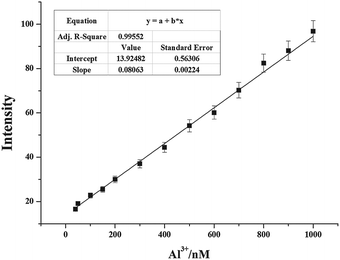
By using the above-mentioned fluorescence titration results, the detection limit of 1 for the analysis of Al3+ ions on the basis of 3σ/K was calculated to be 2.9 × 10⁻⁷ M (Fig. S4, ESI†).83 The detection limit of 1 was quite lower than the WHO limit of Al3+ (7.41 × 10⁻⁶ M) acceptable in drinking water, which means that sensor 1 is a powerful tool for the detection of Al3+ in aqueous solution. The analytical performance characteristics of the proposed Al3+-sensitive chemosensor were investigated. Fig. 5 shows a calibration curve obtained from the plot of fluorescence intensity with the added Al3+ concentration. The curve equation was I = 0.08063CAl + 13.924 where the CAl unit was nM (R2 = 0.996). The linear range of quantitative detection for aluminum ions was determined to be 40–1000 nM with a detection limit of 290 nM (3σ). The detection limit appeared to be within the range of quantitative detection of aluminum ions. Therefore, sensor 1 was not only selective towards aluminum(III) ions but also possessed a linear response range with a low limit of detection.
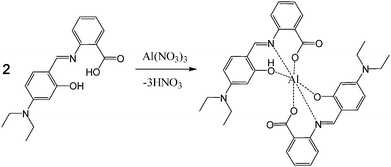
The 1H NMR titration experiments of sensor 1 with Al3+ ions were studied to further examine the binding mode (Fig. 6). The protons of carboxyl and hydroxyl groups did not appear maybe due to the intra- or inter-molecular hydrogen bonds. Upon addition of 0.5 equiv. of Al3+, the Ha proton of the imine moiety and the Hc and Hd protons of the ethyl groups were shifted to downfield by 0.32, 0.10, and 0.06 ppm, respectively. Also, the protons of the two benzene rings were more complicated and shifted to downfield except for Hb, which was shifted to upfield by 0.15 ppm. Further addition of Al3+ showed no spectral change. These results suggested that the two oxygen atoms of the carboxyl and hydroxyl groups and the nitrogen atom of the imine moiety might be involved in Al3+ coordination. Based on 1H NMR titration, the Job plot, and ESI-mass spectrometry analysis, we proposed the structure of a 2![[thin space (1/6-em)]](https://www.rsc.org/images/entities/char_2009.gif) :
:![[thin space (1/6-em)]](https://www.rsc.org/images/entities/char_2009.gif) 1 complex of 1 and Al3+, as shown in Scheme 2.
1 complex of 1 and Al3+, as shown in Scheme 2.
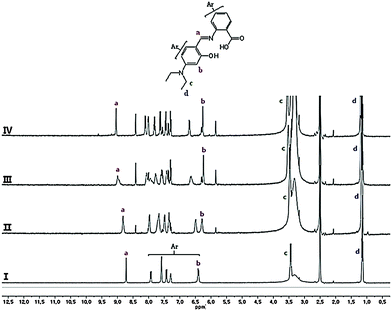 | ||
| Fig. 6 1H NMR titration of 1 with Al(NO3)3: (I) 1; (II) 1 with 0.2 equiv. of Al3+; (III) 1 with 0.5 equiv. of Al3+; and (IV) 1 with 1 equiv. of Al3+. | ||
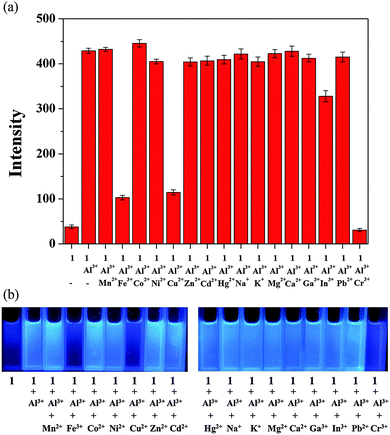
To further check the practical applicability of sensor 1 as an Al3+ selective fluorescent sensor, we carried out competition experiments. When 1 was treated with 18 equiv. of Al3+ in the presence of the same concentration of other metal ions, the fluorescence enhancement caused by Al3+ was retained with Mn2+, Co2+, Ni2+, Zn2+, Cd2+, Hg2+, Na+, K+, Mg2+, Ca2+, Ga3+, In3+, and Pb2+ (Fig. 7). Instead, Fe3+, Cu2+ and Cr3+ inhibited about 80%, 80% and 100% of the interaction between 1 and Al3+, which are the well known strong quenchers of fluorescence.84,85 Thus, sensor 1 can be used as a selective fluorescent sensor for Al3+ in the presence of most competing metal ions.
For biological applications, the pH dependence of the Al3+–2·1 complex was examined in bis-tris buffer (10 mM, water![[thin space (1/6-em)]](https://www.rsc.org/images/entities/char_2009.gif) :
:![[thin space (1/6-em)]](https://www.rsc.org/images/entities/char_2009.gif) CH3OH = 1
CH3OH = 1![[thin space (1/6-em)]](https://www.rsc.org/images/entities/char_2009.gif) :
:![[thin space (1/6-em)]](https://www.rsc.org/images/entities/char_2009.gif) 1 (v/v)) solution (Fig. 8). The fluorescence intensity of the Al3+–2·1 complex displayed a significant response between pH 5 and 10, which includes the environmentally relevant range of pH 7.0–8.4.86 These results indicated that Al3+ could be clearly detected by the fluorescence spectra measurement using 1 over the environmentally relevant pH range (pH 7.0–8.4).
1 (v/v)) solution (Fig. 8). The fluorescence intensity of the Al3+–2·1 complex displayed a significant response between pH 5 and 10, which includes the environmentally relevant range of pH 7.0–8.4.86 These results indicated that Al3+ could be clearly detected by the fluorescence spectra measurement using 1 over the environmentally relevant pH range (pH 7.0–8.4).
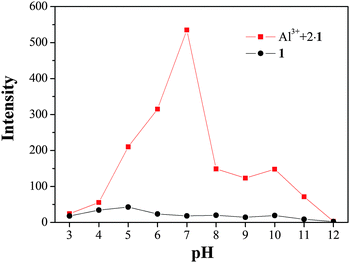 | ||
Fig. 8 Fluorescence intensity (at 460 nm) of the Al3+–2·1 complex at different pH values (3–12) in bis-tris buffer (10 mM, water![[thin space (1/6-em)]](https://www.rsc.org/images/entities/char_2009.gif) : :![[thin space (1/6-em)]](https://www.rsc.org/images/entities/char_2009.gif) CH3OH = 1 CH3OH = 1![[thin space (1/6-em)]](https://www.rsc.org/images/entities/char_2009.gif) : :![[thin space (1/6-em)]](https://www.rsc.org/images/entities/char_2009.gif) 1 (v/v)). 1 (v/v)). | ||
3.2. Application for cell imaging
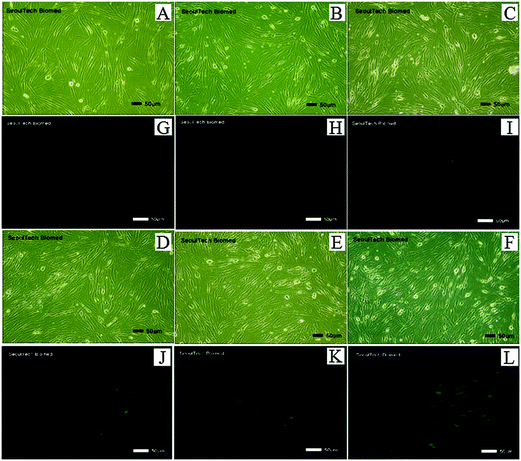
Further experiments were conducted to test whether intracellular Al3+ could be monitored by fluorimetry. Adult human dermal fibroblasts were first incubated with various concentrations of Al3+ (0, 30, 50, 100, 150 and 200 μM) for 4 h and then exposed to 1 for 30 min before imaging, so that 1 could permeate easily through the living cells without any harm. The fibroblasts that were cultured with both Al3+ and 1 exhibited fluorescence (Fig. 9), whereas the cells cultured without Al3+ or 1 did not exhibit fluorescence. The intensity and region of the fluorescence within the cell containing 1 gradually increased with an increase in the Al3+ concentration from 0 to 200 μM and the fluorescence intensity of the cells persisted even after 5 h from exposure to 1. Moreover, the biocompatibility of 1 was also examined with the living cells (Fig. S5, ESI†). All the fibroblasts were still alive for 24 h. These results showed that the new sensor 1 was efficient to image Al3+ in cells, and could be useful in the determination of the exposure level of cells to Al3+.3.3. Theoretical calculations for 1 and the Al3+–2·1 complex
To gain an insight into the fluorescent sensing mechanism for the Al3+–2·1 complex, time-dependent density functional theory (TD-DFT) calculations were performed at the optimized geometries (S0) of 1 and the Al3+–2·1 complex (Fig. S6, ESI†). The optimized geometries were calculated based on the Job plot, ESI-mass and 1H NMR titration. In case of 1, the main molecular orbital (MO) contribution of the first lowest excited state was determined for the HOMO → LUMO transition (394.61 nm, Fig. S7, ESI†), which indicated an intramolecular charge transfer (ICT) transition from the julolidine moiety to the benzoic acid moiety. For the Al3+–2·1 complex, the first lowest excited state was determined for the HOMO → LUMO transition (499.43 nm, Fig. S8, ESI†), which indicated the forbidden transition (oscillator strength: 0.0045). The main molecular orbital (MO) contributions of the fifth lowest excited states were determined for HOMO → LUMO+1 and HOMO−1 → LUMO+1 transitions (367.42 nm, Fig. S8, ESI†), which showed the allowed transition and was similar to the intramolecular charge transfer (ICT) transition of 1. There were no obvious changes in the electronic transitions between 1 and the Al3+–2·1 complex. Only, hypochromic shift (394.61 to 367.42 nm) was observed upon chelation of 1 with Al3+. These results suggested that the sensing mechanism of 1 toward Al3+ originated from the rigid structure of the Al3+–2·1 complex, which might inhibit the non-radiative process such as C![[double bond, length as m-dash]](https://www.rsc.org/images/entities/char_e001.gif) N isomerization. Thus, the CHEF effect and the inhibition of C
N isomerization. Thus, the CHEF effect and the inhibition of C![[double bond, length as m-dash]](https://www.rsc.org/images/entities/char_e001.gif) N isomerization plays an important role in fluorescence enhancement.87,88
N isomerization plays an important role in fluorescence enhancement.87,88
4. Conclusion
We have developed a simple, cost-effective, fluorescent aminobenzoic acid-based chemosensor 1 for selective determination of Al3+ in aqueous solution. Sensor 1 displayed a remarkable fluorescence enhancement in the presence of Al3+ ions and can be successfully applied to living cells for detecting Al3+. The large enhancement of fluorescence was explained by the inhibition of C![[double bond, length as m-dash]](https://www.rsc.org/images/entities/char_e001.gif) N isomerization and the activation of chelation enhanced fluorescence (CHEF), which were explained by theoretical calculations. On the basis of the Job plot, 1H NMR titration and ESI-mass spectrometry analysis, the formation of the 2
N isomerization and the activation of chelation enhanced fluorescence (CHEF), which were explained by theoretical calculations. On the basis of the Job plot, 1H NMR titration and ESI-mass spectrometry analysis, the formation of the 2![[thin space (1/6-em)]](https://www.rsc.org/images/entities/char_2009.gif) :
:![[thin space (1/6-em)]](https://www.rsc.org/images/entities/char_2009.gif) 1 (1
1 (1![[thin space (1/6-em)]](https://www.rsc.org/images/entities/char_2009.gif) :
:![[thin space (1/6-em)]](https://www.rsc.org/images/entities/char_2009.gif) M) complex was proposed. Moreover, sensor 1 showed one of the highest binding constants (3.1 × 10⁸) among such simple Schiff bases in aqueous solution and displayed a linear response range with a low limit of detection (290 nM) for the analytical performance of Al3+ ions.
M) complex was proposed. Moreover, sensor 1 showed one of the highest binding constants (3.1 × 10⁸) among such simple Schiff bases in aqueous solution and displayed a linear response range with a low limit of detection (290 nM) for the analytical performance of Al3+ ions.
Acknowledgements
Basic Science Research Program through the National Research Foundation of Korea (NRF) funded by the Ministry of Education, Science and Technology (NRF-2014R1A2A1A11051794 and NRF-2015R1A2A2A09001301) are gratefully acknowledged.References
- C. Liang, W. Bu, C. Li, G. Men, M. Deng, Y. Jiangyao, H. Sun and S. Jiang, Dalton Trans., 2015, 44, 11352–11359 RSC.
- H. Wang, B. Wang, Z. Shi, X. Tang, W. Dou, Q. Han, Y. Zhang and W. Liu, Biosens. Bioelectron., 2015, 65, 91–96 CrossRef CAS PubMed.
- C. Li, J. Qin, G. Wang, B. Wang, A. Fu and Z. Yang, Inorg. Chim. Acta, 2015, 430, 91–95 CrossRef CAS.
- R. R. Koner, S. Sinha, S. Kumar, C. K. Nandi and S. Ghosh, Tetrahedron Lett., 2012, 53, 2302–2307 CrossRef CAS.
- S. Sinha, T. Mukherjee, J. Mathew, S. K. Mukhopadhyay and S. Ghosh, Anal. Chim. Acta, 2014, 822, 60–68 CrossRef CAS PubMed.
- Z. Liu, C. Zhang, Y. Li, Z. Wu, F. Qian, X. Yang, W. He, X. Gao and Z. Guo, Org. Lett., 2009, 11, 795–798 CrossRef CAS PubMed.
- X. Qu, C. Li, H. Chen, J. Mack, Z. Guo and Z. Shen, Chem. Commun., 2013, 49, 7510–7512 RSC.
- D. Maity and T. Govindaraju, Inorg. Chem., 2010, 49, 7229–7231 CrossRef CAS PubMed.
- D. Maity and T. Govindaraju, Chem. Commun., 2010, 46, 4499–4501 RSC.
- A. Sahana, A. Banerjee, S. Lohar, A. Banik, S. K. Mukhopadhyay, D. A. Safin, M. G. Babashkina, M. Bolte, Y. Garcia and D. Das, Dalton Trans., 2013, 42, 13311–13314 RSC.
- A. Banerjee, A. Sahana, S. Das, S. Lohar, B. Sarkar, S. K. Mukhopadhyay, A. K. Mukherjee and D. Das, Analyst, 2012, 137, 2166–2175 RSC.
- J. Y. Jung, S. J. Han, J. Chun, C. Lee and J. Yoon, Dyes Pigm., 2012, 94, 423–426 CrossRef CAS.
- S. Yun, Y.-O. Kim, D. Kim, H. G. Kim, H. Ihm, J. K. Kim, C.-W. Lee, W. J. Lee, J. J. Yoon, K. S. Oh, J. Yoon, S.-M. Park and K. S. Kim, Org. Lett., 2003, 5, 471–474 CrossRef CAS PubMed.
- G. Berthon, Coord. Chem. Rev., 2002, 228, 319–341 CrossRef CAS.
- Z. Krejpcio and R. W. Wojciak, Pol. J. Environ. Stud., 2002, 11, 251–254 CAS.
- J. Barcelo and C. Poschenrieder, Environ. Exp. Bot., 2002, 48, 75–92 CrossRef CAS.
- P. Nayak, Environ. Res., 2002, 89, 101–115 CrossRef CAS.
- J. Kumar, M. J. Sarma and P. Phukan, Dalton Trans., 2015, 44, 4576–4581 RSC.
- C. Exley, Coord. Chem. Rev., 2012, 256, 2142–2146 CrossRef CAS.
- J. Lee, H. Kim, S. Kim, J. Y. Noh, E. J. Song, C. Kim and J. Kim, Dyes Pigm., 2013, 96, 590–594 CrossRef CAS.
- M. Mukherjee, S. Pal, S. Lohar, B. Sen, S. Sen, S. Banerjee and P. Chattopadhyay, Analyst, 2014, 139, 4828–4835 RSC.
- S. Hu, J. Song, G. Wu, C. Cheng and Q. Gao, Spectrochim. Acta, Part A, 2014, 136, 1188–1194 CrossRef PubMed.
- Y. J. Jang, Y. H. Yeon, H. Y. Yang, J. Y. Noh, I. H. Hwang and C. Kim, Inorg. Chem. Commun., 2013, 33, 48–51 CrossRef CAS.
- L. Wang, L. Yang and D. Cao, Sens. Actuators, B, 2014, 202, 949–958 CrossRef CAS.
- W. Cao, X.-J. Zheng, J.-P. Sun, W.-T. Wong, D.-C. Fang, J.-X. Zhang and L.-P. Jin, Inorg. Chem., 2014, 53, 3012–3021 CrossRef CAS PubMed.
- J. Y. Noh, S. Kim, I. H. Hwang, G. Y. Lee, J. Kang, S. H. Kim, J. Min, S. Park, C. Kim and J. Kim, Dyes Pigm., 2013, 99, 1016–1021 CrossRef CAS.
- K. Tiwari, M. Mishra and V. P. Singh, RSC Adv., 2013, 3, 12124–12132 RSC.
- C.-H. Chen, D.-J. Liao, C.-F. Wan and A.-T. Wu, Analyst, 2013, 138, 2527–2530 RSC.
- S. Kim, J. Y. Noh, K. Y. Kim, J. H. Kim, H. K. Kang, S. W. Nam, S. H. Kim, S. Park, C. Kim and J. Kim, Inorg. Chem., 2012, 51, 3597–3602 CrossRef CAS PubMed.
- L. Fan, J. Qin, T. Li, B. Wang and Z. Yang, Sens. Actuators, B, 2014, 203, 550–556 CrossRef CAS.
- Y. K. Jang, U. C. Nam, H. L. Kwon, I. H. Hwang and C. Kim, Dyes Pigm., 2013, 99, 6–13 CrossRef CAS.
- O. Alici and S. Erdemir, Sens. Actuators, B, 2015, 208, 159–163 CrossRef CAS.
- Y. Jiang, L.-L. Sun, G.-Z. Ren, X. Niu, W.-Z. Hu and Z.-Q. Hu, ChemistryOpen, 2015, 4, 378–382 CrossRef CAS PubMed.
- S. Erdemir, O. Kocyigit and S. Malkondu, J. Fluoresc., 2015, 25, 719–727 CrossRef CAS PubMed.
- N. R. Chereddy, P. Nagaraju, M. V. N. Raju, V. R. Krishnaswamy, P. S. Korrapati, P. R. Bangal and V. J. Rao, Biosens. Bioelectron., 2015, 68, 749–756 CrossRef CAS PubMed.
- S. Gui, Y. Huang, F. Hu, Y. Jin, G. Zhang, L. Yan, D. Zhang and R. Zhao, Anal. Chem., 2015, 87, 1470–1474 CrossRef CAS PubMed.
- L. Peng, Z. Zhou, X. Wang, R. Wei, K. Li, Y. Xiang and A. Tong, Anal. Chim. Acta, 2014, 829, 54–59 CrossRef CAS PubMed.
- S. K. Shooraa, A. K. Jaina and V. K. Gupta, Sens. Actuators, B, 2015, 216, 86–104 CrossRef.
- H. Kim, B. A. Rao, J. W. Jeong, S. Mallick, S.-M. Kang, J. S. Choi, C.-S. Lee and Y.-A. Son, Sens. Actuators, B, 2015, 210, 173–182 CrossRef CAS.
- J. W. Jeong, B. A. Rao and Y.-A. Son, Sens. Actuators, B, 2015, 208, 75–84 CrossRef CAS.
- W.-H. Ding, D. Wang, X.-J. Zheng, W.-J. Ding, J.-Q. Zheng, W.-H. Mu, W. Cao and L.-P. Jin, Sens. Actuators, B, 2015, 209, 359–367 CrossRef CAS.
- S. Paul, A. Manna and S. Goswami, Dalton Trans., 2015, 44, 11805–11810 RSC.
- J. Wang and Y. Pang, RSC Adv., 2014, 4, 5845–5848 RSC.
- S. Goswami, A. Manna, S. Paul, A. K. Maity, P. Saha, C. K. Quah and H.-K. Fun, RSC Adv., 2014, 4, 34572–34576 RSC.
- J. J. Lee, G. J. Park, Y. S. Kim, S. Y. Lee, H. J. Lee, I. S. Noh and C. Kim, Biosens. Bioelectron., 2015, 69, 226–229 CrossRef PubMed.
- Y. Lu, S. Huang, Y. Liu, S. He, L. Zhao and X. Zeng, Org. Lett., 2011, 13, 5274–5277 CrossRef CAS PubMed.
- S. H. Kim, H. S. Choi, J. Kim, S. J. Lee, D. T. Quang and J. S. Kim, Org. Lett., 2012, 12, 560–563 CrossRef PubMed.
- S. Sen, T. Mukherjee, B. Chattopadhyay, A. Moirangthem, A. Basu, J. Marek and P. Chattopadhyay, Analyst, 2012, 137, 3975–3981 RSC.
- V. P. Singh, K. Tiwari, M. Mishra, N. Srivastava and S. Saha, Sens. Actuators, B, 2013, 182, 546–554 CrossRef CAS.
- S. Guha, S. Lohar, A. Sahana, A. Banerjee, D. A. Safin, M. G. Babashkina, M. P. Mitoraj, M. Bolte, Y. Garcia, S. K. Mukhopadhyay and D. Das, Dalton Trans., 2013, 42, 10198–10207 RSC.
- S. Das, A. Sahana, A. Banerjee, S. Lohar, D. A. Safin, M. G. Babashkina, M. Bolte, Y. Garcia, I. Hauli, S. K. Mukhopadhyay and D. Das, Dalton Trans., 2013, 42, 4757–4763 RSC.
- A. Sahana, A. Banerjee, S. Das, S. Lohar, D. Karak, B. Sarkar, S. K. Mukhopadhyay, A. K. Mukherjee and D. Das, Org. Biomol. Chem., 2011, 9, 5523–5529 CAS.
- L. Wang, W. Qin, X. Tang, W. Dou, W. Liu, Q. Teng and X. Yao, Org. Biomol. Chem., 2010, 8, 3751–3757 CAS.
- S. Sinha, R. R. Koner, S. Kumar, J. Mathew, P. V. Monisha, I. Kazi and S. Ghosh, RSC Adv., 2013, 3, 345–351 RSC.
- Y.-W. Wang, M.-X. Yu, Y.-H. Yu, Z.-P. Bai, Z. Shen, F.-Y. Li and X.-Z. You, Tetrahedron Lett., 2009, 50, 6169–6172 CrossRef CAS.
- A. Dhara, A. Jana, S. Konar, S. K. Ghatak, S. Ray, K. Das, A. Bandyopadhyay, N. Guchhait and S. K. Kar, Tetrahedron Lett., 2013, 54, 3630–3634 CrossRef CAS.
- T.-J. Jia, W. Cao, X.-J. Zheng and L.-P. Jin, Tetrahedron Lett., 2013, 54, 3471–3474 CrossRef CAS.
- B. K. Datta, C. Kar, A. Basu and G. Das, Tetrahedron Lett., 2013, 54, 771–774 CrossRef CAS.
- D. Karak, S. Lohar, A. Sahana, S. Guha, A. Banerjee and D. Das, Anal. Methods, 2012, 4, 1906–1908 RSC.
- K. Kaur, V. K. Bhardwaj, N. Kaur and N. Singh, Inorg. Chem. Commun., 2012, 26, 31–36 CrossRef CAS.
- Z. Liu, Z. Yang, Y. Li, T. Li, B. Wang, Y. Li and X. Jin, Inorg. Chim. Acta, 2013, 395, 77–80 CrossRef CAS.
- J. Isaad and A. E. Achari, Tetrahedron, 2011, 67, 4939–4947 CrossRef CAS.
- S. Mukherjee, P. Mal and H. Stoeckli-Evans, J. Lumin., 2014, 155, 185–190 CrossRef CAS.
- Z. Yu, L. A. Bracero, L. Chen, W. Song, X. Wang and B. Zhao, Spectrochim. Acta, Part A, 2013, 105, 52–56 CrossRef CAS PubMed.
- Z. Li, J. Pan and J. Tang, Anal. Lett., 2002, 35, 167–183 CrossRef CAS.
- M. J. Frisch, G. W. Trucks, H. B. Schlegel, G. E. Scuseria, M. A. Robb, J. R. Cheeseman, J. A. Montgomery, Jr., T. Vreven, K. N. Kudin, J. C. Burant, J. M. Millam, S. S. Iyengar, J. Tomasi, V. Barone, B. Mennucci, M. Cossi, G. Scalmani, N. Rega, G. A. Petersson, H. Nakatsuji, M. Hada, M. Ehara, K. Toyota, R. Fukuda, J. Hasegawa, M. Ishida, T. Nakajima, Y. Honda, O. Kitao, H. Nakai, M. Klene, X. Li, J. E. Knox, H. P. Hratchian, J. B. Cross, V. Bakken, C. Adamo, J. Jaramillo, R. Gomperts, R. E. Stratmann, O. Yazyev, A. J. Austin, R. Cammi, C. Pomelli, J. W. Ochterski, P. Y. Ayala, K. Morokuma, G. A. Voth, P. Salvador, J. J. Dannenberg, V. G. Zakrzewski, S. Dapprich, A. D. Daniels, M. C. Strain, O. Farkas, D. K. Malick, A. D. Rabuck, K. Raghavachari, J. B. Foresman, J. V. Ortiz, Q. Cui, A. G. Baboul, S. Clifford, J. Cioslowski, B. B. Stefanov, G. Liu, A. Liashenko, P. Piskorz, I. Komaromi, R. L. Martin, D. J. Fox, T. Keith, M. A. Al-Laham, C. Y. Peng, A. Nanayakkara, M. Challacombe, P. M. W. Gill, B. Johnson, W. Chen, M. W. Wong, C. Gonzalez and J. A. Pople, Gaussian 03, Revision D.01, Gaussian, Inc., Wallingford CT, 2004 Search PubMed.
- A. D. Becke, J. Chem. Phys., 1993, 98, 5648–5652 CrossRef CAS.
- C. Lee, W. Yang and R. G. Parr, Phys. Rev. B: Condens. Matter Mater. Phys., 1988, 37, 785–789 CrossRef CAS.
- P. C. Hariharan and J. A. Pople, Theor. Chim. Acta, 1973, 28, 213–222 CrossRef CAS.
- M. M. Francl, W. J. Petro, W. J. Hehre, J. S. Binkley, M. S. Gordon, D. F. DeFrees and J. A. Pople, J. Chem. Phys., 1982, 77, 3654–3665 CrossRef CAS.
- V. Barone and M. Cossi, J. Phys. Chem. A, 1998, 102, 1995–2001 CrossRef CAS.
- M. Cossi and V. Barone, J. Chem. Phys., 2001, 115, 4708–4717 CrossRef CAS.
- N. M. O'Boyle and A. L. Tenderholt, J. Comput. Chem., 2008, 29, 839–845 CrossRef PubMed.
- L. Wang, W. Qin, X. Tang, W. Dou and W. J. Liu, J. Phys. Chem. A, 2011, 115, 1609–1616 CrossRef CAS PubMed.
- S. A. Lee, G. R. You, Y. W. Choi, H. Y. Jo, A. R. Kim, I. Noh, S.-J. Kim, Y. Kim and C. Kim, Dalton Trans., 2014, 43, 6650–6659 RSC.
- Y. W. Choi, G. J. Park, Y. J. Na, H. Y. Jo, S. A. Lee, G. R. You and C. Kim, Sens. Actuators, B, 2014, 194, 343–352 CrossRef CAS.
- S. C. Burdette, G. K. Walkup, B. Spingler, R. Y. Tsien and S. J. Lippard, J. Am. Chem. Soc., 2011, 123, 7831–7841 CrossRef.
- P. Job, Ann. Chim., 1928, 9, 113–203 CAS.
- R. Yang, K. Li, K. Wang, F. Zhao, N. Li and F. Liu, Anal. Chem., 2003, 75, 612–621 CrossRef CAS.
- F. Yu, L. J. Hou, L. Y. Qin, J. B. Chao, Y. Wang and W. J. Jin, J. Photochem. Photobiol., A, 2016, 315, 8–13 CrossRef CAS.
- J. Qin, Z. Yang and P. Yang, Inorg. Chim. Acta, 2015, 432, 136–141 CrossRef CAS.
- W.-H. Ding, D. Wang, X.-J. Zheng, W.-J. Ding, J.-Q. Zheng, W.-H. Mu, W. Cao and L.-P. Jin, Sens. Actuators, B, 2015, 209, 359–367 CrossRef CAS.
- Y.-K. Tsui, S. Devaraj and Y.-P. Yen, Sens. Actuators, B, 2012, 161, 510–519 CrossRef CAS.
- B. Bodenant, F. Fages and M.-H. Delville, J. Am. Chem. Soc., 1998, 120, 7511–7519 CrossRef CAS.
- A. Torrado, G. K. Walkup and B. Imperiali, J. Am. Chem. Soc., 1998, 120, 609–610 CrossRef CAS.
- R. M. Harrison, D. P. H. Laxen and S. J. Wilson, Environ. Sci. Technol., 1981, 15, 1378–1383 CrossRef CAS.
- D. Maity and T. Govindaraju, Eur. J. Inorg. Chem., 2011, 5479–5485 CrossRef CAS.
- D. Maity and T. Govindaraju, Chem. Commun., 2012, 48, 1039–1041 RSC.
Footnote |
| † Electronic supplementary information (ESI) available. See DOI: 10.1039/c5nj02334c |
| This journal is © The Royal Society of Chemistry and the Centre National de la Recherche Scientifique 2016 |

