Microwave assisted synthesis, characterization and thermoacoustical study of a β-naphthol-guanidine-formaldehyde copolymer resin†
Suraj D.
Kukade
*a,
Sunit Kumar
Singh
b,
P. V.
Tekade
a,
Ritesh R.
Naik
a and
S. V.
Bawankar
a
aDepartment of Chemistry, Jankidevi Bajaj College of Science, Wardha-442001, India. E-mail: surajdkukade142@gmail.com
bDepartment of Chemistry, Visvesvaraya National Institute of Technology, Nagpur-440010, India. E-mail: sunitkumarsingh279@gmail.com
First published on 16th November 2015
Abstract
The copolymer resin β-naphthol-guanidine hydrochloride-formaldehyde (β-NGF) has been synthesized by the condensation polymerization of β-naphthol and guanidine hydrochloride with formaldehyde in a 1![[thin space (1/6-em)]](https://www.rsc.org/images/entities/char_2009.gif) :
:![[thin space (1/6-em)]](https://www.rsc.org/images/entities/char_2009.gif) 1
1![[thin space (1/6-em)]](https://www.rsc.org/images/entities/char_2009.gif) :
:![[thin space (1/6-em)]](https://www.rsc.org/images/entities/char_2009.gif) 2 molar ratio of reactants in the presence of an acid catalyst under microwave irradiation. The synthesized copolymer has been characterized by spectral methods viz.1H-NMR, 13C-NMR, IR and UV-visible spectroscopy. The surface analysis has been done by SEM. The ultrasonic velocity, density and viscosity of the β-NGF copolymer in pure ethanol at different temperatures and concentrations have been measured. Based on the data obtained, various acoustical parameters like adiabatic compressibility, intermolecular free length, acoustic impedance, relaxation time, relative association and Gibb's free energy have been calculated. From the data of acoustical parameters, the intermolecular interactions between β-NGF and ethanol have been discussed.
2 molar ratio of reactants in the presence of an acid catalyst under microwave irradiation. The synthesized copolymer has been characterized by spectral methods viz.1H-NMR, 13C-NMR, IR and UV-visible spectroscopy. The surface analysis has been done by SEM. The ultrasonic velocity, density and viscosity of the β-NGF copolymer in pure ethanol at different temperatures and concentrations have been measured. Based on the data obtained, various acoustical parameters like adiabatic compressibility, intermolecular free length, acoustic impedance, relaxation time, relative association and Gibb's free energy have been calculated. From the data of acoustical parameters, the intermolecular interactions between β-NGF and ethanol have been discussed.
Introduction
In recent years, microwave techniques have been mainly applied for domestic, industrial and research purposes. Various synthetic reactions using microwave irradiation involve processes to prevent pollution and consume minimum amounts of materials as well as energy while producing little or no waste material. More recently, microwave-assisted organic synthesis, a new method, has been developed to obtain more efficient compounds in a short reaction time period.1,2 This method has been applied for many inorganic, organic and polymer syntheses.3–7 Various researchers have reported the application of microwave technology in terpolymer synthesis.8–10 Microwave irradiation has been applied in recent years for step-growth polymerizations and ring-opening polymerizations as well as radical polymerizations.11Copolymers are high molecular weight compounds composed of repeating structural units connected by covalent chemical bonds. They are widely used as adhesives, lubricants, coating materials, semiconductors, catalysts, ion exchangers, fire resistant materials and also show antibacterial activity.12–15
An ultrasonic study gives information about the nature of molecular interactions in solute–solvent and solvent–solvent mixtures. It is a non-destructive and very effective technique for the investigation of various thermodynamic parameters.16–18 Recently, these have also been used in medicinal, agricultural, industrial and solution chemistry.19,20 The measurement of ultrasonic velocity has been used in understanding the physico-chemical behaviour of a particular solute–solvent system present in a polymer solution.21,22 Ultrasonic velocity measurements are highly sensitive to molecular interactions and can be used to provide qualitative as well as quantitative information about the physical nature and strength of molecular interactions in solute–solvent mixtures.23,24 Variations in the ultrasonic velocity and related parameters with respect to different temperatures and concentrations are important to find out structural changes associated with interacting reactants present in the solution.25,26 Various researchers have reported the interaction present in different solute–solvent systems.27–30
It is revealed from a literature survey that studies on microwave synthesis of copolymers involving β-naphthol-guanidine hydrochloride-formaldehyde as monomers have not been reported so far. Therefore, it was planned to synthesize the copolymer and to study its thermoacoustical properties. In the present paper, the synthesized copolymer has been characterized by spectral methods viz.1H-NMR, 13C-NMR, IR and UV-visible spectroscopy, and surface analysis has been performed using SEM. The ultrasonic velocity, density and viscosity of the β-naphthol-guanidine hydrochloride-formaldehyde (β-NGF) copolymer resin in pure ethanol at different temperatures and concentrations have been measured. Based on the data obtained, various acoustical parameters like adiabatic compressibility, intermolecular free length, acoustic impedance, relaxation time, relative association and Gibb's free energy are calculated. The variation of these parameters with different temperatures and concentrations was found to be useful in understanding the nature of interactions between the components of a solution.
Experimental section
All the chemicals used as starting materials in the synthesis of the copolymer were of AR or chemically pure grade. Reaction was carried out in RAGA's Scientific Microwave System.Microwave assisted synthesis of the β-NGF copolymer resin
The β-NGF copolymer resin was synthesized by condensation polymerization of β-naphthol (0.01 mol) and guanidine hydrochloride (0.01 mol) with formaldehyde (0.02 mol) in the presence of 2 M HCl as a catalyst under microwave irradiation (900 W) for 4 minutes. The reaction mixture was then cooled and left overnight. A pink colour precipitate was obtained which was filtered and washed with cold water followed by hot water several times to remove unreacted monomers. Finally the β-NGF copolymer resin was air dried. The dried copolymer sample was then purified by dissolution in 8% NaOH and re-precipitation was carried out by drop-wise addition of 1![[thin space (1/6-em)]](https://www.rsc.org/images/entities/char_2009.gif) :
:![[thin space (1/6-em)]](https://www.rsc.org/images/entities/char_2009.gif) 1 (v/v) of HCl/water.
1 (v/v) of HCl/water.
Spectral analysis
The electronic absorption spectrum of the β-NGF copolymer resin in ethanol was recorded on a Bioera's UV-visible spectrophotometer in the region of 190–400 nm and the infrared spectrum was recorded on a Bruker ALPHA-E FTIR spectrometer in the region of 4000–400 cm−1. While the 1H-NMR and 13C-NMR spectra were recorded on a Bruker Avance II 400 NMR in CDCl3 as a solvent and TMS as a reference. The morphology of the synthesized copolymer resin was examined by SEM on a JSM-6390LV (JEOL) instrument.Thermoacoustical study of the β-NGF copolymer
Solutions with different concentrations (W/V%) of the β-NGF copolymer resin were prepared in pure ethanol as a solvent. The ultrasonic velocity (U) has been measured on a digital ultrasonic pulse echo velocity meter (Vi Microsystems Pvt. Ltd. Model VCT-70 at 2 MHz) with an accuracy of 0.1%. The viscosities (η) of the solutions were determined using a Ostwald's viscometer by calibrating with doubly distilled water with an accuracy of ±0.001 Pa s and the density (ρ) of these solutions was measured accurately using a 25 mL specific gravity bottle and a digital electronic balance with an accuracy of ±0.0001 g. The basic parameter U, η and ρ were measured at various concentrations i.e. 0.25, 0.50, 0.75 and 1% at 298 K, 303 K and 308 K. The various acoustical parameters were calculated from the U, η and ρ values using standard formulas (see the ESI†).21,24,25,28 Based on the data obtained, parameters such as adiabatic compressibility, intermolecular free length, acoustic impedance, relaxation time, relative association and Gibb's free energy have been calculated.Results and discussion
The polymer was synthesized using microwave assisted synthesis. The precipitated polymer product from the reaction mixture was filtered off, washed repeatedly with hot water and dried in a vacuum desiccator over anhydrous calcium chloride.Yield of the copolymer: 1.1959 g (39.9 wt%)
Melting point: 402.4 K.
The reaction route is shown in Scheme 1. The β-NGF copolymer resin is pink in colour, insoluble in cold and hot water but completely soluble in ethanol, methanol, diethyl ether, dimethyl formamide, dimethyl sulphoxide, chloroform, carbon tetrachloride, benzene, acetone, benzene, cyclohexane, 1,4-dioxane and petroleum ether.
Functional group analysis of the synthesized copolymer resin
The IR spectrum of the β-NGF copolymer resin provides useful information about the linkages and functional groups present in the copolymer resin (Fig. 1) and the data is summarized in Table 1.| Assignment | Observed band frequency (cm−1) | Expected band frequency (cm−1) | Ref. |
|---|---|---|---|
| Phenolic –OH stretch | 3319.78 | 3750–3300 | 9, 12, 13 and 31–35 |
| –NH stretch (imide) | 3500–3300 | 3500–3300 | 9, 12, 13 and 31–35 |
| –NH bend (imide) | 680 | 800–600 | 9, 12, 13 and 31–34 |
Aromatic C![[double bond, length as m-dash]](https://www.rsc.org/images/entities/char_e001.gif) C stretch C stretch |
1650–1450 | 1600–1450 | 9, 12, 13 and 31–35 |
| Phenolic C–O stretch | 1218.22 | 1410–1200 | 9, 12, 13 and 31–35 |
| Methylic bridge (–CH2) modes rock | 741 | 800–710 | 9, 12 and 13 |
| Methylic bridge (–CH2) modes bend | 1420 | 1485–1440 | 9, 12 and 13 |
| Methylic bridge (–CH2) modes wagging | 1320 | 1300–1200 | 9, 12 and 13 |
C![[double bond, length as m-dash]](https://www.rsc.org/images/entities/char_e001.gif) N (imines) N (imines) |
1601.40 | 1690–1600 | 9, 13 and 31–35 |
| ortho and para substituted benzene ring | 850–690 | 850–690 | 9, 12, 13 and 31–35 |
The broad band at 3319.78 cm−1 may be due to the intermolecular hydrogen bonded phenolic hydroxy groups (O–H stretching). The sharp band at 1218.22 cm−1 may be due to C–O stretching. The band in the region 3500–3300 cm−1 may be due to N–H stretching (symm. & asymm.). The band at 3037.26 cm−1 may be due to aromatic C–H stretching and the band appearing in the region of 1650–1450 cm−1 may be due to C![[double bond, length as m-dash]](https://www.rsc.org/images/entities/char_e001.gif) C stretching, which are the characteristic features of the aromatic region. The band appearing at 1485–1440 cm−1 is attributed due to C–H def. in –CH2–. The band at 1690–1470 cm−1 may be due to the –C
C stretching, which are the characteristic features of the aromatic region. The band appearing at 1485–1440 cm−1 is attributed due to C–H def. in –CH2–. The band at 1690–1470 cm−1 may be due to the –C![[double bond, length as m-dash]](https://www.rsc.org/images/entities/char_e001.gif) N stretching (imines) and the band at 850–690 cm−1 is of the ortho and para substituted benzene ring.
N stretching (imines) and the band at 850–690 cm−1 is of the ortho and para substituted benzene ring.
Types of unsaturation in the synthesized copolymer resin
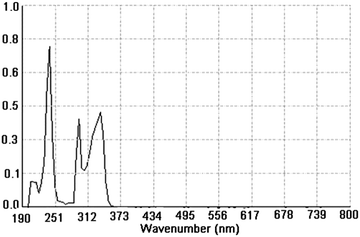
The UV-visible absorption spectrum of the β-NGF copolymer resin was recorded in 95% ethanol. (Fig. 2) This resin gives rise to four characteristic bands in the region of 190–400 nm. The absorption band in the region near 195–210 nm may be due to n–σ* transitions which are due to the C–O of the phenolic OH group. The band in the region of 220–251 nm indicates the π–π* transitions in aromatic C![[double bond, length as m-dash]](https://www.rsc.org/images/entities/char_e001.gif) C as well as in the C
C as well as in the C![[double bond, length as m-dash]](https://www.rsc.org/images/entities/char_e001.gif) N group while the characteristic band between 280–373 nm may be due to n–π* transitions in the C
N group while the characteristic band between 280–373 nm may be due to n–π* transitions in the C![[double bond, length as m-dash]](https://www.rsc.org/images/entities/char_e001.gif) N group. This shift in the absorption band towards longer wavelength may be due to the presence of the auxochrome group (C
N group. This shift in the absorption band towards longer wavelength may be due to the presence of the auxochrome group (C![[double bond, length as m-dash]](https://www.rsc.org/images/entities/char_e001.gif) NH group) present in the copolymer resin. This observation is in good harmony with most of the probable structures of such types of copolymers.12,13,34,35
NH group) present in the copolymer resin. This observation is in good harmony with most of the probable structures of such types of copolymers.12,13,34,35
NMR spectra (1H-NMR & 13C-NMR) of the copolymer resin
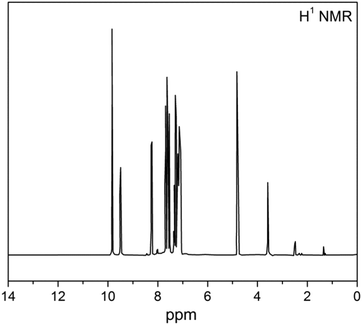
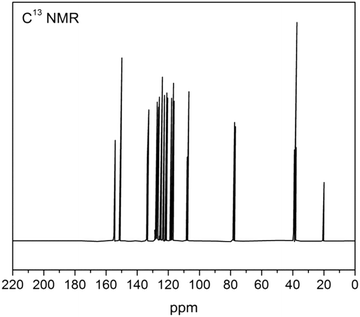
The 1H-NMR spectrum of the β-NGF copolymer resin is depicted in Fig. 3 and the data are tabulated in Table 2. The signals in the region δ 7–8.5 ppm may be due to the aromatic ring protons (Ar–H) (intermolecular hydrogen bonding). A broad signal appearing in the region δ 9.5–10 ppm corresponds to the phenolic (–OH) proton. The signal appearing at δ 3.5 may be due to the Ar–CH2–N moiety. The signal appearing in the region δ 4.8–5 ppm is due to –NH– bridging and at 7.1 ppm may be due to the C![[double bond, length as m-dash]](https://www.rsc.org/images/entities/char_e001.gif) NH proton (imine). The 13C-NMR spectrum of the β–NGF copolymer resin is shown in Fig. 4. The peaks appeared in the region 120–140 ppm are attributed to the aromatic carbons present in the β-naphthol ring.34,35 The peak appearing at 80 ppm is assigned to the methylene carbon of the NH–CH2 bridge and the signal appearing near 160 ppm is due to the C
NH proton (imine). The 13C-NMR spectrum of the β–NGF copolymer resin is shown in Fig. 4. The peaks appeared in the region 120–140 ppm are attributed to the aromatic carbons present in the β-naphthol ring.34,35 The peak appearing at 80 ppm is assigned to the methylene carbon of the NH–CH2 bridge and the signal appearing near 160 ppm is due to the C![[double bond, length as m-dash]](https://www.rsc.org/images/entities/char_e001.gif) N moiety present in the resin.
N moiety present in the resin.
| Nature of proton assigned in the NMR spectrum | Observed chemical shift (δ) in terpolymer (ppm) | Expected chemical shift (δ) (ppm) | Ref. |
|---|---|---|---|
| Aromatic (Ar–H) | 7–8.5 | 6–9 | 9, 12, 13 and 31–34 |
| Phenolic (Ar–OH) | 9.5–10 | 4–12 | 9, 12, 13 and 31–34 |
C![[double bond, length as m-dash]](https://www.rsc.org/images/entities/char_e001.gif) NH proton NH proton |
7.1 | 6.5–8 | 9, 12, 13, 34 and 35 |
| Ar–CH2–N moiety | 3.5 | 2.5–4.8 | 9, 12, 13, 34 and 35 |
| –NH bridging | 4.8–5 | 5–8 | 9, 12, 13, 34 and 35 |
Surface analysis of the copolymer resin
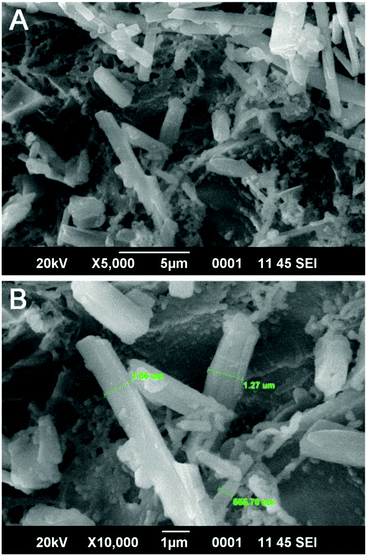
The surface features of the copolymer resin were clearly examined through a scanning electron microscope. (Fig. 5) The SEM micrographs were recorded at magnifications of 5000× and 10![[thin space (1/6-em)]](https://www.rsc.org/images/entities/char_2009.gif) 000×. From the micrographs, it is observed that the copolymer resin had an irregular shaped structure with rod shaped particles impregnated over it. This phase separation may be due to formation of only the β-naphthol-formaldehyde polymer phase which may form in minor quantities as a side product in the terpolymer reaction. The rod shaped particles had a width ranging from 0.5 μm to 1.3 μm.
000×. From the micrographs, it is observed that the copolymer resin had an irregular shaped structure with rod shaped particles impregnated over it. This phase separation may be due to formation of only the β-naphthol-formaldehyde polymer phase which may form in minor quantities as a side product in the terpolymer reaction. The rod shaped particles had a width ranging from 0.5 μm to 1.3 μm.
Thermoacoustical study of the β-NGF copolymer resin
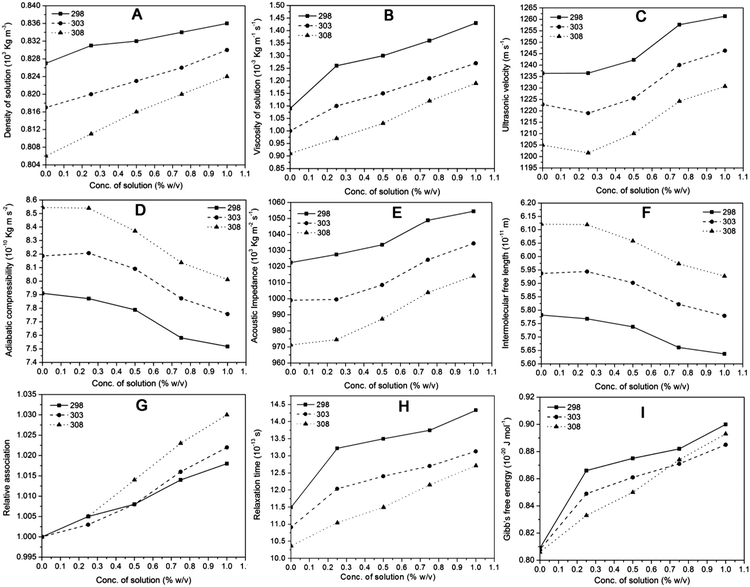
The measured values of the ultrasonic velocity, viscosity, density and related acoustical parameters like adiabatic compressibility, intermolecular free length, acoustic impedance, relaxation time, relative association and Gibb's free energy of the β-NGF copolymer resin in ethanol with different concentrations and temperatures are incorporated in table No. 1, 2 and 3 (as shown in the ESI†) while the variation trends of these parameters are shown in Fig. 6. The variations of the acoustical parameters of the β-NGF copolymer resin were studied in ethanol. The results are discussed in terms of various molecular interactions present in the solution. As the concentration of solution increases, the values of solution properties like density and viscosity increased linearly while the values of ultrasonic velocity, acoustical impedance and relative association increased continuously. The values of derived parameters like adiabatic compressibility and intermolecular free length decreased continuously, while relaxation time and Gibb's free energy increased continuously with the increase in concentration. It is seen that these parameters are temperature dependent because change in temperature affects the values of various solution parameters. As the temperature of the system increases the parameters like density, viscosity, ultrasonic velocity, acoustical impedance and relaxation time decrease while adiabatic compressibility and intermolecular free length increase. But irregular trends are observed in the values of relative association and Gibb's free energy.It has been observed that ultrasonic velocity increases continuously with the increase in the % concentration of solution but decreases with the increase in temperature. This ascending value of ultrasonic velocity with concentration may be due to an increase in the number of molecules of the solute. As a result, there is a spontaneous transfer of sound energy from one molecule to another.21 The ultrasonic velocity, density and viscosity are dependent on the concentration of the solution and the temperature. It has been noticed that by increasing the temperature, there is a reduction in the density, viscosity and ultrasonic velocity of solution [Fig. 6A–C]. The decrease in the density and viscosity indicates the decrease in the intermolecular forces between solute and solvent molecules as well as weakening of the molecular association.21 The values of density and viscosity show increasing behaviour with respect to the concentration of solution varying from 0.25% to 1% which may be due to an increase in the number of ions of solute in solution and aggregation of solute molecules supporting strong solute–solvent interaction at that particular concentration.16,20
Similar trends are also found in the value of acoustical impedance i.e. with the increase in the % concentration of the copolymer solution, the value of acoustical impedance increases but as the temperature increases, the value of acoustical impedance decreases while the value of relative association increases with an increase in the % concentration of solution and shows irregular behaviour with increase in temperature as shown by Fig. 6E and H. Relaxation time is the time for a solute molecule to relax during interaction in solution and it is found to be in the range of 10−13 second. Also, there is an increase in relaxation time with the increase in polymer concentration and a decrease in relaxation time with the increase in temperature (Fig. 6G), which may be due to the hydrophobic nature of interacting polymer molecules and strong interactions between solute–solvent molecules.21,24
In Fig. 6D and F, it is clearly shown that the values of adiabatic compressibility and intermolecular free length decrease continuously with the increase in the concentration of solution and as the temperature increases the values of the above parameters follow an ascending order. The decrease in the value of the adiabatic compressibility and intermolecular free length with respect to an increase in the concentration indicate the strong solute–solvent interactions. At the same time, the increase in the value of adiabatic compressibility and intermolecular free length with respect to an increase in temperature indicate that there is breaking of bonds formed between solute–solvent molecules.20,21 These observations indicate the hydrogen bonding interactions between solute–solvent molecules which are also expected due to the presence of phenolic –OH, amine –NH– and imine ![[double bond, length as m-dash]](https://www.rsc.org/images/entities/char_e001.gif) NH groups in the polymer molecules.
NH groups in the polymer molecules.
The relative association depends on the solvation of solute molecules and breaking up of the solvent structure by the addition of solute. The increase of the relative association with concentration (Fig. 6H) suggests that solvation of solutes is effective over the breaking of the solvent structures.36 The positive Gibb's free energy reveals closer packing of the molecules due to the H-bonding of unlike molecules in the solution (Fig. 6I).37 The increase in Gibb's free energy with increasing polymer concentration indicates increased packing of solute–solvent molecules, which is adversely affected by the increase in temperature of the solution. These trends of Gibb's free energy support the stronger hydrogen bonding interactions between the polymer and solvent (ethanol) molecules.
Conclusion
In the present study, the copolymer resin β-naphthol-guanidine hydrochloride-formaldehyde (β-NGF) was synthesized from β-naphthol and guanidine hydrochloride with formaldehyde by using microwave irradiation. The synthesized resin was purified and characterized by using different spectral methods while surface analysis has been done using scanning electron microscopy. The overall techniques confirmed the expected structure of the resin. The resin was soluble in different organic solvents. The surface analysis confirmed that the resin has an irregular shaped structure with rod shaped particles impregnated in it.The ultrasonic velocity, viscosity and density of the β-NGF copolymer resin in ethanol along with related acoustical parameters such as adiabatic compressibility, intermolecular free length, acoustic impedance, relaxation time, relative association and Gibb's free energy at different concentration and temperature were determined. The concentration and temperature dependence study of the acoustical parameters provides a wealth of information regarding the strength of molecular interaction present in the solution. The increase in ultrasonic velocity and decrease in intermolecular free length with the increase in concentration suggest strong hydrogen bonding interactions but increasing temperature is responsible for a decrease in the ultrasonic velocity and an increase in the intermolecular free length. This indicates the breaking of strong hydrogen bonding interactions formed between solute–solvent molecules.
Acknowledgements
The authors wish to express their sincere thanks to SAIF, Punjab University, Chandigarh and SAIF, STIC, Cochin for their services for spectral analysis.References
- V. K. Ahluwalia and M. Kidwai, New Trends in Green Chemistry, Anamaya Publishers, New Delhi, 2nd edn, 2006 Search PubMed.
- V. K. Ahluwalia and R. Aggarwal, Organic Synthesis: Special Techniques, Narosa Publishing House, New Delhi, 2nd edn, 2007 Search PubMed.
- R. B. Nasir Baig and R. S. Verma, Chem. Soc. Rev., 2012, 41, 1559 RSC.
- J. Gising, L. R. Odell and M. Larhed, Org. Biomol. Chem., 2012, 10, 2713 CAS.
- A. Sharma, P. Appukkuttan and E. V. Eycken, Chem. Commun., 2012, 48, 1623 RSC.
- M. C. Bagley, J. E. Dwyer, M. D. Beltran Molina, A. W. Rand, H. L. Rand and N. C. O. Tomkinson, Org. Biomol. Chem., 2015, 13, 6814 CAS.
- K. Sharma, B. S. Kaith, V. Kumar, V. Kumar, S. Som, S. Kalia and H. C. Swart, RSC Adv., 2013, 3, 25830 RSC.
- B. A. Shah, A. V. Shah and A. J. Navik, Iran. Polym. J., 2012, 21(9), 569 CrossRef CAS.
- S. D. Kukade, R. R. Naik and S. V. Bawankar, Orbital: Electron. J. Chem., 2014, 6(4), 240 Search PubMed.
- R. S. Azarudeen, M. A. Riswan Ahmed, D. Jeyakumar and A. R. Burkanudeen, Iran. Polym. J., 2009, 18(10), 821 CAS.
- D. Jain, J. Maheshwari, N. Rathore and S. N. Paliwal, Rasayan J. Chem., 2012, 5(4), 445 CAS.
- P. E. P. Michael, P. S. Lingala, H. D. Juneja and L. J. Paliwal, J. Appl. Polym. Sci., 2004, 92, 2278 CrossRef CAS.
- P. E. P. Michael, J. M. Barbe, H. D. Juneja and L. J. Paliwal, Eur. Polym. J., 2007, 43, 4995 CrossRef CAS.
- M. M. Jadhao, S. Kumar, L. J. Paliwal, N. S. Bhave and S. Alam, J. Appl. Polym. Sci., 2010, 118(4), 1969 CAS.
- N. S. P. Chauhan, R. Ameta and S. C. Ameta, J. Appl. Polym. Sci., 2011, 122(1), 573 CrossRef CAS.
- S. Ravichandran and K. Ramanathan, Polym. Chem., 2010, 1, 698 RSC.
- E. Zorebski, M. Geppert-Rybczynska and B. Maciej, J. Chem. Eng. Data, 2010, 55, 1025 CrossRef CAS.
- M. V. Rathnam, K. Jain, S. Mankumare and M. S. S. Kumar, J. Chem. Eng. Data, 2010, 55, 3929 CrossRef CAS.
- R. R. Naik, S. V. Bawankar and V. M. Ghodki, J. Polym. Biopolym. Phys. Chem., 2015, 3(1), 1 Search PubMed.
- M. S. Santosh and D. Krishna Bhat, Ind. Eng. Chem. Res., 2010, 49, 11848 CrossRef CAS.
- K. D. Umaley, G. B. Pethe and A. S. Aswar, Russ. J. Phys. Chem. B, 2013, 7(1), 11 CrossRef CAS.
- P. S. Agrawal, M. S. Wagh and L. J. Paliwal, Arch. Appl. Sci. Res., 2011, 3(2), 29 CAS.
- V. S. Prasad, E. Rajagopal and N. Manohara Murthy, J. Solution Chem., 2009, 38(12), 1601 CrossRef.
- M. K. Praharaj, A. Satapathy, P. Mishra and S. Mishra, J. Theor. Appl. Phys., 2013, 7(23), 1 Search PubMed.
- B. D. Bhuva and P. H. Parsania, J. Solution Chem., 2011, 40(4), 719 CrossRef CAS.
- R. R. Naik, S. V. Bawankar, P. V. Tekade and O. A. Mahodaya, Russ. J. Phys. Chem. A, 2015, 89(1), 152 CrossRef CAS.
- S. Thirumaran, J. Earnest Jayakumar and V. P. Chitra, Int. J. Chem., 2014, 1(5), 13 Search PubMed.
- S. Punitha, R. Uvarani, A. Panneerselvam and S. Nithiyanantham, J. Saudi Chem. Soc., 2014, 18, 657 CrossRef CAS.
- D. P. Singh and A. Upmanyu, J. Polym. Biopolym. Phys. Chem., 2014, 2(4), 73 Search PubMed.
- R. R. Naik and S. V. Bawankar, Orbital: Electron. J. Chem., 2014, 6(2), 13 CAS.
- Y. R. Sharma, Elementary Organic Spectroscopy: Principal and Chemical Applications, S. Chand and Company Ltd., New Delhi, 5th edn, 2011 Search PubMed.
- R. M. Silverstein and G. C. Bassler, Spectroscopic Identification of Organic Compounds, Wiley, New York, 2nd edn, 1969 Search PubMed.
- W. Kemp, Organic Spectroscopy, Macmillan, Hong Kong, 3rd edn, 1975 Search PubMed.
- D. L. Pavia, G. M. Lampman, G. S. Kriz and J. R. Vyvyan, Spectroscopy, BROOKS/COLE, CENGAGE Learning, India edn, 2008 Search PubMed.
- H. Kaur, Instrumental Methods of Chemical Analysis, Pragati Prakashan, Meerut, 5th edn, 2009 Search PubMed.
- P. Agrawal and M. L. Narwade, Indian J. Chem., 2003, 42A, 1047–1049 CAS.
- A. N. Kannappan and R. Palani, Indian J. Pure Appl. Phys., 2007, 45, 573–579 CAS.
Footnote |
| † Electronic supplementary information (ESI) available. See DOI: 10.1039/c5nj02184g |
| This journal is © The Royal Society of Chemistry and the Centre National de la Recherche Scientifique 2016 |


