DOI:
10.1039/C5NJ02120K
(Paper)
New J. Chem., 2016,
40, 136-143
Niobate nanoscroll composite with Fe2O3 particles under moderate conditions: assembly and application research†
Received
(in Montpellier, France)
10th August 2015
, Accepted 8th October 2015
First published on 13th October 2015
Abstract
An Fe2O3/Nb6O17 nanoscroll composite was successfully assembled by the exfoliation-restacking method under moderate conditions. The as-prepared samples were characterized by X-ray powder diffraction (XRD), laser Raman spectroscopy (LRS), field emission scanning electron microscopy (FESEM), high-resolution transmission electron microscopy (HRTEM), N2 adsorption–desorption measurements, thermo-gravimetric analysis, and UV-visible diffuse reflectance spectroscopy (UV-vis DRS). The results show that the nanoscroll composite has a larger specific surface area (114 m2 g−1), stronger spectral response and excellent photodegradation activities for MB under visible light irradiation. There is an obvious interaction between the host niobate nanoscrolls and guest oxide Fe2O3 nanoparticles. The Fe2O3 nanoparticles are crosslinked to the niobate nanoscroll surface as proven by a blue-shifted Raman vibration at 953 cm−1 and 897 cm−1 associated with terminal Nb–OH groups.
1. Introduction
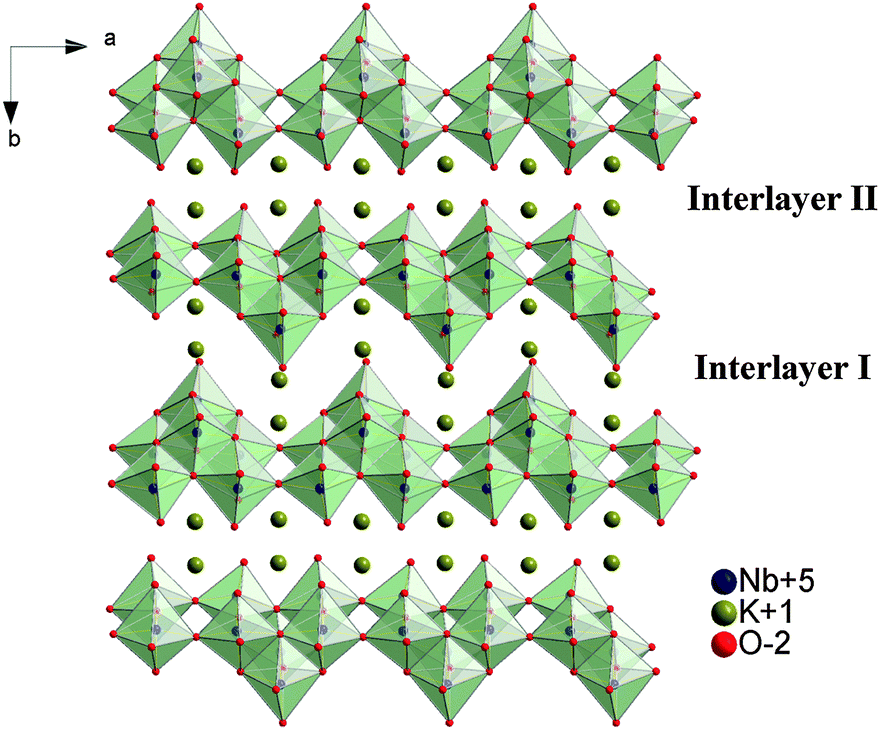
Layered compounds, a new type of photocatalytic material, have immense applications. Due to the unique layered structure and exfoliated nature, they have also been widely used in construction composites as a well support, especially layered niobate and titanoniobate.1–6 K4Nb6O17 (structure shown in Fig. 1), one of the earliest researched layered photocatalysts, is mostly employed as a well support to fabricate composite photocatalysts7–10 due to a wide band gap. Owing to the nature of nanosheets to form nanoscrolls,11 namely the asymmetrical top and bottom faces in each layer, various nanoscroll composites were fabricated. These mesoporous nanoscroll composites possess obviously higher photocatalytic activities than guest oxide nanoparticles or host layered niobates alone. Therefore, they become excellent photocatalytic functional materials for photodegradation of organic pollutants. Now, some guest nanoparticles are used to fabricate mesoporous niobate nanoscroll composites, such as Co, Ag, Rh2O3, CdTe, Fe3O4, Au–Fe3O4, CuO, Pt, IrOx, etc.12–19 Less attention has been paid to investigate the assembly mechanism between the host niobate and guest nanoparticles. Exfoliation-restacking technology, usually utilized to prepare composite materials with moderate preparation conditions, is an excellent approach to construct new photocatalytic materials and enhance their photocatalytic efficiency via broadening the photo-absorption region and effectively separating photo-generated electrons and holes. Fe2O3 is a narrow band gap semiconductor with a band gap energy of 2.2 eV and it can be used as an ideal guest material to prepare photocatalysts with a visible light response.20 To the authors' knowledge, the performance of nanoscroll composites Fe2O3/Nb6O17 prepared by the exfoliation-restacking method has been rarely explored. The assembly mechanism of niobate nanoscrolls with oxide nanoparticles has been rarely reported so far.
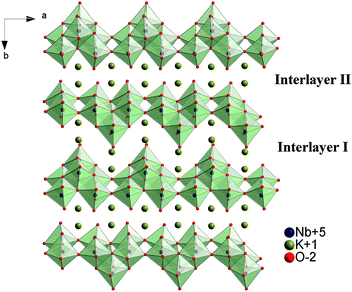 |
| | Fig. 1 Structure diagram of K4Nb6O17. | |
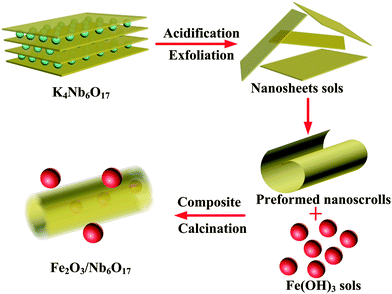
In the present study, the layered material K4Nb6O17 was prepared by a solid state reaction method, and Nb6O174− nanosheet sols were obtained by ion exchange and exfoliation.16 Fe2O3 was employed as the guest oxide particles to fabricate niobate nanoscroll composites using exfoliation-restacking technology under moderate conditions, and their assembly mechanism was proposed. The photocatalytic activities of the as-prepared composites Fe2O3/Nb6O17 were evaluated by the photodegradation of the organic dye methylene blue in an aqueous solution.
2. Experimental
2.1 Preparation of samples
The precursor K4Nb6O17 was synthesized by heating a K2CO3 (AR, Sinopharm Chemical Reagent Co., Ltd) and Nb2O5 (2.5 N, Sinopharm Chemical Reagent Co., Ltd) mixture with a mole ratio of 2.3![[thin space (1/6-em)]](https://www.rsc.org/images/entities/char_2009.gif) :3 in air at 1100 °C for 24 h. The as-obtained powder was washed with deionized water and then dried at 80 °C for 10 h. H4Nb6O17 was prepared by a proton exchange process, which mixes 1 g K4Nb6O17 with a 30 mL 6 mol L−1 HNO3 (AR, Sinopharm Chemical Reagent Co., Ltd) aqueous solution at 333 K for a week and renews the acid solution every 24 h. Niobate nanosheet sols were obtained via the following procedure: 1 g H4Nb6O17 powder and 200 mL deionized water were added to a beaker flask, and the pH of the suspension was adjusted to 9.5–10 with 25% tetrabutylammonium hydroxide aqueous solution (N/A, Accela ChemBio Co., Ltd). Then the mixture was oscillated at 45 °C for 3 days. Finally, the suspension was centrifugated at 8000 rpm to separate the nanosheet sols from the unexfoliated H4Nb6O17 powders.
:3 in air at 1100 °C for 24 h. The as-obtained powder was washed with deionized water and then dried at 80 °C for 10 h. H4Nb6O17 was prepared by a proton exchange process, which mixes 1 g K4Nb6O17 with a 30 mL 6 mol L−1 HNO3 (AR, Sinopharm Chemical Reagent Co., Ltd) aqueous solution at 333 K for a week and renews the acid solution every 24 h. Niobate nanosheet sols were obtained via the following procedure: 1 g H4Nb6O17 powder and 200 mL deionized water were added to a beaker flask, and the pH of the suspension was adjusted to 9.5–10 with 25% tetrabutylammonium hydroxide aqueous solution (N/A, Accela ChemBio Co., Ltd). Then the mixture was oscillated at 45 °C for 3 days. Finally, the suspension was centrifugated at 8000 rpm to separate the nanosheet sols from the unexfoliated H4Nb6O17 powders.
The Fe(OH)3 sols were obtained by hydrolyzing the FeCl3 (AR, Sinopharm Chemical Reagent Co., Ltd) aqueous solution. The FeCl3 solution was added dropwise to boiling water, boiled for 2–3 minutes after completion of the dropwise addition and then purified with a semipermeable membrane (artificial collodion membrane). Then the Fe(OH)3 sols were slowly dropped into the niobate nanosheet sols, with an Fe/Nb mole ratio of 1:1. After that, the suspension was oscillated continuously at room temperature for 12 h, and 0.5 mol L−1 HNO3 was slowly added until precipitation was completed. After aging for 48 h, the precipitate was separated by centrifugation and washed with ethanol and deionized water, and dried under vacuum at 60 °C. The sample before calcination is assigned as B-Fe2O3/Nb6O17 and the sample after calcination in the resistance oven for 2 h at 400 °C is assigned as A-Fe2O3/Nb6O17. For comparison, pure Fe2O3 particles were prepared by drying and calcining the Fe(OH)3 sols at 400 °C for 2 h, respectively. The nanoscroll aggregates (assigned as NS-H4Nb6O17) were obtained by dropwise adding 0.5 mol L−1 HNO3 to the niobate nanosheet sols, then washing with deionized water and drying at 60 °C for 48 h.
2.2 Characterization of samples
The X-ray diffraction (XRD) patterns were recorded using an XD-3 diffractometer (Beijing Purkinje General Instrument Co., Ltd) with curved graphite-monochromated Cu-Kα radiation (λ = 1.5406 Å) at 40 kV and 30 mA at room temperature. The laser Raman spectra were obtained on a Confocal Raman Microscope (InVia Reflex Spectrometer System, Renishaw) with a 785 nm wavelength laser source. The UV-vis diffuse reflectance spectra were determined using a TU-1901 UV-visible diffuse reflectance spectrometer (Beijing Purkinje General Instrument Co. Ltd) equipped with an integrated sphere using BaSO4 as the reference. The FESEM images were obtained by a Hitachi S-4800 field emission scanning electron microscope (Hitachi American Ltd) with an acceleration voltage of 25 kV. The HRTEM measurement was performed using a JEOL JEM-2100 instrument that operated at an accelerating voltage of 200 kV with an EDAX Genesis energy-dispersive spectroscopy (EDS) system. The TG-DTA curves were measured using SDT2960 Simultaneous DSC-TGA (TA Instrument, America) with a heating rate of 10 °C min−1 under nitrogen atmosphere. Nitrogen adsorption–desorption isotherms were obtained on an ASAP 2020 (Micromeritics Instrument, America) at liquid nitrogen temperature using nitrogen gas as the adsorbate, in which the samples were degassed at 100 °C for 24 h in flowing N2 prior to the measurements.
2.3 Photocatalytic activity test
The photocatalytic activities of the as-prepared samples were evaluated by the photodegradation of organic dye methylene blue (MB, BS, Sinopharm Chemical Reagent Co., Ltd) aqueous solution under visible light irradiation. A 300 W Xe lamp with a 400 nm cut-off filter was used as a light source. Methylene blue aqueous solutions (10 mg L−1, 200 mL) and the as-prepared photocatalyst (20 mg) were mixed in a quartz reactor. The mixtures were oscillated under dark conditions for 30 min to ensure adsorption equilibrium prior to light irradiation and kept under the same external conditions before and during light irradiation. 3 mL mixtures were sampled at a given interval, and centrifugated to remove the photocatalyst at 9000 rpm. The supernatant was analyzed based on the absorption band maximum (664 nm) using a Shimadzu UV-2550 spectrometer.
3 Results and discussion
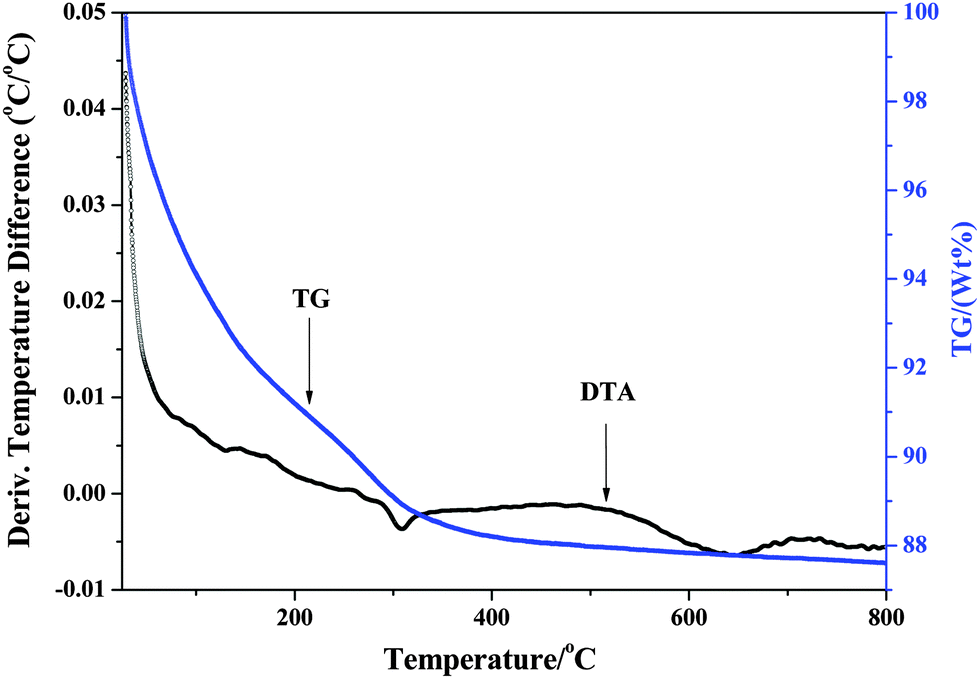
3.1 Thermal analysis of composites
Thermal analysis technology was used to investigate the thermal stability of the as-prepared materials. The TG-DTA curves of B-Fe2O3/Nb6O17 are shown in Fig. 2. The total weight loss of the B-Fe2O3/Nb6O17 nanocomposite is 12.5%. The weight loss below 200 °C is ca. 9% with an endothermic peak at 132 °C, which is attributed to the removal of the physically adsorbed water. In the DTA curve an obvious endothermic peak at 316 °C is existed which may be caused by the removal of bound water of the interlayer. Taking into consideration that no obvious fluctuation was observed at 400–500 °C in the DTA curve, dehydroxylation and dehydration of Fe(OH)3 sols and the removal of crystal water or constitution water of the support nanoscrolls may be occurred in the meanwhile. Beyond 600 °C, there appears no distinct weight loss. An exothermic peak around 700 °C may have arisen from the structure collapse. So the calcination temperature for preparing the Fe2O3/Nb6O17 composite is determined at 400 °C for 2 h with a low heating rate of 2 °C min−1.
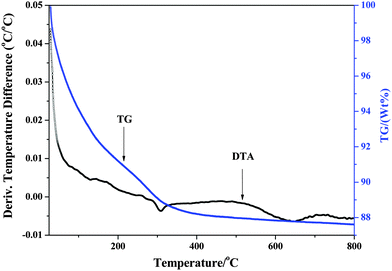 |
| | Fig. 2 TG-DTA curves of composites before calcination. | |
3.2 Structure and morphology characteristics of the as-prepared samples
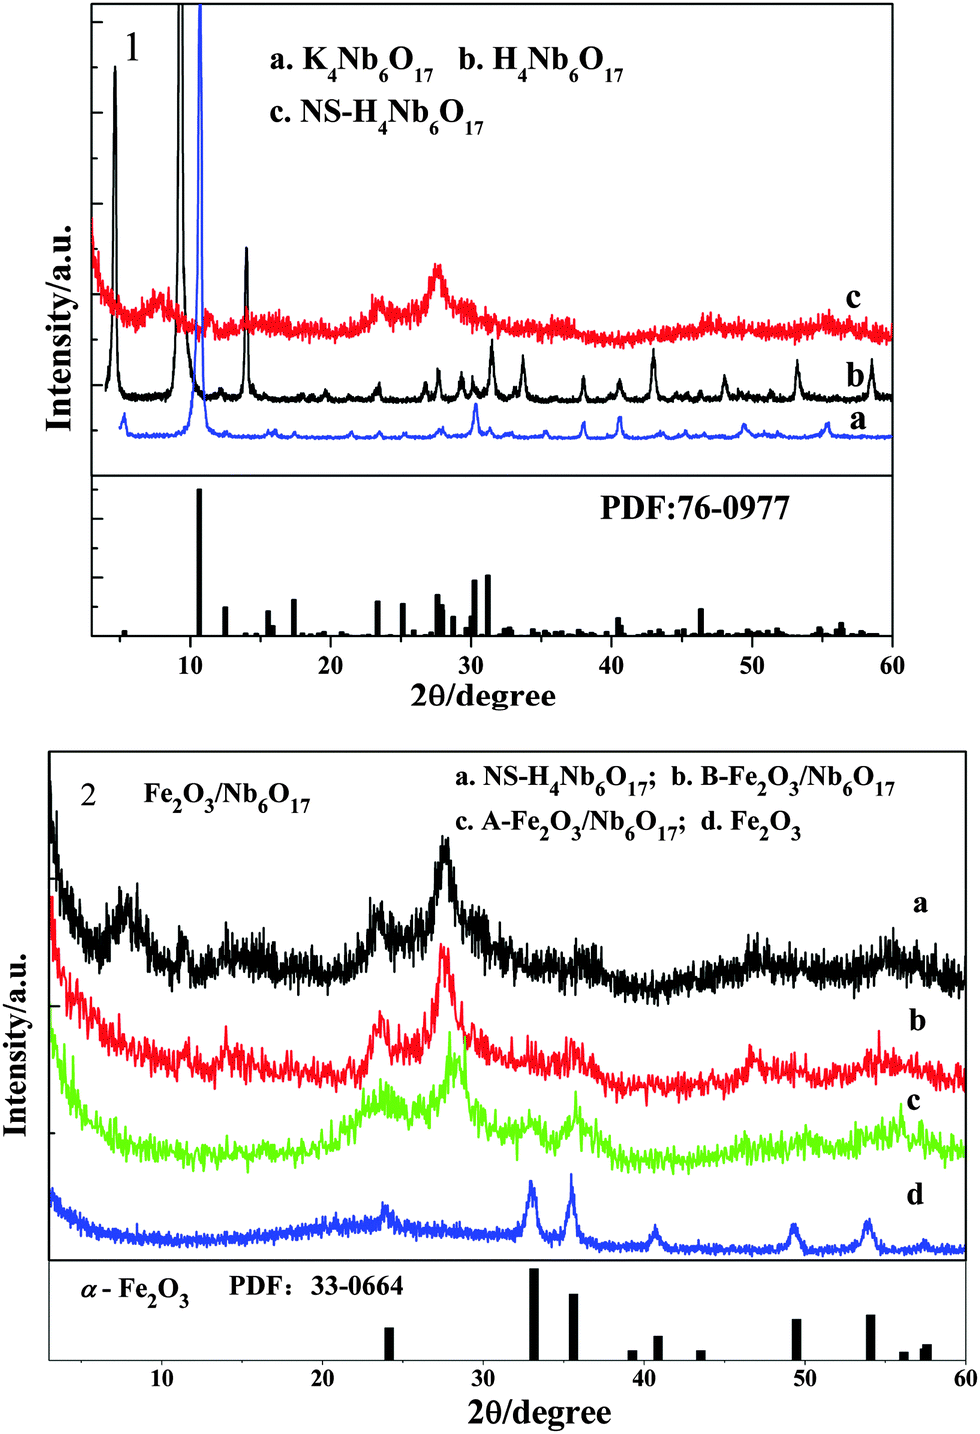
Fig. 3 shows the XRD patterns of the as-prepared samples. For reference, K4Nb6O17 and H4Nb6O17 were characterized by XRD. The XRD pattern of the K4Nb6O17 sample is well matched with the standard spectrum of K4Nb6O17 (JCPDS 76-0799). The as-prepared K4Nb6O17 sample possesses a well-ordered layered orthorhombic phase structure. The diffraction peaks of 2θ = 5.33° and 10.66° belong to the (020) and (040) crystal planes, respectively. The d-spacing of the (040) crystal plane is 0.83 nm using the Bragg equation λ = 2dsinθ. After ion exchange, due to the existence of H3O+ in the interlayer, the (020) plane and (040) plane are shifted towards 4.67° and 9.33° from 5.33° and 10.66°, respectively. After exfoliation, the crystallinity of NS-H4Nb6O17 descends evidently with the peak weakening and broadening, and the peaks of the (020) plane and (040) plane disappeared, indicating that the layered structure is absent. The stronger peaks at 23.4° and 27.6° belong to the (220) plane and (260) plane. From the B-Fe2O3/Nb6O17 pattern, one can find the diffraction peaks at 2θ = 32.6° and 35.34°, which are the characteristic peaks of α-Fe2O3 (PDF: 33-0664), indicating that the as-prepared Fe(OH)3 sols have been partially crystallized into Fe2O3 crystals in the composite before it is calcinated. After B-Fe2O3/Nb6O17 was calcinated, the intensities of the characteristic peaks of Fe2O3 are obviously enhanced, and the corresponding peak positions are shifted towards 32.9° and 35.74°, respectively. The average particle size of Fe2O3 before and after calcination is 2.17 nm and 4.44 nm, respectively, using the Debye–Scherrer equation D = kλ/Bcosθ. Considering the linear broadening caused by the instrument, the actual particle size of Fe2O3 is larger than the calculated value.
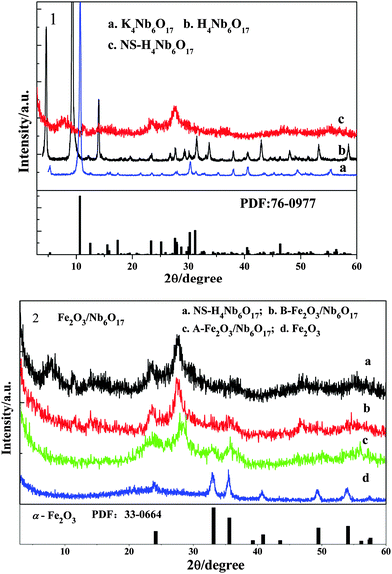 |
| | Fig. 3 X-ray diffraction patterns of the as-prepared samples. | |
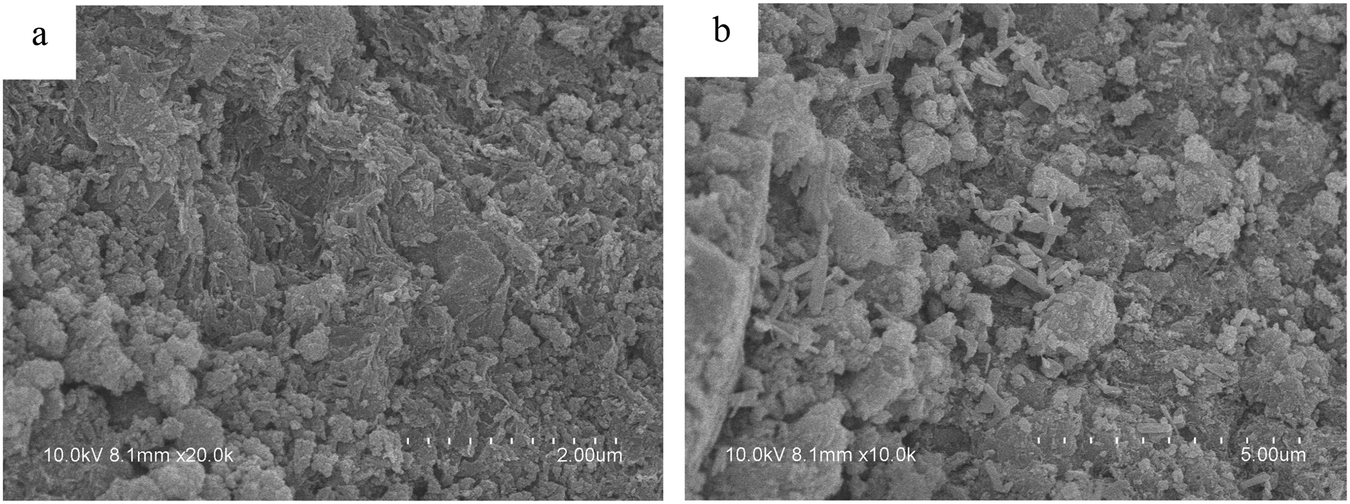
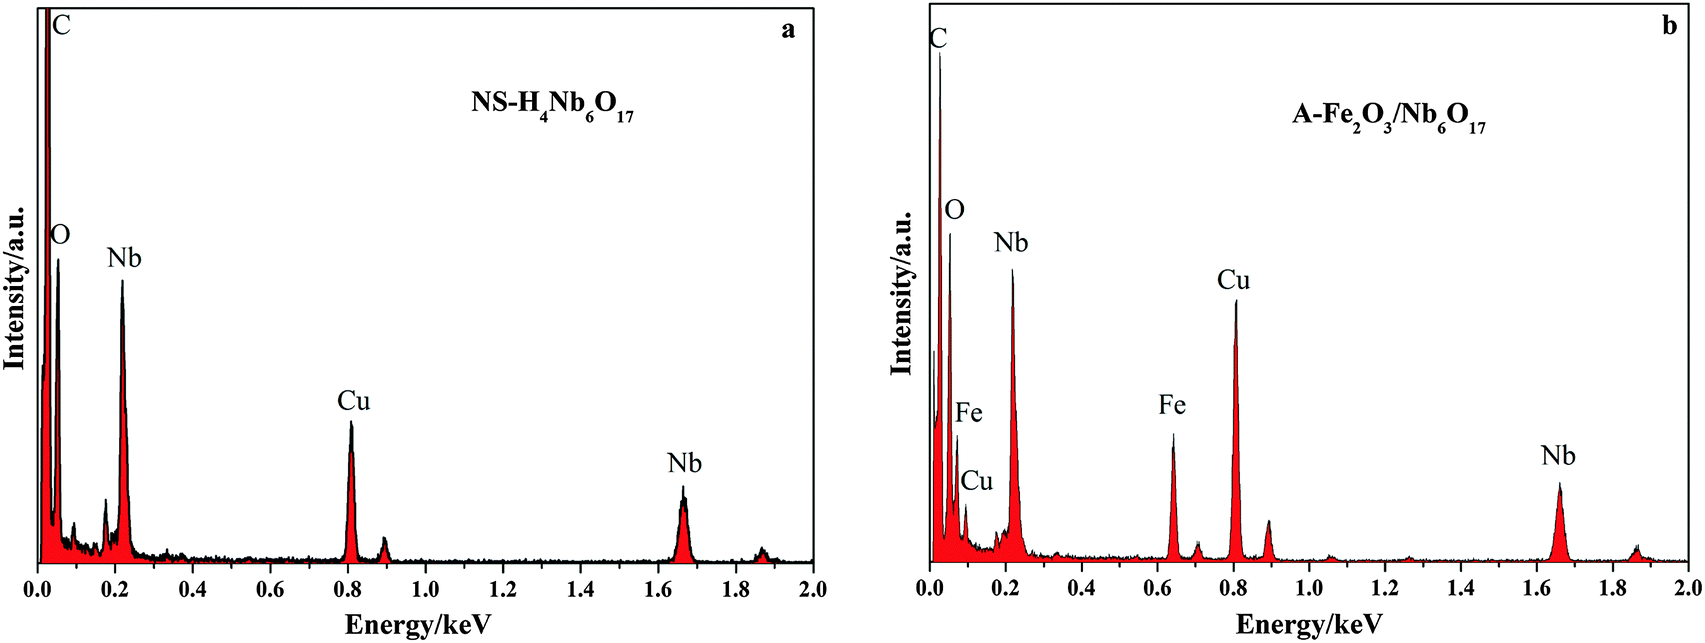
The morphology of the as-prepared samples was studied by FESEM and HRTEM, and the results are shown in Fig. 4 and 5. Some spherical particles randomly attached on the surface of the nanoscrolls are clearly seen in the HRTEM images. It is well known that nanosheets have hydroxyl groups exposed at their surface. So the Fe(OH)3 sols can react with the hydroxyl groups on the surface of the nanoscrolls to form Fe2O3 nanoparticles and attach to the surface of the nanoscrolls. After calcination, the Fe2O3 nanoparticles grew further, corresponding to the obtained result of the XRD patterns. The prepared nanoscroll composite stacks open before calcination, and it becomes compact via calcination, as seen in Fig. 4 (see also the ESI†). From Fig. 5a and c, it can be considered from the side that the calcination makes the composite become tight and the nanoscroll has good thermal stability. The HRTEM images of NS-H4Nb6O17 indicate that the tube-like structure is successfully prepared with a diameter of about 13–24 nm and a length of about 290–500 nm (Fig. 5a). The lateral section of NS-H4Nb6O17 (Fig. 5b) possesses a dark and bright field, suggesting that the tube-like NS-H4Nb6O17 has a nanoscroll structure with the wall of varying thicknesses. When composited with Fe2O3 nanoparticles, typically spherical-shaped nanoparticles decorated on nanoscrolls are seen in Fig. 5, and the Fe2O3 nanoparticles in these systems are distributed on the inside and outside walls of the nanoscrolls with different sizes in Fig. 5d and e. Fig. 6 shows the EDS spectra of NS-H4Nb6O17 and A-Fe2O3/Nb6O17. From Fig. 6a, one can find that K+ was completely removed from NS-H4Nb6O17, and the mole ratio of Nb:O is about 1:4.2, and the excess oxygen may be due to the adsorbed H2O. The EDS spectrum reveals that the A-Fe2O3/Nb6O17 nanoscroll composite contains iron. It is revealed that the composited nanoparticles belong to Fe2O3 based on the results of XRD. The mole ratio of Fe:Nb:O is about 1:1.6:4.8. It is clearly seen that the Fe element is partially lost in the prepared process, and the lower amount of oxygen may be due to the chemical reaction between Fe(OH)3 sols and nanoscrolls, and Nb–O–Fe may be formed.
 |
| | Fig. 4 Field emission scanning electron microscopy (FESEM) images of the as-prepared samples (a) B-Fe2O3/Nb6O17 and (b) A-Fe2O3/Nb6O17. | |
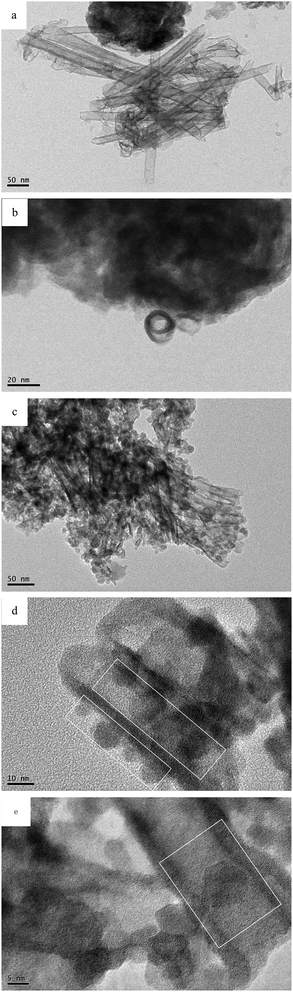 |
| | Fig. 5 HRTEM images of the as-prepared samples (a) and (b) NS-H4Nb6O17, and (c)–(e) A-Fe2O3/Nb6O17. | |
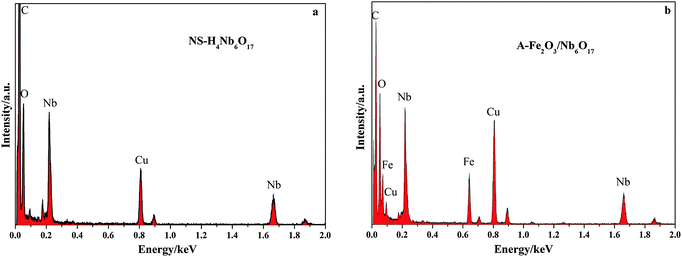 |
| | Fig. 6 EDS spectra of (a) NS-H4Nb6O17 and (b) A-Fe2O3/Nb6O17. | |
3.3 N2 adsorption–desorption isotherms of the as-prepared samples
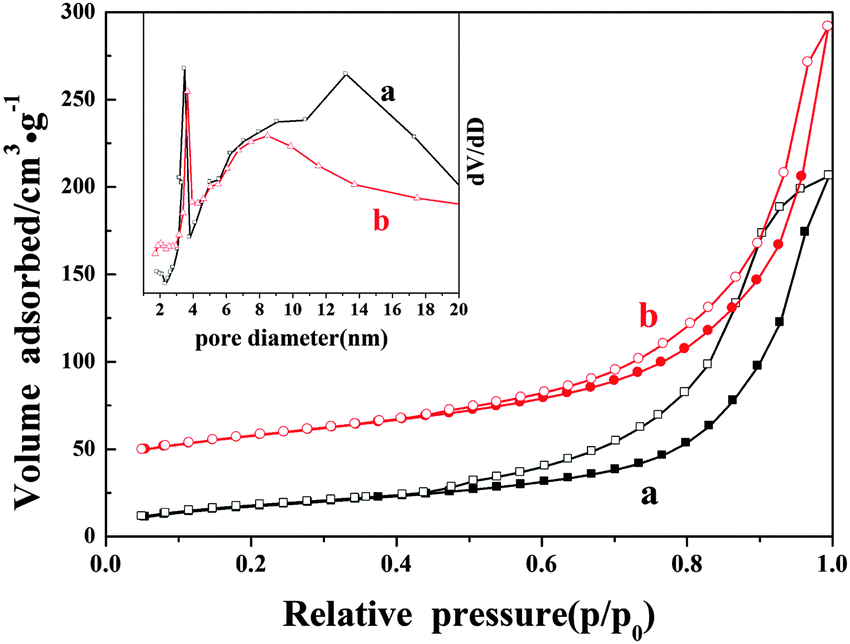
N2 adsorption–desorption isotherms of the as-prepared samples are shown in Fig. 7. The isotherms of the as-prepared samples exhibit a type IV isotherm due to the mesoporosity. As it can be seen, adsorption saturation is not reached in the range of higher relative pressure, and all of them exhibit an IUPAC type H3 hysteresis loop in the range of 0.4–1.0, and it may be ascribed to the existence of tube-shaped mesopores. From Table 1, the BET specific surface area of A-Fe2O3/Nb6O17 is 114 m2 g−1, and is ∼2 times larger than that of NS-H4Nb6O17 (64 m2 g−1). The total pore volume of the composites (0.41 cm3 g−1) is larger than that of NS-H4Nb6O17 (0.32 cm3 g−1). This may originate from the assembling nanoscroll with the oxide nanoparticles.
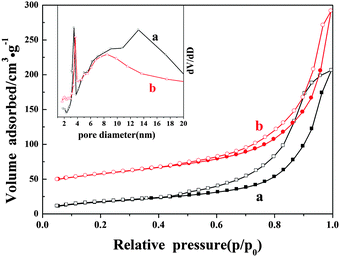 |
| | Fig. 7 N2 adsorption–desorption isotherms of NS-H4Nb6O17 (a) and A-Fe2O3/Nb6O17 (b). The inset indicates the pore size distribution curves. | |
Table 1 Parameters obtained from N2 desorption measurements
| Sample |
Surface areaa (m2 g−1) |
Pore volumeb (cm3 g−1) |
|
BET specific surface area calculated from the linear part of the BET plot.
Total pore volume taken from the volume of N2 adsorbed at p/p0 = 0.99.
|
| NS-H4Nb6O17 |
64 |
0.32 |
| A-Fe2O3/Nb6O17 |
114 |
0.41 |
As can be seen from the pore size distribution curves, both of them are consistent with mesoporous materials. NS-H4Nb6O17 shows two pore size distribution peaks with a pore diameter of ca. 3.7 nm and 13.2 nm. A mesoporous structure with a pore diameter of 3.7 nm is still retained in the composites. This may be the well-known artificial peak attributed to the tensile strength effect,21,22 which disappeared for the pore size distribution curve calculated by adsorption branches. And a broad peak with a pore diameter of 13.2 nm in NS-H4Nb6O17 may be attributed to the diameter of the nanoscroll structure, corresponding to the HRTEM of NS-H4Nb6O17. After forming a composite with the Fe2O3 nanoparticles, this broad peak with a pore diameter of 13.2 nm shifted to 8.5 nm may be derived from the assembling nanoscroll with the oxide nanoparticles, and fractional nanoparticles are decorated on the inside surfaces of the nanoscrolls according to the HRTEM of A-Fe2O3/Nb6O17.
3.4 Skeleton characteristics of the as-prepared samples
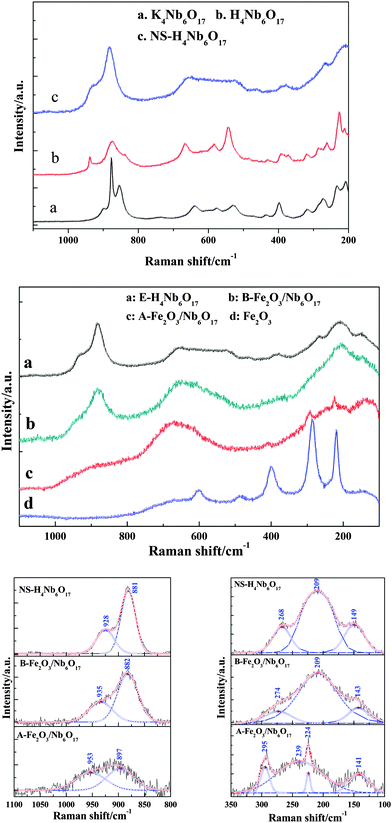
The skeleton characteristics of the composites were studied by Raman spectroscopy, which is shown in Fig. 8. The strongest characteristic band of K4Nb6O17 is around 877 cm−1, which belongs to the stretching vibration of the shorter Nb–O terminal group. The bands at 500–700 cm−1 correspond to the stretching vibrations of the longer Nb–O bond in the NbO6 octahedral unit. The other bands at 180–480 cm−1 belong to the bending vibrations and vibrational modes of the NbO6 octahedral unit.23 A new Raman band at around 940 cm−1 in the Raman spectrum of H4Nb6O17 is attributed to the replacement of K+ by H3O+ after the ion exchange reaction, and the terminal Nb–O bond becomes a Nb–O⋯H bond and a further formed Nb–OH bond.24
 |
| | Fig. 8 Raman spectra and fitted curves of the as-prepared samples. | |
In order to further investigate the interaction between the nanoscroll support and the Fe2O3 nanoparticles, the curves fitted from 1100 to 800 cm−1 and 350 to 100 cm−1 are also shown in Fig. 8. The strong band around 881 cm−1 in the Raman spectra of NS-H4Nb6O17 is assigned to the stretching vibration of the shorter Nb–O terminal group. A shoulder band at 928 cm−1 is assigned to the Nb–OH bond driven from the hydrous shorter Nb–O terminal group. The bands at 145 cm−1 may be due to the contribution of translational motions of the Nb atoms. When the nanoscroll composited with the Fe(OH)3 sols, the Nb–OH bond is blue-shifted to 935 cm−1 in B-Fe2O3/Nb6O17. The result indicates that the Fe(OH)3 sols have interacted with the Nb–OH bonds. The bands at 268 cm−1 have disappeared while a new broadened band has emerged at 274 cm−1. The latter band may be a merged band composed of the band of crystalline Fe2O3 nanoparticles and the band of NS-H4Nb6O17 at 268 cm−1. The bands at 224 cm−1 and 295 cm−1, corresponding to the band of α-Fe2O3 in A-Fe2O3/Nb6O17, are blue-shifted ca. 5 cm−1 and 10 cm−1 compared to those of pure α-Fe2O3, respectively. This corresponded to an XRD pattern of which the parameters have slightly changed. The Nb–OH bond is further blue-shifted to 953 cm−1, and the Nb–O terminal band is blue-shifted to 897 cm−1, and the intensities of the Nb–O terminal bond and Nb–OH bond are weakened obviously. Due to the higher electronegativity of Fe as compared to Nb, the strength of the Nb–O bond is enhanced and blue-shifted. So the interactions between Fe2O3 and the nanoscrolls are obviously enhanced, and the chemical bond of Nb–O–Fe may be formed. Further analysis points out that there exists a new broadened band at 239 cm−1 in A-Fe2O3/Nb6O17, which is also assigned to the merged band between the bands of NS-H4Nb6O17 at 268 cm−1 and 209 cm−1.
3.5 Optical characterization of the as-prepared samples
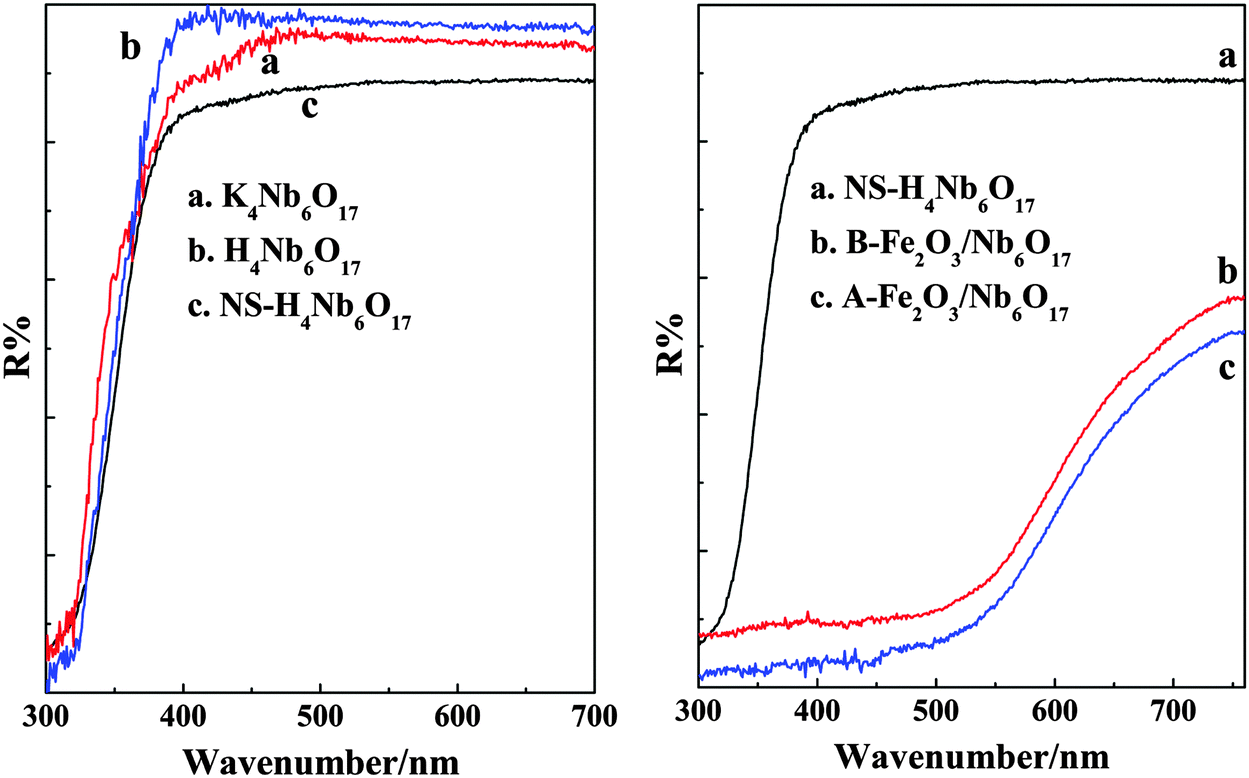
The spectral response characteristics of the as-prepared samples were investigated by the method of UV-vis DRS, and the results are shown in Fig. 9. The analysed results are displayed in Table 2 using the equation ΔE = 1240/λ (nm). Obvious red-shifts are observed for B-Fe2O3/Nb6O17 and A-Fe2O3/Nb6O17 (with a band gap of 1.86 eV and 1.82 eV, respectively), indicating that the introduced Fe2O3 nanoparticles decrease the band gap of the composites and that interactions between the Fe2O3 nanoparticles and nanoscrolls exist in the composites. The absorption edge of the Fe2O3/Nb6O17 composites only exhibits a slight variation before and after calcination (with a band gap changing from 1.86 eV to 1.82 eV). It may be explained by the fact that B-Fe2O3/Nb6O17 has relatively stronger interactions and the Fe(OH)3 sols were partially turned into Fe2O3 crystals, and the calcination is inadequate to significantly adjust the band gap of the samples.
 |
| | Fig. 9 UV-vis DRS of the as-prepared samples (K4Nb6O17, H4Nb6O17, NS-H4Nb6O17, B-Fe2O3/Nb6O17 and A-Fe2O3/Nb6O17). | |
Table 2 The absorption edge and the band gap energy of the as-prepared samples
| Samples |
Absorption edge (λ/nm) |
Band gap (eV) |
| K4Nb6O17 |
400 |
3.10 |
| H4Nb6O17 |
390 |
3.18 |
| NS-H4Nb6O17 |
380 |
3.26 |
| B-Fe2O3/Nb6O17 |
667 |
1.86 |
| A-Fe2O3/Nb6O17 |
680 |
1.82 |
3.6 Photocatalytic activity
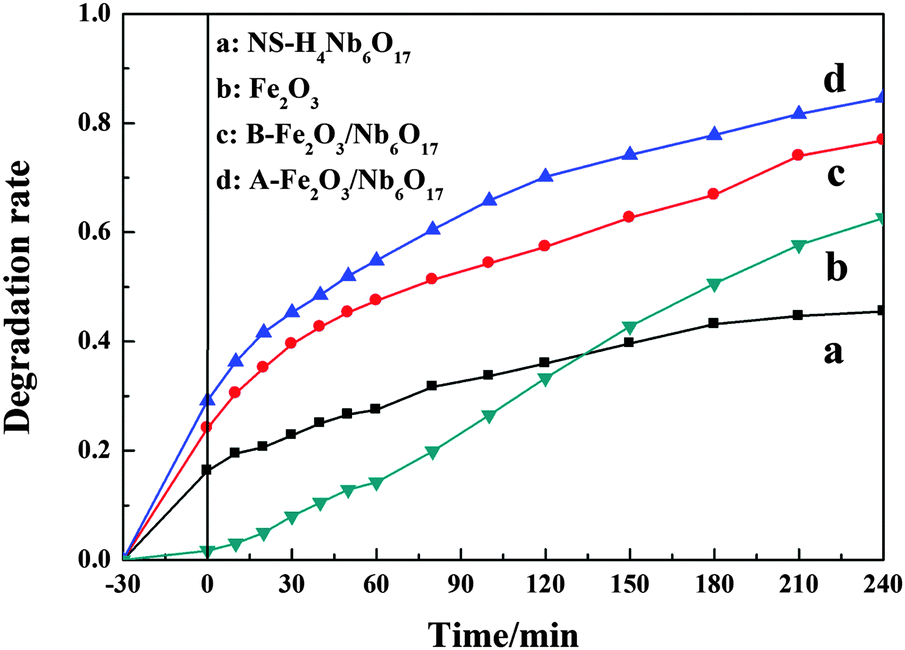
The photocatalytic activity of the as-prepared samples was evaluated from the rate of photodegradation of MB under visible light irradiation (Fig. 10). As can be seen, the degradation rates of MB over the as-prepared composites (∼77% and ∼85% after 240 min, respectively) are much higher than those over NS-H4Nb6O17 and Fe2O3 (∼45% and 63% after 240 min, respectively). It may be because the composites have a stronger visible light absorption capacity, and larger specific surface areas. The rate of MB degradation over A-Fe2O3/Nb6O17 is slightly higher than that over B-Fe2O3/Nb6O17, which may be due to the enhanced interaction after calcination.
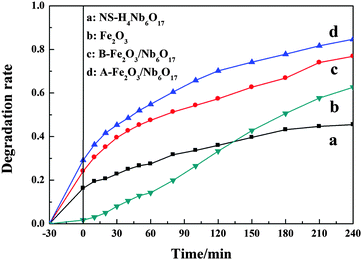 |
| | Fig. 10 The photocatalytic degradation of MB over the as-prepared samples under visible light (λ > 400 nm) irradiation. | |
3.7 Possible assembly mechanism
The preparation process of the composites is schematically illustrated in Fig. 11. According to HRTEM, the Fe2O3 nanoparticles are distributed on the inside and outside surfaces of the nanoscrolls. A mass of hydroxyl groups (such as Nb–OH) are exposed at the surface of the nanoscrolls, which is well known. The hydroxyl groups Nb–OH can be formed by the hydrous terminal Nb–O⋯H2O groups. The “hydroxyl titration” model supposes that the surface metal oxide species primarily coordinate to the oxide supports by titrating the surface hydroxyls of the supports.25 Previous studies26 have shown that Nb2O5/SiO2 was prepared by cross-condensation of surface hydroxyl groups of the SiO2 support with the surface hydroxyl entities of Nb2O5, and the surface hydroxyl groups of the SiO2 support with a stronger activity more easily react with niobia species. Due to the higher acidity of niobate, cross-condensation of the hydroxyl entities of Fe2O3 with Nb6O17 is potentially easier. Considering the above-mentioned result in the Raman spectra of the as-prepared composites that the terminal Nb–O band and terminal hydroxyl groups (Nb–OH) are obviously weakened and shifted, the terminal hydroxyl groups (Nb–OH) may have a stronger activity to interact with the oxide sols. So the terminal hydroxyl groups (Nb–OH) may become the active sites of dispersing the oxide nanoparticles. However, the interactions between the oxide sols and nanoscrolls are relatively weak before calcination. When the composite is calcined, the reaction between the hydroxyl groups of the oxide sols and nanoscrolls is enhanced. In the meantime, the oxide sols further turned into oxide nanoparticles, and the oxide nanoparticles continued to grow.
 |
| | Fig. 11 Schematic diagram of the assembly mechanism for the composite. | |
4. Conclusions
Composites are successfully prepared via combining nanoscroll sols with oxide sols under moderate conditions. Fe2O3 nanoparticles are distributed on the inside and outside surfaces of the nanoscrolls with different sizes. The pore volumes and specific surface areas are increased. The absorption edge of the as-prepared composites show an apparent red-shift compared to the support NS-H4Nb6O17. The absorption edge of A-Fe2O3/Nb6O17 was further red-shifted compared to that of B-Fe2O3/Nb6O17 due to the enhanced interactions. It has a very promising application in the photocatalytic field. The work reveals that the composite has strong interactions between the oxide and nanoscrolls via combining oxide with the Nb–OH terminal bond. An assembly mechanism of the nanoscroll with the oxide nanoparticles is supposed through scrolling the exfoliated Nb6O174− nanosheet sols into nanoscrolls prior to assembly. The surface hydroxyl groups of the nanoscrolls play an important role in forming a composite with the oxide nanoparticles.
Acknowledgements
This work was supported by the Natural Science Foundation of China (no. 21271008, 21071004), and the Anhui Provincial Natural Science Foundation (no. 11040606M38).
References
- X. Peng, L. L. Peng, C. Z. Wu and Y. Xie, Chem. Soc. Rev., 2014, 43, 3303 RSC.
- A. S. Dias, S. Lima, D. Carriazo, V. Rives, M. Pillinger and A. A. Valente, J. Catal., 2006, 244, 230 CrossRef CAS PubMed.
- M. A. Bizeto, A. L. Shiguihara and V. R. L. Constantino, J. Mater. Chem., 2009, 19, 2512 RSC.
- Y. Yamada, A. Nomura, H. Tadokoro and S. Fukuzumi, Catal. Sci. Technol., 2015, 5, 428 CAS.
- M. Osada and T. Sasaki, ECS Trans., 2012, 50, 111 CrossRef PubMed.
- K. Maeda, G. Sahara, M. Eguchi and O. Ishitani, ACS Catal., 2015, 5, 1700 CrossRef CAS.
- C. Zhou, Y. F. Zhao, L. Shang, Y. H. Cao, L. Z. Wu, C. H. Tung and T. R. Zhang, Chem. Commun., 2014, 50, 9554 RSC.
- W. Q. Cui, M. Y. Shao, L. Liu, Y. H. Liang and D. Rana, Appl. Surf. Sci., 2013, 276, 823 CrossRef CAS PubMed.
- X. Q. Li, T. Y. Zhang, S. W. Gu, S. Z. Kang, G. D. Li and J. Mu, Sep. Purif. Technol., 2013, 108, 139 CrossRef CAS PubMed.
- X. T. Pian, B. Z. Lin, Y. L. Chen, J. D. Kuang, K. Z. Zhang and L. M. Fu, J. Phys. Chem. C, 2011, 115, 6531 CAS.
- S. Adireddy, Y. Yao, J. B. He and J. B. Wiley, Mater. Res. Bull., 2013, 48, 3236 CrossRef CAS PubMed.
- Y. Yao, G. S. Chaubey and J. B. Wiley, J. Am. Chem. Soc., 2012, 134, 2450 CrossRef CAS PubMed.
- S. Adireddy, C. E. Carbo, Y. Yao, J. M. Vargas, L. Spinu and J. B. Wiley, Chem. Mater., 2013, 25, 3902 CrossRef CAS.
- S. Adireddy, T. Rostamzadeh, C. E. Carbo and J. B. Wiley, Langmuir, 2015, 31, 480 CrossRef CAS PubMed.
- F. E. Sarac, C. Yilmaz, F. Y. Acar and U. Unal, RSC Adv., 2012, 2, 10182 RSC.
- C. H. Hu, L. H. Zhang, J. F. Zhang, L. Y. Cheng, Z. Zhai, J. Chen and W. H. Hou, Appl. Surf. Sci., 2014, 298, 116 CrossRef CAS PubMed.
- S. Adireddy, C. E. Carbo, T. Rostamzadeh, J. M. Vargas, L. Spinu and J. B. Wiley, Angew. Chem., Int. Ed., 2014, 53, 4614 CrossRef CAS PubMed.
- R. Ma, Y. Kobayashi, W. J. Youngblood and T. E. Mallouk, J. Mater. Chem., 2008, 18, 5982 RSC.
- T. K. Townsend, E. M. Sabio, N. D. Browning and F. E. Osterloh, ChemSusChem, 2011, 4, 185 CAS.
- Z. J. Chen, B. H. Lin, Y. L. Chen, K. Z. Zhang, B. Li and H. Zhu, J. Phys. Chem. Solids, 2010, 71, 841 CrossRef CAS PubMed.
- J. C. Groen, L. A. A. Peffer and J. Pérez-Ramírez, Microporous Mesoporous Mater., 2003, 60, 1–17 CrossRef CAS.
- C. Hu and L. Zhang, J. Energy Chem., 2014, 23, 136–144 CrossRef CAS.
- M. M
![[a with combining cedilla]](https://www.rsc.org/images/entities/char_0061_0327.gif) czka, M. Ptak, A. Majchrowski and J. Hanuza, J. Raman Spectrosc., 2011, 42, 209–213 CrossRef PubMed.
czka, M. Ptak, A. Majchrowski and J. Hanuza, J. Raman Spectrosc., 2011, 42, 209–213 CrossRef PubMed.
- Y. Hosogi, H. Kato and A. Kudo, J. Phys. Chem. C, 2008, 112, 17678–17682 CAS.
- I. E. Wachs, Catal. Today, 1996, 27, 437 CrossRef CAS.
- J. He, Q. J. Li and Y. N. Fan, J. Solid State Chem., 2013, 202, 121 CrossRef CAS PubMed.
Footnote |
| † Electronic supplementary information (ESI) available. See DOI: 10.1039/c5nj02120k |
|
| This journal is © The Royal Society of Chemistry and the Centre National de la Recherche Scientifique 2016 |
Click here to see how this site uses Cookies. View our privacy policy here.