The solvothermal synthesis and enhanced photocatalytic activity of Zn2+ doped BiOBr hierarchical nanostructures
Xu Chun
Song
*a,
Yi Fan
Zheng
b,
Hao Yong
Yin
c,
Jia Ning
Liu
a and
Xue Dan
Ruan
a
aDepartment of Chemistry, Fujian Normal University, Fuzhou 350007, P. R. China. E-mail: songxuchunfj@163.com; Fax: +86-591-83465376; Tel: +86-591-87441126
bResearch Center of Analysis and Measurement, Zhejiang University of Technology, Hangzhou 310014, P. R. China
cInstitute of Environmental Science and Engineering, Hangzhou Dianzi University, Hangzhou, 310018, P. R. China
First published on 12th October 2015
Abstract
Novel, visible light-induced, Zn-doped BiOBr hierarchical nanostructures were successfully prepared by solvothermal methods. The photocatalytic activity of the samples was evaluated using RhB as the target pollutant. The Zn-doped BiOBr hierarchical nanostructures exhibited significantly enhanced visible light-induced photocatalytic efficiency for the degradation of RhB compared with pure BiOBr. The Zn-doped BiOBr with RZn = 0.1 (RZn is defined as the atomic ratio of Zn to Bi) showed the highest photocatalytic activity with decolorization efficiency of almost 100% after 15 min. The enhanced photocatalytic ability could be attributed to the efficient separation of photogenerated electron–hole pairs. Moreover, the role of the active species was also evaluated by adding different scavengers during the photodegradation of RhB. A possible mechanism for the enhancement of visible light performance of Zn-doped BiOBr photocatalysts was also proposed on basis of the experimental results.
1. Introduction
Effluents containing large amounts of dyes are major sources of water pollution because colored dyes in wastewater can pose a threat to aquatic life and endanger human health. Therefore, people have been taking action to treat dye wastewaters.1 Heterogeneous photocatalysis have aroused extensive interest due to their applications in decomposing organic dyes for environmental remediation.2 Among the diverse photocatalysts, TiO2 is the famous one due to its high activity, low price, non-toxicity and long-term stability.3,4 However, it can only be activated by ultraviolet light, which comprises less than 5% of the solar spectrum.5 Considering that visible light accounts for 43% of the energy in the solar spectrum, intensive efforts have been made to develop efficient visible light-driven photocatalysts such as inorganic bismuth compounds (BiVO4,6 Bi2WO6,7,8 Bi2MoO6,9 BiFeO3,10 BiOX (X = Cl, Br, I),11 BiFeO312).Bismuth oxyhalides (BiOBr) are V–VI–VII ternary compounds with a tetragonal matlockite structure. Over the past few years, they have been investigated because of their unique visible light photocatalytic performance in the degradation of organic contaminants. Various BiOBr structures, such as microspheres,13 nanobelts,14 microflowers,15 and nanoplates,16 have been prepared, and these BiOBr with various morphologies and dimensionalities display high photocatalytic activity. However, the photocatalytic activity of BiOBr still cannot meet the requirements of practical applications and it is necessary to find new approaches to improve the photocatalytic efficiency. Therefore, numerous techniques have been adopted to enhance photocatalytic efficiency, including ion doping17 and coupling with other semiconductors.18 Numerous BiOBr composite photocatalysts (BiOBr-g-C3N4,19 Cd–BiOBr,20 BiOBr–graphene,21 BiOI–BiOBr,22 BiOCl–BiOBr,23 AgBr–BiOBr,24 BiOBr–ZnFe2O4,25 BiOBr–TiO226 and BiOCl/Bi2MoO627) were prepared all of which showed enhanced photocatalytic efficiency. However, there are few reports on investigating the doping of nonmetal elements and transition metal elements in BiOBr. Moreover, the transition metal elements have many valences and the trace transition metal ions doped in the BiOBr matrix may be a potential trap of photogenerated electron–hole pairs, thus prolonging the lifetime of electrons and holes and consequently increasing the photocatalytic activity. Recently, a novel and efficient visible light-induced BiOBr photocatalyst with Ti doping and Ag decorating was successfully obtained.28 The Ti-doped BiOBr photocatalysts displayed higher activity for the degradation of RhB under visible light irradiation.29 Fe-doped BiOBr hollow microspheres also exhibited excellent photocatalytic activity.30 However, to the best of our knowledge, there are no studies on the synthesis and photocatalytic performance of a Zn-doped BiOBr photocatalyst.
In this study, visible light-activated Zn-doped BiOBr hierarchical nanostructures were successfully synthesized by a facile and rapid solvothermal method. The photocatalytic efficiency of the Zn-doped BiOBr was evaluated by decolorizing RhB under visible light irradiation. Moreover, the effect of zinc doping on the structure and photocatalytic activity of the BiOBr catalyst was also studied in detail. The photocatalytic activity of Zn-doped BiOBr was greatly enhanced compared to pure BiOBr. The enhancement of photocatalytic activity of the Zn-doped BiOBr may be related to the doped Zn, which acts as hole traps and consequently suppresses the recombination of electrons and holes.
2. Experimental section
2.1 Synthesis of Zn-doped BiOBr hierarchical nanostructures
All the chemicals were of analytical purity and used without further purification. In the typical preparation, 5 mmol of Zn(NO3)2·6H2O and Bi(NO3)3·5H2O with a Zn/Bi molar ratio of 0, 0.02, 0.06, 0.10 and 0.14 were dissolved in 20 mL ethylene glycol under magnetic stirring. 5 mmol of KBr was dissolved in 20 mL ethylene glycol, and the resultant solution was added slowly to the abovementioned Bi(NO3)3 solution with vigorous stirring. Next, the suspension was transferred to a 50 mL Teflon-lined stainless steel vessel, followed by solvothermal treatment at 160 °C for 12 h. After cooling to room temperature naturally, the obtained precipitates were separated centrifugally and washed with deionized water and ethanol several times, and the samples were dried at 60 °C for 5 h. For convenience in the description, the value of RZn is used to describe the atomic ratio of Zn to Bi and represents atomic ratios 0, 0.02, 0.06, 0.10 and 0.14.2.2 Characterization
The phase structures of the obtained samples were analyzed with a Thermo ARL SCINTAG X'TRA diffractometer using Cu-Kα radiation (λ = 0.154056 nm) and recorded for 2θ ranging from 20° to 80°. The morphologies of the samples were investigated by a Hitachi S-4700 field emission scanning electron microscope (SEM, scanning voltages 15 kV) equipped with an energy-dispersive X-ray detector (EDS, Thermo Noran VANTAG-ESI) and a Tecnai G2 F30 transmission electron microscope (TEM, accelerating voltage 200 kV). UV-Vis diffuse reflectance spectra of the prepared products were analyzed on a UV-Vis spectrophotometer (Lambda 850) using BaSO4 as the reference. The Brunauer–Emmett–Teller (BET) specific surface area was measured using a Micromeritics ASAP 2000 surface area analyzer. The photocurrents were measured using an electrochemical workstation (CHI-660C, China) with a standard three-electrode system, which employed an ITO glass coated with the prepared samples (0.1 mg) as the working electrode, a Pt wire as the counter electrode, and a saturated Ag/AgCl electrode as a reference electrode. A 300 W xenon lamp was utilized as the light source, and 0.1 M Na2SO4 aqueous solution was used as the electrolyte.2.3 Photocatalytic experiments
Photocatalytic activities of the Zn-doped BiOBr were evaluated by the photodegradation of rhodamine B (RhB) in an aqueous solution. The photocatalytic experiments were carried out under visible light irradiation with a 300 W Xe lamp as the light source equipped with a 420 nm cutoff filter to provide visible light. In every experiment, 0.1 g of the prepared photocatalyst was suspended in 200 mL RhB aqueous solution (C0 = 2 × 10⁻⁵ mol L−1) with constant stirring. Prior to irradiation, the suspensions were stirred for 1 h in the dark to ensure the establishment of adsorption–desorption equilibrium between the catalyst and RhB. Subsequently, the photocatalytic test was conducted with 5 mL reacting solution sampled and then centrifuged to remove the photocatalysts at every irradiation time intervals. The change of RhB concentrations (C) was monitored by measuring the maximum absorbance at 553 nm for RhB using a UV759S UV-Vis spectrophotometer.3. Results and discussion
3.1 Morphology and microstructure
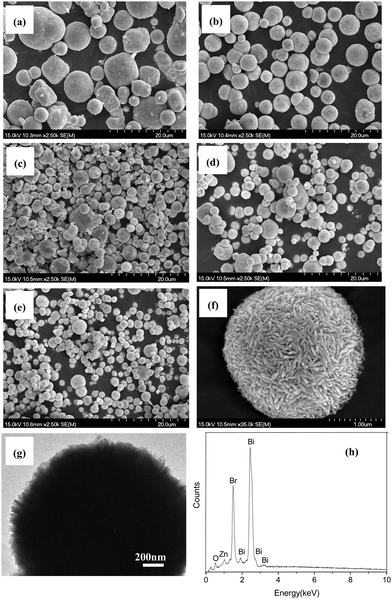
The microstructures, morphologies and particle sizes of pure BiOBr and Zn-doped BiOBr with different zinc contents were investigated by SEM and TEM. It can be seen from Fig. 1a that pure BiOBr is composed of many microspheres with the range of diameters from 2 to 10 μm. The SEM images of Zn-doped BiOBr with different zinc contents are shown in Fig. 1b–e. It can be seen that the morphologies of the Zn-doped BiOBr samples are similar to pure BiOBr. However, with the increase of Zn amount, it can be observed that many more Zn-doped BiOBr microspheres with a size ranging from 1 to 2 μm were obtained, indicating that the Zn-doping can partly reduce the particle size of the BiOBr microspheres by acting as an inhibitor for crystal growth in BiOBr preparation. Fig. 1f shows the high magnification SEM image of Zn-doped BiOBr microspheres with RZn = 0.1. Careful observation reveals that Zn-doped BiOBr microspheres are formed of many nanosheets stacked together. Therefore, the TEM image further confirms that the prepared Zn-doped BiOBr microsphere consists of self-assembled nanosheets (Fig. 1g). The EDS experiment was used to further identify the elemental composition of the Zn-doped BiOBr hierarchical nanostructures with RZn = 0.1 and the results are shown in Fig. 1h. The obvious signals for Br, Bi and O were observed in the spectra together with a weak signal for zinc.Fig. 2A shows the XRD patterns of pure BiOBr and Zn-doped BiOBr with different zinc concentrations. It can be seen that all the diffraction peaks of the prepared samples match well with the standard data of the tetragonal phase of BiOBr (JCPDS card no. 78-0348). No other diffraction peaks were observed for the samples, which indicated that introducing Zn-ions did not significantly change the crystal structure of BiOBr. Further observation of the (110) diffraction peak in the range of 28°–35° is shown in Fig. 2B. The peak position of zinc-doped BiOBr shifts slightly towards a higher 2θ value with increase of the zinc concentrations. The other diffraction peaks show similar behavior. It is known that differences in the ionic radius can induce changes in the lattice parameters.31 The cell parameters of Zn-doped BiOBr with different zinc contents are shown in Table 1. Because the ionic radius of Zn2+ (0.074 nm) is smaller than that of Bi3+ (0.103 nm) and the doped Zn2+ may be incorporated into the BiOBr matrix by substituting for Bi3+ lattice sites, the lattice parameters decrease with the increase of the Zn2+ concentration, and accordingly the observed diffraction peaks shift toward higher angles.
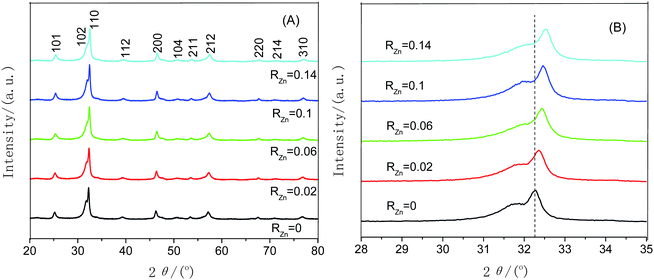 | ||
| Fig. 2 (A) XRD diffraction patterns of the Zn-doped BiOBr samples with different RZn values. (B) Diffraction peak position of the (110) plane with different RZn values in the range of 2θ = 28°–35°. | ||
| Zn-doping concentrations | The cell parameters | ||
|---|---|---|---|
| a (Å) | b (Å) | c (Å) | |
| 0 | 3.924 | 3.924 | 8.107 |
| 0.02 | 3.917 | 3.917 | 8.107 |
| 0.06 | 3.913 | 3.913 | 8.105 |
| 0.10 | 3.910 | 3.910 | 8.104 |
| 0.14 | 3.903 | 3.903 | 8.103 |
3.3 UV-Vis DRS analysis
The UV-Vis diffuse reflectance spectra (DRS) of pure BiOBr and Zn-doped BiOBr are shown in Fig. 3A. It can be seen that the pure BiOBr has an absorption edge at about 425 nm. However, the absorption edge of Zn-doped BiOBr is shifted slightly to longer wavelength with the increase of zinc content, suggesting that the absorption of visible light may be caused by the transition of impurity energy levels.32 The band gap (Eg) of the pure BiOBr and Zn-doped BiOBr can be calculated by a classical formula:33| A(hv − Eg)n/2 = ahν | (1) |
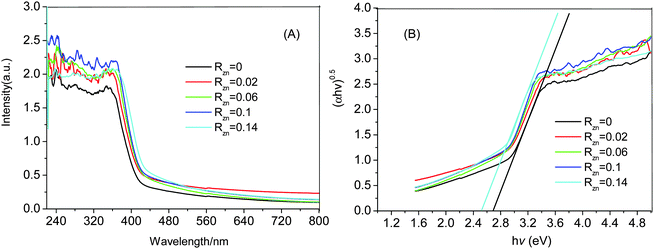 | ||
| Fig. 3 (A) UV-Vis diffuse reflectance spectra of the Zn-doped BiOBr samples with different RZn values, (B) plots of the (ahν)1/2versus hν of Zn-doped BiOBr samples. | ||
3.4 Photocatalytic activity
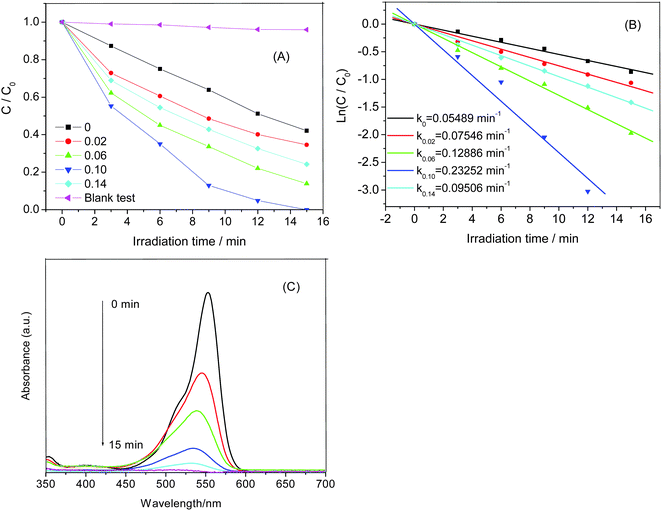
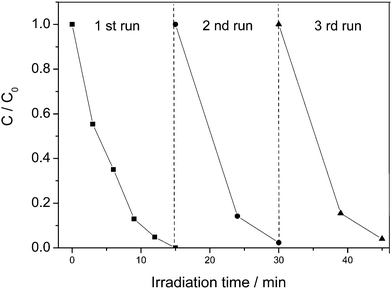
To study the photocatalytic activities of the samples, we investigated the photocatalytic degradation of RhB under visible light irradiation. Fig. 4A shows the decolorization efficiencies of RhB molecules by different photocatalysts. C0 is the initial concentration after the adsorption equilibrium on the photocatalyst before irradiation and C is the concentration of RhB during the irradiation time. The blank test (without any photocatalysts) shows extremely low photodegradation ability on RhB, which could be almost ignored. Only about 57% of RhB is decolorized by pure BiOBr after irradiation for 15 min. Compared to the pure BiOBr, all the Zn-doped BiOBr catalysts exhibit higher photocatalytic efficiency, which indicates that zinc doping could effectively improve the photocatalytic performance of BiOBr. It can be found that the Zn-doped BiOBr with RZn = 0.1 shows the highest photocatalytic activity with the decolorization efficiency reaching nearly 100% after 15 min irradiation. The photocatalysis kinetics of the RhB degradation were found to fit a pseudo-first order model: ln(C/C0) = k, where k is the kinetic constant. The pseudo-first-order rate constants are calculated in Fig. 4B. As can be observed from the Zn-doped BiOBr microspheres, the photocatalytic activities could be evidently enhanced with the increase of Zn2+ content at Zn-doping concentrations lower than 0.10. However, when the Zn2+ concentration increased to RZn = 0.14, the photocatalytic activity of Zn-doped BiOBr clearly decreased. This result suggested that photocatalytic ability of the samples was strongly dependent on the Zn-doping amount. Fig. 4C shows the time-dependent absorption spectra of RhB solution photocatalyzed by the Zn-doped BiOBr with RZn = 0.1. It can be seen that the color of the RhB solution changed from initially pink to colorless after irradiation for 15 min. The maximum absorption of RhB solution shifts from 553 to 532 nm. The shift can be attributed to the RhB photodegradation occurring via two competitive processes: N-demethylation and the destruction of the conjugated structure.35Besides the higher activity, the recyclability of the photocatalyst is also a very important factor for its practical application. Therefore, the recycling degradation tests were applied to evaluate the stability of the Zn-doped BiOBr with RZn = 0.1 (Fig. 5). After three recycles, the Zn-doped BiOBr catalyst had slight loss of efficiency due to the loss of catalyst during the washing and recycling process, but still exhibited good photocatalytic activity. The TEM and XRD of Zn-doped BiOBr after photodegradation of RhB show no changes in the morphology and tetragonal phase of the photocatalyst, indicating that the catalyst possesses excellent stability and reusability.
3.5 Discussion of degradation mechanism
Photocatalytic performance was governed by some crucial factors such as BET surface area, and separation efficiency of photogenerated electrons and holes. A large surface area is helpful to provide more photocatalytic reaction sites, which are favorable for photocatalytic efficiency.36 It can be seen from Table 2 that Zn-doped BiOBr samples have higher surface areas than that of pure BiOBr, the specific surface area increases with the increase of the zinc content. However, the specific surface areas of Zn-doped BiOBr with RZn = 0.10 and 0.14 were not consistent with the photocatalytic activity. This result indicates that the specific surface area is not the decisive factor associated with the photocatalytic activity of Zn-doped BiOBr.| Zn-doping concentrations | 0 | 0.02 | 0.06 | 0.10 | 0.14 |
| Surface area (m2 g−1) | 11.43 | 13.16 | 15. 84 | 16.73 | 16.82 |
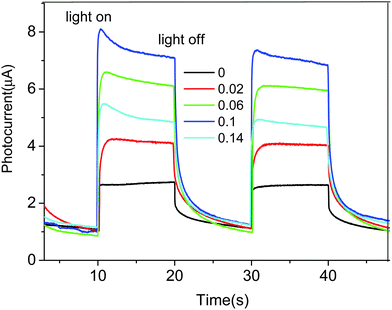
It is known that photocurrent is widely regarded as efficient evidence demonstrating the separation of photogenerated carriers in the photocatalysts. Fig. 6 shows the transient photocurrent responses for a series of Zn-doped BiOBr samples during repeated light on/off cycles under visible light irradiation. It is clear that all of the photocurrent generated from the Zn-doped BiOBr samples were larger than that of pure BiOBr, which may indicate more efficiency in separation of the photogenerated electrons and holes after Zn doping. The Zn2+ ions may be positioned in the BiOBr crystal lattice by substituting the Bi3+ lattice sites. As is known, upon light irradiation, electrons can be excited from the valence band to the conduction band, leaving corresponding holes in the valence band. In this case, Zn d10 might be deeper than the valence band state of BiOBr. Therefore, the suitable amount of Zn2+ dopants may capture photogenerated holes and decrease the rate of electron–hole recombination and accelerate the photocatalytic reaction. However, the charge capture centers may become the recombination centers by overloading dopants.37 Therefore, with a further increase of Zn concentration to 0.14, the photogenerated current density decreases due to the fact that high concentrations of Zn may also act as a recombination center.
The reactive species may be different during photocatalytic reaction on different photocatalysts. To clarify the photodegradation mechanism, isopropyl alcohol and EDTA-2Na were adopted as ˙OH and hole scavenger, respectively. Fig. 7 illustrates the photodecolorization of RhB over Zn-doped BiOBr with RZn = 0.10 in different conditions. The decolorization efficiency of RhB decreases from 100% to 92% and from 100% to 19% with the addition of isopropyl alcohol and EDTA-2Na, respectively. This indicates that the holes play an important role in this reaction.
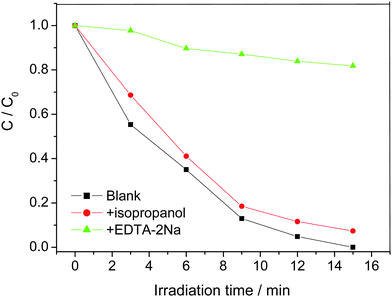 | ||
| Fig. 7 The effects of EDTA-2Na and isopropanol on the decolorization of RhB with the Zn-doped BiOBr sample with RZn = 0.10 catalyst. | ||
4. Conclusion
In summary, Zn-doped BiOBr hierarchical nanostructures were successfully synthesized by a simple solvothermal method as novel visible light-induced photocatalysts. The photocatalytic performance of the Zn-doped BiOBr samples is highly dependent on Zn content. With the increase of the Zn2+ content, the photocurrent and surface area of the photocatalyst were greatly increased, which greatly improved the photocatalytic activity of the BiOBr microspheres. The enhanced photocatalytic activity can be attributed to the high separation efficiency of the photogenerated electron–hole pairs and the increase of the BET surface area of the photocatalysts. Investigation of the main active species and their roles in the Zn-doped BiOBr photocatalysis suggested that the holes played an important role in this photocatalytic reaction.Acknowledgements
This work is financially supported by the National Nature Science Foundation of China (No. 21273034) and the support of Training Programs of Innovation and Entrepreneurship for Undergraduates of Fujian Normal University (No. cxxl-2015100).References
- Z. Yu, B. Detlef, D. Ralf, L. Song and L. Lu, J. Mol. Catal. A: Chem., 2012, 365, 1–7 CrossRef CAS.
- Z. Jiang, F. Yang, G. Yang, L. Kong, M. O. Jones, T. Xiao and P. P. Edwards, J. Photochem. Photobiol., A, 2010, 212, 8–13 CrossRef CAS.
- A. Maurizio, A. Vincenzo and D. P. Agatino, J. Phys. Chem. B, 2004, 108, 3303–3310 CrossRef.
- M. K. Nowotny, L. R. Sheppard and T. Bak, J. Phys. Chem. C, 2008, 112, 5275–5300 CAS.
- S. U. M. Khan, M. Al-Shahry and W. B. Ingler, Science, 2002, 297, 2243–2245 CrossRef CAS PubMed.
- Z. Y. Bian, Y. Q. i. Zhu, J. X. Zhang, A. Z. Ding and H. Wang, Chemosphere, 2014, 117, 527–531 CrossRef CAS PubMed.
- X. C. Song, Y. F. Zheng, R. Ma, Y. Y. Zhang and H. Y. Yin, J. Hazard. Mater., 2011, 192, 186–191 CAS.
- A. Singh, D. P. Dutta, M. Roy, A. K. Tyagi and M. H. Fulekar, J. Mater. Sci., 2014, 49, 2085–2097 CrossRef CAS.
- F. Duan, Y. Zheng and M. Chen, Mater. Lett., 2011, 65, 191–193 CrossRef CAS.
- X. Lv, J. Xie, Y. Song and J. Lin, J. Mater. Sci., 2007, 42, 6824–6827 CrossRef.
- L. Chen, R. Huang, M. Xiong, Q. Yuan, J. He and J. Jia, Inorg. Chem., 2013, 52, 11118–11125 CrossRef CAS PubMed.
- T. Gao, Z. Chen, Y. Zhu, F. Niu, Q. Huang, L. Qin, X. Sun and Y. Huang, Mater. Res. Bull., 2014, 59, 6–12 CrossRef CAS.
- Y. H. Feng, L. Li, J. W. Li, J. F. Wang and L. Liu, J. Hazard. Mater., 2011, 192, 538–544 CrossRef CAS PubMed.
- J. W. Wang and Y. D. Li, Chem. Commun., 2003, 2320–2321 RSC.
- Y. J. Chen, M. Wen and Q. S. Wu, CrystEngComm, 2011, 13, 3035–3039 RSC.
- Z. T. Deng, D. Chen, B. Peng and F. Q. Tang, Cryst. Growth Des., 2008, 8, 2995–3003 CAS.
- H. Fu, S. Zhang, T. Xu, Y. Zhu and J. Chen, Environ. Sci. Technol., 2008, 42, 2085–2091 CrossRef CAS PubMed.
- Y. Sun, W. Zhang, T. Xiong, Z. Zhao, F. Dong, R. Wang and W. Ho, J. Colloid Interface Sci., 2014, 418, 317–323 CrossRef CAS PubMed.
- L. Ye, J. Liu, Z. Jiang, T. Penga and L. Zan, Appl. Catal., B, 2013, 142–143, 1–7 CAS.
- Z. S. Liu, B. T. Wu, Y. B. Zhu, F. Wang and L. G. Wang, J. Colloid Interface Sci., 2013, 392, 337–342 CrossRef CAS PubMed.
- Z. Ai, W. Ho and S. Lee, J. Phys. Chem. C, 2011, 115, 25330–25337 CAS.
- J. Cao, B. Xu, H. Lin, B. Luo and S. Chen, Chem. Eng. J., 2012, 185–186, 91–99 CrossRef CAS.
- J. Zhang, J. Xia, S. Yin, H. Li, H. Xu, M. He, L. Huang and Q. Zhang, Colloids Surf., A, 2013, 420, 89–95 CrossRef CAS.
- L. Kong, Z. Jiang, H. H. Lai, R. J. Nicholls, T. Xiao, M. O. Jonesd and P. P. Edwards, J. Catal., 2012, 293, 116–125 CrossRef CAS.
- L. Kong, Z. Jiang, T. Xiao, L. Lu, M. O. Jonesac and P. P. Edwards, Chem. Commun., 2011, 47, 5512–5514 RSC.
- X. X. Wei, H. Cui, S. Guo, L. Zhao and W. Li, J. Hazard. Mater., 2013, 263, 650–658 CrossRef CAS PubMed.
- Y. Zuo, C. Wang, Y. Sun and J. Cheng, Mater. Lett., 2015, 139, 149–152 CrossRef CAS.
- G. Jiang, R. Wang, X. Wang, X. Xi, R. Hu, Y. Zhou, S. Wang, T. Wang and W. Chen, ACS Appl. Mater. Interfaces, 2012, 4, 4440–4444 CAS.
- R. Wang, G. Jiang, X. Wang, R. Hu, X. Xi, S. Bao, Y. Zhou, T. Tong, S. Wang, T. Wang and W. Chen, Powder Technol., 2012, 228, 258–263 CrossRef CAS.
- G. Jiang, X. Wang, Z. Wei, X. Li, X. Xi, R. Hu, B. Tang, R. Wang, S. Wang, T. Wang and W. Chen, J. Mater. Chem. A, 2013, 1, 2406–2410 CAS.
- G. Huang and Y. Zhu, CrystEngComm, 2012, 14, 8076–8082 RSC.
- S. Shen, L. Zhao, X. Guan and L. Guo, J. Phys. Chem. Solids, 2012, 73, 79–83 CrossRef CAS.
- W. S. Kuo and P. H. Ho, Dyes Pigm., 2006, 71, 212–217 CrossRef CAS.
- S. Shenawi-Khalil, V. Uvarov, S. Fronton, I. Popov and Y. Sasson, J. Phys. Chem. C, 2012, 116, 11004–11012 CAS.
- D. Zhang, J. Li, Q. Wang and Q. Wu, J. Mater. Chem. A, 2013, 1, 8622–8629 CAS.
- J. Xia, L. Xu, J. Zhang, S. Yin, H. Li, H. Xu and J. Di, CrystEngComm, 2013, 15, 10132–10141 RSC.
- A. S. Alshammari, L. Chi, X. Chen, A. Bagabas, D. Kramer, A. Alromaeha and Z. Jiang, RSC Adv., 2015, 5, 27690–27698 RSC.
| This journal is © The Royal Society of Chemistry and the Centre National de la Recherche Scientifique 2016 |

