DOI:
10.1039/C5NJ02105G
(Paper)
New J. Chem., 2016,
40, 209-216
Lanthanide complex-functionalized polyhedral oligomeric silsesquioxane with multicolor emission covered from 450 nm to 1700 nm†
Received
(in Victoria, Australia)
11th August 2015
, Accepted 21st October 2015
First published on 23rd October 2015
Abstract
A new 2,2′-bipyridine-4,4′-dicarboxylic acid-functionalized polyhedral oligomeric silsesquioxane (named as bpdc-POSS) was successfully synthesized. Subsequently, six new Ln-bpdc-POSS (Ln = Eu, Tb, Sm, Nd, Yb, Er) hybrid materials covalently linked with lanthanide complexes were prepared, based on the bpdc-POSS material acting as a matrix. The Ln-bpdc-POSS hybrid materials retain the structure of POSS and size distribution approximately 50 nm, and display visible as well as near-infrared luminescence (covered from 450 to 1700 nm wavelength region) under UV/visible light excitation. The Ln-bpdc-POSS materials (Ln = Eu, Tb, Sm, Er, Nd, Yb) were characterized by using wide-angle X-ray powder diffraction, Fourier-transform infrared (FT-IR) spectroscopy, high-resolution transmission electron microscopy (HRTEM), fluorescent spectroscopy and thermogravimetric analysis. The method offers advantages including the ease of synthesis and handling, as well as extending the use of POSS and expanding the field of luminescent inorganic–organic hybrid materials based on lanthanides.
1. Introduction
Polyhedral oligomeric silsesquioxane (POSS) has been noticeable owing to its well-defined rigid inorganic silica-like core, easily modifiable organic pendant groups, small size of total nanoparticles, and high stability in a biological environment, etc.1,2 The attractive properties of POSS show an excellent platform for the synthesis of new inorganic–organic hybrid materials, which can enhance the mechanical, stable and thermal properties.3,4 And various applications of these POSS derivatives can be tailored in different fields, such as nanocomposites,5–8 coatings,9 catalysis,10–12 porous materials,13–15 self-assembled structures16–18 and drug delivery by modifying the core structure appropriately. Recently, much interest has been focused on the applications of POSS derivatives in photonics19,20 and electroluminescent devices.21–23 The thermal stability, luminescence efficiency, and color purity of the electroluminescent devices can be significantly improved by covalently linking with POSS moieties.24–26 Hao and his co-workers reported the CdTe QDs coated by octa-mercaptopropyl polyhedral oligomeric silsesquioxane, which were successfully applied in cell labelling as fluorescent probes.27 Hybrid materials based on POSS not only maintain the chemical and mechanical advantages of inorganic–organic materials, but also overcome their limitations.
The lanthanide complexes hold an unparalleled position in the materials science due to their outstanding properties, for instance, high color purity, good luminous efficiency, a wide range of emission spectra from ultraviolet (UV) to near-infrared (NIR) regions, and so on.28 However, due to poor photostability and thermal stability, these light-emitting compounds have to be embedded into a matrix for practical applications. Various kinds of lanthanide-based complexes have been incorporated into different types of host matrices, such as mesoporous silica nanospheres (MSSs),29–31 metal–organic frameworks (MOFs),32,33 sol–gel hybrids,34 carbon nanotubes,35 and ionic liquids,36etc. However, the hybrid materials based on POSS as a matrix and covalently grafting lanthanide complexes are rarely reported. Recently, Li and coworkers reported the first europium(III) β-diketonate complex functionalized POSS, which has been obtained by the immobilization of an Eu complex at a silicon vertex of the POSS cage through the complexation of Eu3+ ions with thenoyltrifluoroacetone-functionalized POSS.37 The new molecular hybrid material shows bright red luminescence when irradiated with UV light. And the thermal analysis has revealed a significant improvement in the thermal stability of the material compared with the Eu3+ dihydrate, [Eu(tta)3·(H2O)2]. To the best of our knowledge, the POSS hybrid materials with NIR-luminescence have not been reported in the open literature so far, and it is for the first time octa-ammonium-POSS (OA-POSS) and lanthanide complexes have been combined to form the multi-color luminescent hybrid POSS materials.
In the present work, we expanded the visible luminescent POSS hybrid materials to NIR luminescent POSS by covalently linking ternary lanthanide complexes to exhibit multicolor emission covered from the visible-to-NIR region (450–1700 nm) and extend the applications of the POSS matrix in the NIR optical area. In our case, the amino group functionalized POSS (OA-POSS) was selected as a matrix, and first a new POSS material (bpdc-POSS) has been prepared based on the carboxylate groups in the 2,2-bipyridine-4,4-dicarboxylic (named as bpdc) electrostatic reaction with the amino groups from OA-POSS. Subsequently, the characteristic visible (Eu, Tb, Sm) and NIR (Sm, Er, Nd, Yb) luminescent (multicolor emission covered from the 450 nm to 1700 nm spectral region) POSS hybrid materials (denoted as Ln-bpdc-POSS, Ln = Eu, Tb, Sm, Er, Nd, Yb) were successfully prepared by covalently bonding with ternary lanthanide complex LnL3bpdc. The structures, patterns and the luminescent properties of the resulting POSS hybrid materials were investigated and discussed in detail.
2. Experimental section
2.1. Materials
1-(2-Thenoyl)-3,3,3-trifluoroaceton (Htta, 99%, Alfa Aesar), 1,1,1-trifluoroacetylacetone (Htfacac, 99%, Alfa Aesar), N,N-dimethylformamide (DMF, Aldrich, AR), octa-ammonium polyhedral oligomeric silsesquioxane (OA-POSS, Hybrid Plastics, Inc.) and 2,2′-bipyridine-4,4′-dicarboxylic (bpdc, 98%, Shanghai Yukang Biology Co. China) were all used as received without further purification. Ytterbium oxide (Yb2O3, 99.99%), samarium oxide (Sm2O3, 99.99%), europium oxide (Eu2O3, 99.99%), erbium oxide (Er2O3, 99.99%), neodymium oxide (Nd2O3, 99.99%), and terbium oxide (Tb4O7, 99.99%) were bought from Sigma-Aldrich. Hydrated LnCl3 salts (Ln = Eu, Tb, Sm, Er, Nd, Yb,) were obtained by dissolving Ln2O3 in hydrochloric acid. The resulting solutions were evaporated with heating; the residues were dissolved in the distilled water. The concentration of the lanthanide ions was measured by titration with a standard ethylenediaminetetraacetic acid (EDTA) aqueous solution.
2.2. Synthesis of bpdc modified octa-ammonium polyhedral oligomeric silsesquioxane (denoted as bpdc-POSS)
Firstly, OA-POSS (0.1 g) was dissolved in the mixed solution of DMF and deionized water at a volume ratio of 7![[thin space (1/6-em)]](https://www.rsc.org/images/entities/char_2009.gif) :3. This operation leads to the change of quaternary ammonium salt of POSS to amino groups, denoted as AM-POSS. Then, bpdc (0.167 g) with a molar ratio of POSS:bpdc being 1:8 was added to the 100 mL mixed solution (70% DMF and 30% deionized water). The mixture was heated at 95 °C for 8 h until the solution became transparent. Then, DMF and deionized water were removed by rotary evaporation to yield the fully desolvated product. The resulting product was washed and dried at 80 °C overnight.
:3. This operation leads to the change of quaternary ammonium salt of POSS to amino groups, denoted as AM-POSS. Then, bpdc (0.167 g) with a molar ratio of POSS:bpdc being 1:8 was added to the 100 mL mixed solution (70% DMF and 30% deionized water). The mixture was heated at 95 °C for 8 h until the solution became transparent. Then, DMF and deionized water were removed by rotary evaporation to yield the fully desolvated product. The resulting product was washed and dried at 80 °C overnight.
2.3. Syntheses of [Ln(tta)3(H2O)2] (Ln = Eu, Sm, Er, Nd, Yb) and [Tb(tfacac)3(H2O)2] complexes.
[Ln(tta)3(H2O)2] (Ln = Eu, Sm, Er, Nd, Yb) were synthesized according to a conventional method as follow. The pH value of Htta (6 mmol) in ethanol solution was adjusted to approximately 7 by adding the sodium hydroxide solution dropwise under stirring. Then 2 mmol of LnCl3 were added with a molar ratio of Ln3+:Htta = 1:3, and the reaction was heated to reflux at 80 °C for 5 h. After being cooled by ice water, the precipitates were washed with ethanol and water after filtration and then dried for a whole night.
[Tb(tfacac)3(H2O)2] was synthesized in a similar way to the [Ln(tta)3(H2O)2] except that LnCl3 and Htta were replaced by TbCl3 and Htfacac, respectively.
2.4. Syntheses of lanthanide complex functionalized bpdc-POSS (denoted as Ln-bpdc-POSS, Ln = Eu, Tb, Sm, Er, Nd, Yb)
An amount of binary lanthanide complex [LnL3(H2O)2] (L = tta, Ln = Eu, Sm, Er, Nd, Yb; L = tfacac, Ln = Tb) was added to a solution of bpdc-POSS in 100 mL DMF with a molar ratio of [LnL3(H2O)2]:bpdc-POSS = 8:1. The reaction mixture was heated under reflux at 95 °C for 8 h until the transparent solution turned into yellow color. The DMF was removed by rotary evaporation and dried overnight. Ln-bpdc-POSS was washed and obtained as a yellow powder. Eu-bpdc-POSS (C168H140O44N16S12Si8F36Eu4), 1H NMR (DMSO): δ 1.51–2.76 (48H, m, CH2), 2.41 (8H, s, NH), 7.75 (12H, s, CH), 7.80–8.42 (m, 48H, C4H4S) and 8.75–9.16 (m, 24H, C10H6N2).
2.5. Characterization
The detailed size and morphology of the synthesized nanomaterials were determined on a JEM-200CX microscope operated at 120 kV. Fourier-transform infrared (FT-IR) spectra were recorded in the 4000–400 cm−1 region on an American Thermo Nicolet Corporation model AVATAR370 FT-IR infrared spectrophotometer with the KBr pellet technique. X-ray diffraction (XRD) measurements were carried out on a D\max-2200 X-ray diffractometer using Cu Kα (λ = 1.54 Å) radiation. The 1H NMR spectrum was measured using a Bruker AVANCE-500 spectrometer with tetramethylsilane (TMS) as an internal reference (DMSO as a solvent). The excitation and emission spectra were recorded using an Edinburgh FLS920 fluorescence spectrometer equipped with a 450 W Xe-lamp as an excitation source and a monochromator iHR320 equipped with a liquid-nitrogen-cooled R5509-72 PMT as a detector. Thermogravimetric analysis (TGA) was performed on a Netzsch STA 499 at a heating rate of 10 °C min−1 under an air atmosphere.
3. Results and discussion
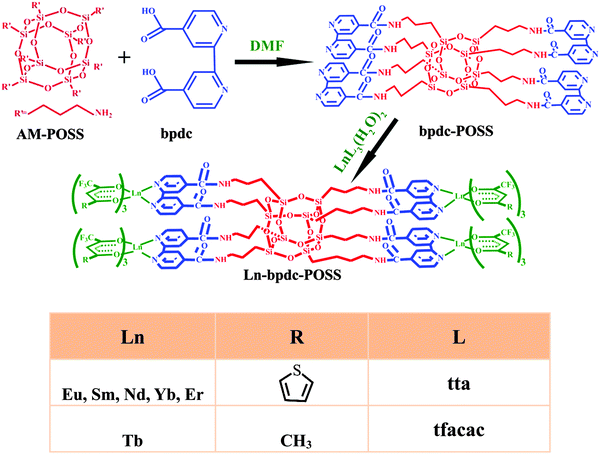
The preparation process of Ln-bpdc-POSS (Ln = Eu, Tb, Sm, Nd, Yb, Er) is shown in Scheme 1. The bpdc ligand was introduced to graft with the amino groups of AM-POSS by using the carboxylic groups. The double-functionalized bpdc ligand was employed to coordinate lanthanide ions via exchanging two water molecules from the first coordination sphere of the [LnL3(H2O)2] complex introduced, as well as to act as a ligand and sensitize the luminescence of lanthanide ions together with the first ligand β-diketonate. In this way, the lanthanide ternary derivatives are suggested to be synthesized and linked to the POSS host (see Scheme 1).
 |
| | Scheme 1 The synthetic procedure of Ln-bpdc-POSS (Ln = Eu, Tb, Sm, Nd, Yb, Er). | |
3.1. FT-IR spectra
The FT-IR spectra of OA-POSS, bpdc-POSS, and Ln-bpdc-POSS are shown in Fig. S1 (ESI†). As can be observed in Fig. S1 (ESI†), in the spectrum of OA-POSS the band at 1113 cm−1 can be attributed to the asymmetric stretching of Si–O–Si,38,39 which indicates the Si–O–Si structure of OA-POSS. In addition, the peak at 3024 cm−1 can be assigned to the ammonium ions of OA-POSS. It is worth noting that in the spectra of bpdc-POSS and Eu-bpdc-POSS, the bands ascribed to ammonium ions are very weak, and even almost disappear in the curve of Eu-bpdc-POSS. Moreover, in the spectrum of bpdc-POSS the new peak located at 3108 cm−1 can be attributed to the amide bond, which suggests the successful reaction between the carboxyl groups from bpdc and the amino groups of AM-POSS and the successful synthesis of bpdc-POSS. In addition, the band at 1627 cm−1 assigned to C![[double bond, length as m-dash]](https://www.rsc.org/images/entities/char_e001.gif) N groups and the band at 1714 cm−1 derived from CO bond can further illustrate that the bpdc ligand was bonded with AM-POSS. In the spectrum of Eu-bpdc-POSS, it shows a new peak at 1291 cm−1, ascribed to the C–F bond from the tta ligand, which may be indicative of the coordination between Eu(tta)3(H2O)2 and bpdc-POSS. Therefore, since the FT-IR spectra of Ln-bpdc-POSS (Ln = Tb, Sm, Nd, Er, Yb) are similar to that of Eu-bpdc-POSS, the FT-IR results suggest the synthesis of Ln-bpdc-POSS (Ln = Eu, Tb, Sm, Nd, Yb, Er).
N groups and the band at 1714 cm−1 derived from CO bond can further illustrate that the bpdc ligand was bonded with AM-POSS. In the spectrum of Eu-bpdc-POSS, it shows a new peak at 1291 cm−1, ascribed to the C–F bond from the tta ligand, which may be indicative of the coordination between Eu(tta)3(H2O)2 and bpdc-POSS. Therefore, since the FT-IR spectra of Ln-bpdc-POSS (Ln = Tb, Sm, Nd, Er, Yb) are similar to that of Eu-bpdc-POSS, the FT-IR results suggest the synthesis of Ln-bpdc-POSS (Ln = Eu, Tb, Sm, Nd, Yb, Er).
3.2. X-ray diffraction (XRD)
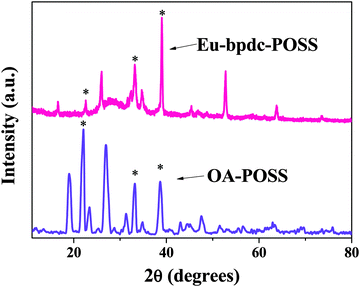
The wide angle XRD patterns of OA-POSS and Eu-bpdc-POSS are displayed in Fig. 1. It can be observed that the OA-POSS and Eu-bpdc-POSS both have multiple peaks at 10–40° (see in Fig. 1), which can be attributed to the Si–O–Si structure of OA-POSS. Compared with the pattern of OA-POSS, the multiple peaks (22°, 33° and 39°) of Eu-bpdc-POSS were nearly unchanged, which illustrates that the host Si–O–Si structure of Eu-bpdc-POSS is retained well after the functionalization of lanthanide complexes.
 |
| | Fig. 1 X-ray diffraction patterns of OA-POSS and Eu-bpdc-POSS (the standard multi-peaks are marked). | |
3.3. High-resolution transmission electron microscopy (HRTEM)
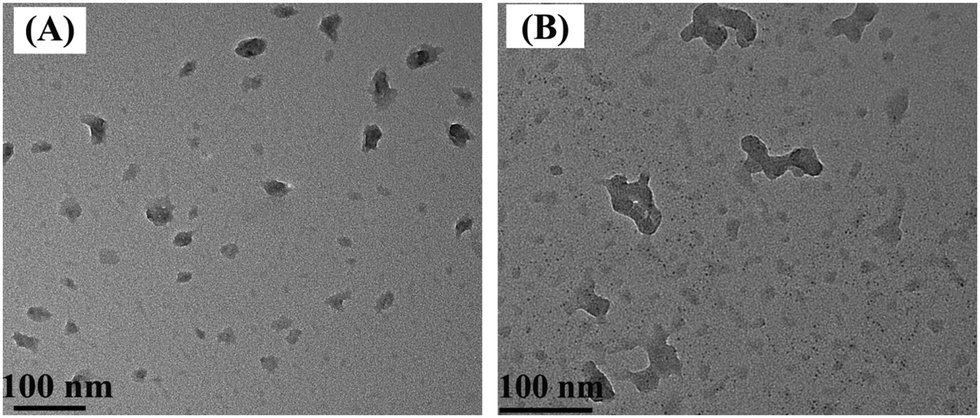
The morphologies of OA-POSS and as-prepared Eu-bpdc-POSS were investigated by HRTEM, as shown in Fig. 2. It can be observed that the OA-POSS shows a spherical morphology with excellent monodispersity with an average diameter of 30–35 nm. However, the Eu-bpdc-POSS shows some aggregation, which may be due to the reaction between the amino groups of AM-POSS and the carboxyl groups of another bpdc-POSS.
 |
| | Fig. 2 HRTEM images of OA-POSS dispersed in water (A) and Eu-bpdc-POSS dispersed in water (B). | |
3.4. Zeta-potential and electron dispersive X-ray spectroscopy (EDX)
In addition, the zeta-potential measurements of OA-POSS, bpdc-POSS and Eu-bpdc-POSS were carried out and displayed in Fig. S2 (ESI†), which are 14.8 mV, 31.5 mV and 23.2 mV, respectively. And the functionalization of bpdc-POSS and Eu-bpdc-POSS can be suggested by tracking the surface properties of the corresponding materials through zeta-potential data. And the EDX results of OA-POSS and Eu-bpdc-POSS are shown in Fig. S3 (ESI†), respectively, which can further illustrate that the Eu ternary complex was formed and bonded to the POSS host by the presence of the elements (Eu, O, N).
3.5. Fluorescence studies
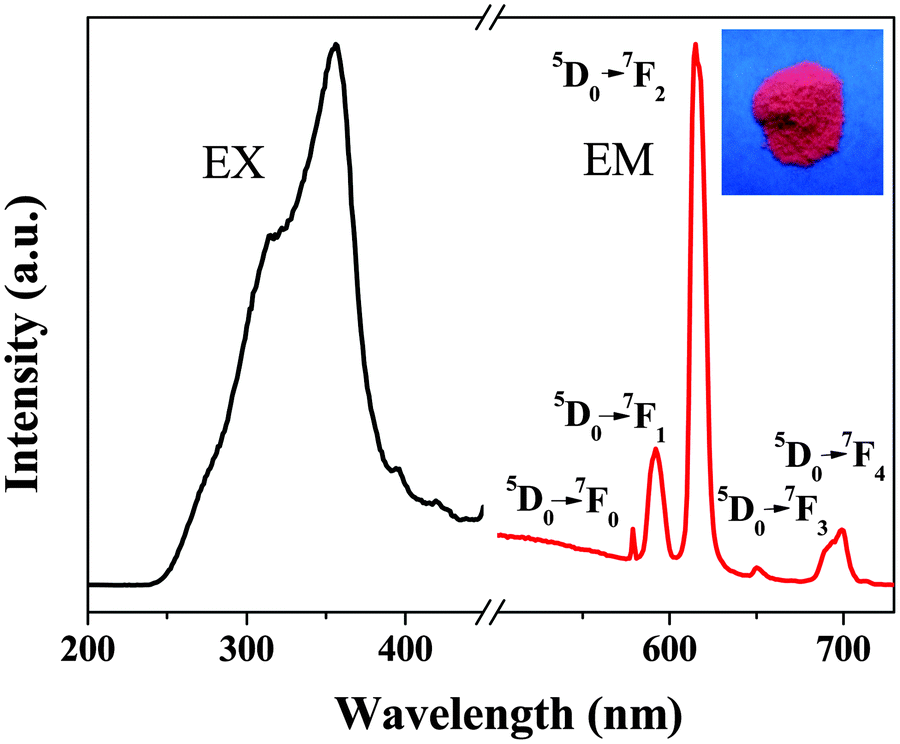
The UV-visible absorption spectrum of Eu-bpdc-POSS was recorded in DMSO solution (shown in Fig. S4, ESI†). It displays a broad band in the region from 260 nm to 330 nm, which can be attributed to the singlet–singlet π → π* absorption of the ligands (tta and bpdc). Fig. 3 shows the fluorescence spectra of Eu-bpdc-POSS and the inset is a photograph of the Eu-bpdc-POSS material under UV light excitation. As shown in Fig. 3, the excitation spectrum was obtained by monitoring the 5D0 → 7F2 transition of Eu3+ ions at 615 nm. A broad band from 250 nm to 400 nm can be observed, attributed to the efficient absorption of the tta and bpdc ligands. Under excitation at 355 nm, the emission spectrum of Eu-bpdc-POSS exhibits five prominent peaks, at 579 nm, 592 nm, 614 nm, 650 nm, and 702 nm, ascribed to the 5D0 → 7FJ (J = 0, 1, 2, 3, 4 and 5) transitions of Eu3+, respectively, with the red emission of the (5D0 → 7F2) transition as the strongest. Furthermore, the full width at half-maximum (FWHM) of the strongest emission peak is approximately 9 nm, indicating a high color purity of Eu-bpdc-POSS. When illuminated under the UV light (peak wavelength at 365 nm), the Eu-bpdc-POSS material displays bright-red luminescence (inset of Fig. 3), indicating the energy transfer between the ligands and Eu3+ in the material.
 |
| | Fig. 3 Fluorescence spectra of the Eu-bpdc-POSS material: the excitation (λem = 615 nm) and emission (λex = 355 nm) spectra. The inset is the digital photograph taken under UV light (λmax = 254 nm). | |
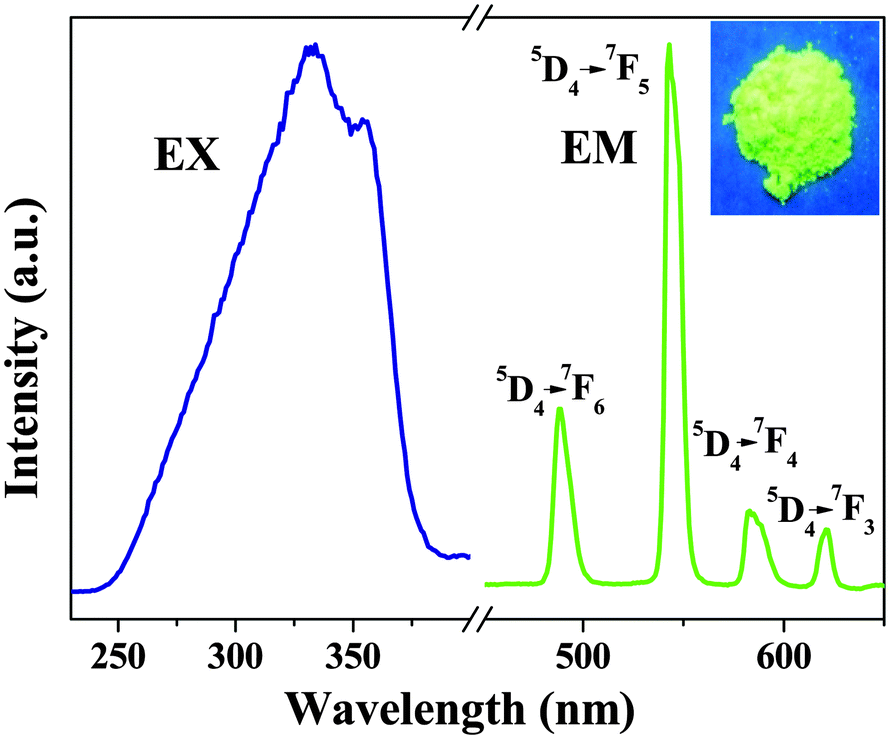
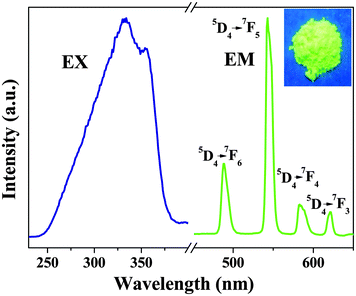
The design of efficient luminescence hybrid materials based on lanthanide complexes maintains active investigation. Many research studies have focused on sensitizers with a triplet state matching the receiving lanthanide ion energy level so that efficient energy transfer can be obtained. For the Htta ligand, it has been reported that the triplet state energy level is 20400 cm−1, which is close to the 5D4 level of Tb3+ ions40 (20545 cm−1). This small energy gap would permit energy back transfer, 5D4 → T (where T is the triplet ligand state). As a result, the 5D4-luminescence of the Tb3+ ion is almost completely quenched by the energy back transfer upon excitation of the ligand absorption.30 So to match well with the 5D4 level of Tb3+ ions, the Htfacac ligand, whose triplet state is 22720 cm−1,40 was selected as a main sensitizer for Tb3+ ion luminescence, and of importance is the observation of efficient Tb3+ ion emission from the Tb-bpdc-POSS material. Fig. 4 shows the excitation and emission spectra of the Tb-bpdc-POSS material. The excitation spectrum shows broad bands from 250 nm to 400 nm due to the absorption of the organic ligands. After ligand-mediated excitation at 333 nm, the emission spectrum of Tb-bpdc-POSS shows the characteristic emission of Tb3+ ions at 488, 545, 584 and 614 nm, attributed to 5D4 → 7FJ (J = 6, 5, 4 and 3) transitions, respectively. In addition, the FWHM of the strongest band (at 545 nm) is less than 12 nm, which indicates that the Tb-bpdc-POSS material exhibits a high color purity. The inset of Fig. 4 displays the digital photograph of Tb-bpdc-POSS under UV light excitation at room temperature, which shows the bright green luminescence.
 |
| | Fig. 4 Fluorescence spectra of Tb-bpdc-POSS materials: the excitation (λem = 545 nm) and emission (λex = 333 nm) spectra. The inset is the digital photograph taken under UV light (λmax = 254 nm). | |
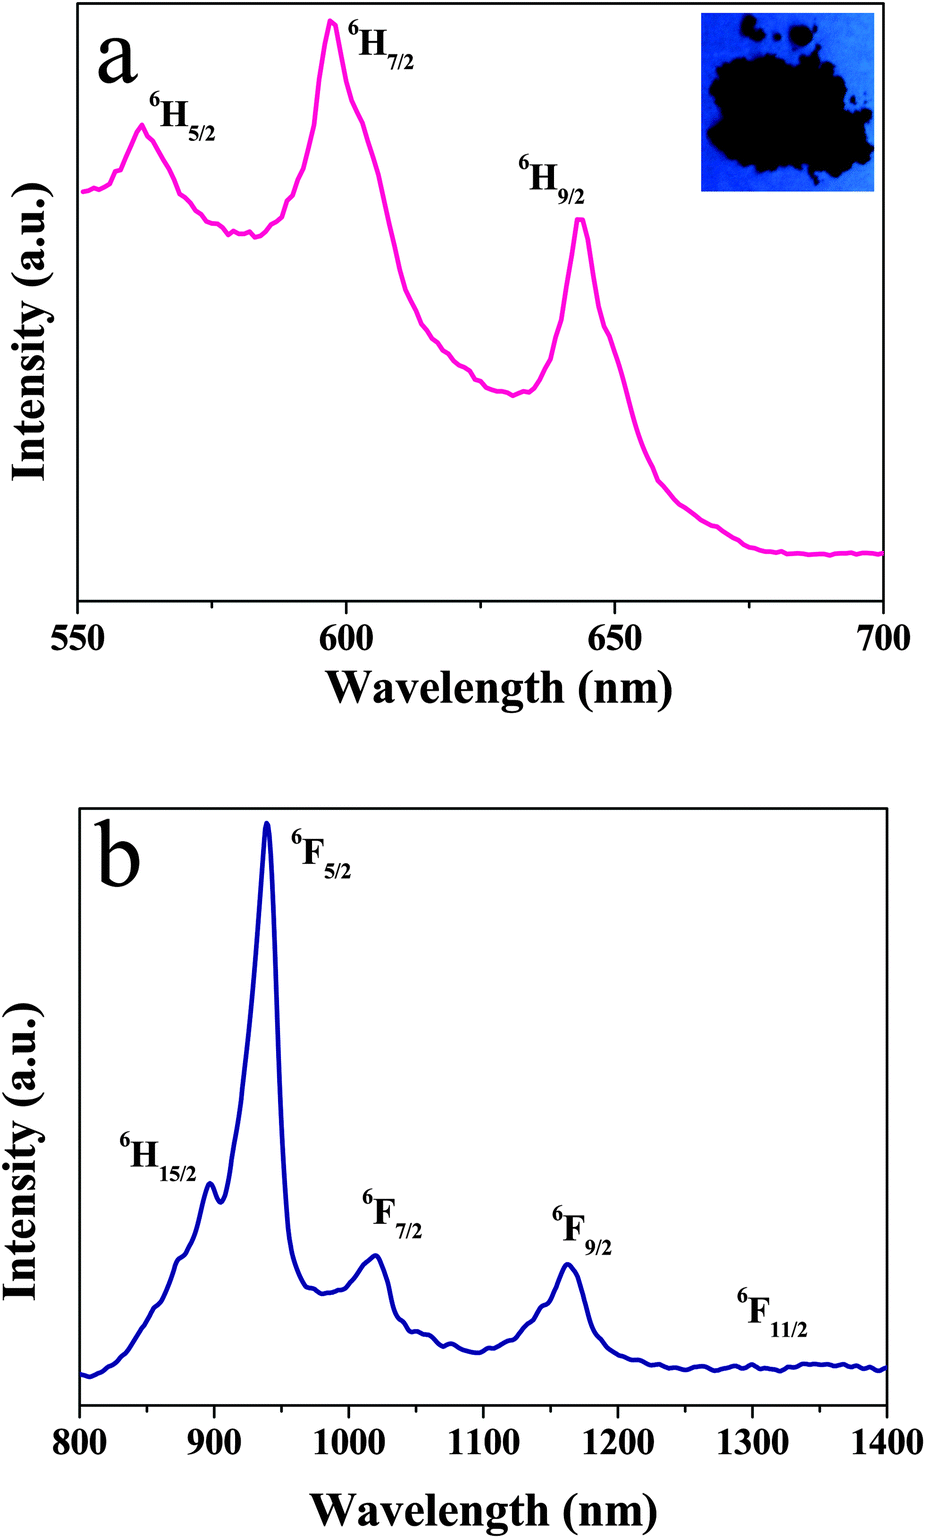
The excitation spectra of Ln-bpdc-POSS (Ln = Sm, Nd, Er) are very similar to that of Eu-bpdc-POSS and will not be shown here. The emission spectra of Sm-bpdc-POSS were displayed in Fig. 5, which show emissions in both visible and NIR regions. Under excitation at 353 nm, the emission spectrum in the visible region (Fig. 5a) shows the characteristic peaks of Sm3+ consisting of 563 nm (4G5/2 → 6H5/2), 597 nm (4G5/2 → 6H7/2) and 644 nm (4G5/2 → 6H9/2), in which the 4G5/2 → 6H7/2 transition at 597 nm is the strongest one. And the inset of Fig. 5 shows the photograph of Sm-bpdc-POSS under UV light excitation at room temperature. The NIR emission spectrum of Sm-bpdc-POSS was obtained under excitation at 353 nm (Fig. 5b), which shows that the emission bands attributed to the transition from the 4G5/2 level to 6H15/2 and 6FJ levels (J = 5/2, 7/2, 9/2, and 11/2), respectively. The 4G5/2 → 6F5/2 transition at 939 nm is the most strongest one.41,42
 |
| | Fig. 5 The emission spectra of Sm-bpdc-POSS materials: (a) the emission (λex = 353 nm) spectrum in the visible region, (b) the emission spectrum (λex = 353 nm) in the NIR region. The inset is the digital photograph under UV light excitation (λmax = 254 nm). | |
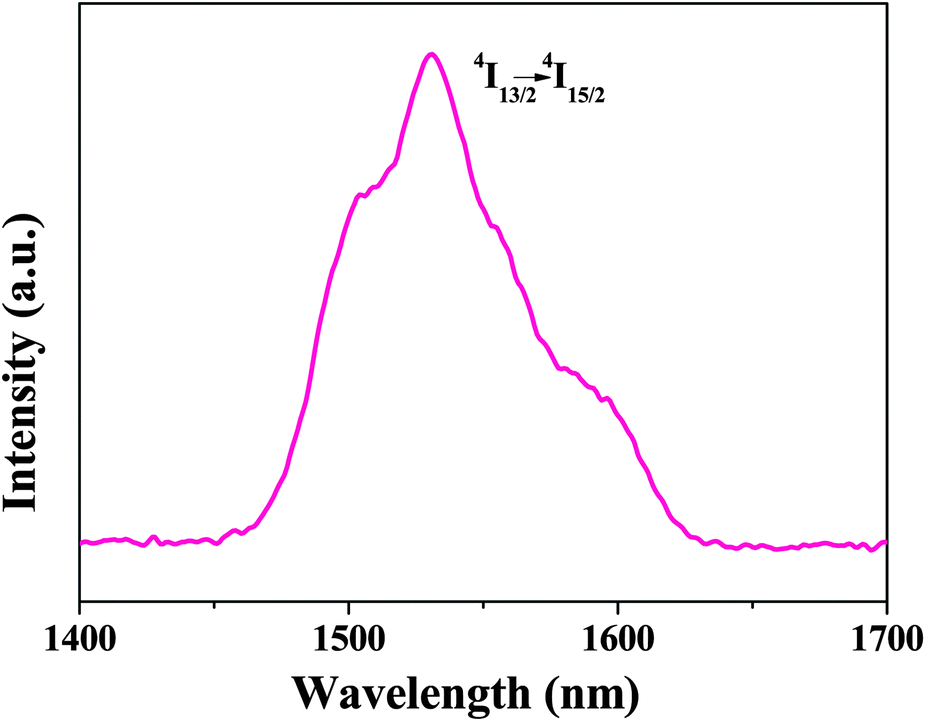
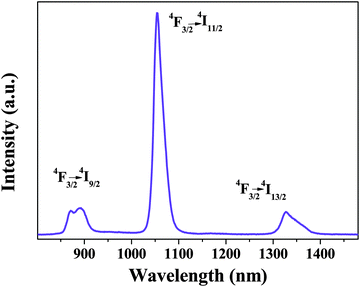
Fig. 6 shows the NIR emission spectrum of Nd-bpdc-POSS. Upon excitation at the ligand absorption (at 337 nm), the emission curve consists of three bands ranging from 800 nm to 1400 nm, with the strongest emission band at 1054 nm (4F3/2 → 4I11/2) and two other bands at 890 nm (4F3/2 → 4I9/2) and 1325 nm (4F3/2 → 4I13/2), respectively. Moreover, the solid materials containing Nd3+ ions have been regarded as the ideal luminescent materials in laser system applications (1.06 μm emission),43 and the emission peak at 1.3 μm has potential application for optical amplification at 1.3 μm, which is an important telecommunication window.44 As shown in Fig. 7, the emission spectrum of Er-bpdc-POSS shows a broad NIR emission band centered at 1530 nm, which is attributed to the 4I13/2 → 4I15/2 transition of Er3+ ions, covering a large spectral range extending from 1450 nm to 1640 nm. The erbium-doped materials have always attracted much attention in the field of optical amplification because the transition at around 1.54 μm matches well with one of the fiber low-loss windows and is in the right position of the third telecommunication window. To enable a wide gain bandwidth for optical amplification, a broad emission band is desirable. In this case, the FWHM value of the emission band for Er-bpdc-POSS is 76 nm, which is broad in comparison with other Er-doped materials and is necessary for getting a wide gain bandwidth for optical amplification.43
 |
| | Fig. 6 The emission spectrum of the Nd-bpdc-POSS material (λex = 337 nm). | |
 |
| | Fig. 7 The emission spectrum of the Er-bpdc-POSS material (λex = 374 nm). | |
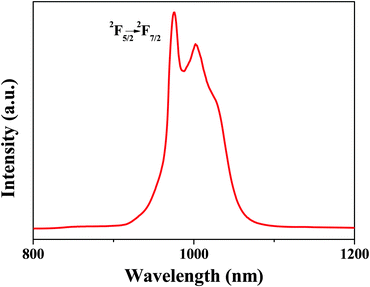
Compared with other lanthanide complex-functionalized POSS materials, the excitation spectrum of Yb-bpdc-POSS (monitored at 976 nm) covers from 250 nm to 590 nm, extending to the visible region, shown in Fig. S5 (ESI†). Upon visible light excitation (λex = 465 nm), the obtained emission spectrum of Yb-bpdc-POSS (see Fig. 8) shows a broad band in the region of 910 nm to 1100 nm with the characteristic peak at 976 nm, which is assigned to the typical 2F5/2 → 2F7/2 transition. It should be noticed that the emission band of Yb-bpdc-POSS has a shoulder at longer wavelength instead of a single sharp band. The phenomenon may be caused from the splitting of the energy levels of Yb3+ leading to a ligand field effect. Different from other lanthanide ions, Yb3+ ions have relatively simple energy levels, with single excited state 2F5/2 and ground state 2F7/2, and a large energy gap of 10200 cm−1. Therefore, the materials containing Yb3+ ions with less sensitivity to non-radioactive deactivations can be applied in laser systems. Furthermore, the materials based on Yb3+ ions are attractive for applications in deeper tissue penetration and no competing fluorescence from biomatrices.34 Of importance here is that, the Yb-bpdc-POSS material shows the strong NIR emission under excitation with the visible light and exhibits an average diameter of around 50 nm with good monodispersity in DMSO, which affords extremely excellent advantages in biomedical fields.
 |
| | Fig. 8 The emission spectrum of the Yb-bpdc-POSS material (λex = 465 nm). | |
As described above, the visible and NIR-luminescence was obtained in the corresponding Ln-bpdc-POSS (Ln = Eu, Tb, Sm, Nd, Er, Yb) materials following the excitation of UV/visible absorption of the organic ligands, respectively. That is to say, the observed emissions do arise by sensitizing the lanthanide ions from the organic ligands moiety, because no absorption of the lanthanide ions occurs at the corresponding excitation wavelengths. Thus, it is obvious that the intramolecular energy transfer does happen between the ligands (L and bpdc) and the lanthanide ions. Therefore, it is reasonable to conclude that the LnL3bpdc complexes are formed and linked to the POSS matrix. In addition, to investigate whether Ln-bpdc-POSS materials are stable, the Ln-bpdc-POSS (Ln = Eu, Tb, Sm) materials were placed over a period of 3 months under excitation with UV light sometimes. There was no obvious change for appearance and fluorescence under UV illumination (see Fig. S6, ESI†), which is responsible for their optical and biomedical applications.
3.6. Thermogravimetric analysis (TGA)
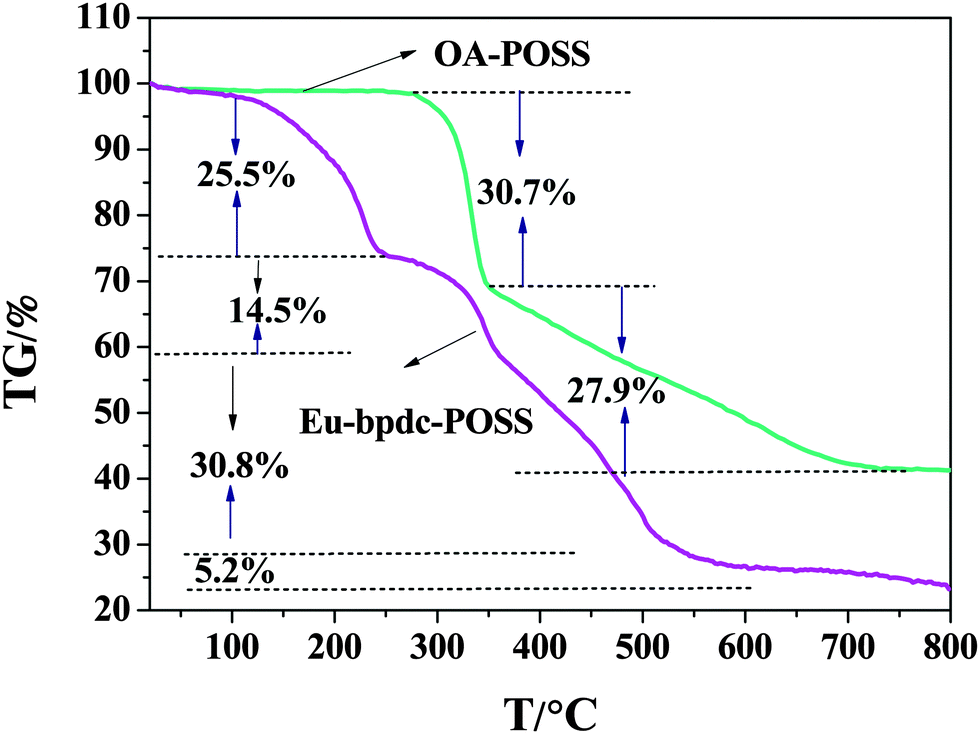
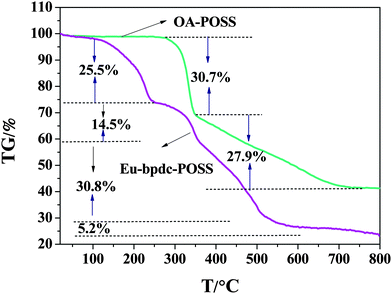
The thermal stability of POSS and Eu-bpdc-POSS was evaluated by thermogravimetric analysis (TGA) at a heating rate of 10.0 °C min−1 (see Fig. 9). The TGA curves of other Ln-bpdc-POSS (Ln = Tb, Sm, Nd, Er, Yb) materials are quite similar to that of Eu-bpdc-POSS, which is given as an example. From the TGA curve of OA-POSS, two main steps of weight loss can be observed. The first weight loss with approximately 30.7% below 345 °C can be ascribed to the decomposition of the side chains of OA-POSS. The second one (about 27.9%) in the temperature range of 345 °C to 732 °C can be presumably attributed to the decomposition of the Si–O–Si skeleton. As for the thermal curve of Eu-bpdc-POSS, four degradation steps can be clearly observed. The first weight loss of 25.5% corresponds to the desorption of physically absorbed water and residual solvents and the decomposition of the excess bpdc ligand. The second weight loss is about 14.5% from 250 °C to 358 °C, which is ascribed to the thermal decomposition of the tta ligand. Then it is followed by two stages of weight loss, which is assigned to the decomposition of the bpdc ligand and the Si–O–Si structure of the cage. In comparison with the TGA curve of the binary lanthanide complex Eu(tta)3(H2O)2,37 the thermal stability of Eu-bpdc-POSS is significantly improved due to the introduction into the POSS matrix by protecting the lanthanide complexes. The luminescent materials possessing excellent thermal stability can be applied for producing an electroluminescent device.
 |
| | Fig. 9 Thermogravimetry (TG) curves of OA-POSS and Eu-bpdc-POSS. | |
4. Conclusion
In summary, a new series of multi-color lanthanide complex-functionalized POSS with visible (Eu3+, Tb3+, Sm3+) and near infrared (Sm3+, Nd3+, Er3+, Yb3+) luminescence were synthesized by covalent linking with ternary lanthanide complexes. The obtained Ln-bpdc-POSS materials (Ln = Eu, Tb, Sm, Er, Nd, Yb) can be excited to get their characteristic visible or near-infrared emissions. It is worth noting that the near-infrared-luminescent Ln-bpdc-POSS materials are new and have not been reported in the open literature so far. And the six Ln-bpdc-POSS (Ln = Eu, Tb, Sm, Nd, Yb, Er) hybrid materials exhibit multicolor emission covered from the visible to near-infrared region (450–1700 nm) and are highly desired due to their potential applications in areas including optical amplification, biomedical fields, and lasers. The method offers advantages including the ease of synthesis and handling, as well as extending the use of POSS and expanding the field of luminescent inorganic–organic hybrid materials based on lanthanides.
Acknowledgements
We are grateful for the financial support from the National Natural Science Foundation of China (Grant No. 21231004, 21201117), the Innovation Program of Shanghai Municipal Education Commission (13ZZ073), the Science and Technology Commission of Shanghai Municipality (13NM1401100, 13NM1401101, 14520722200), Shanghai Rising-Star Program (14QA1401800), and the project from State Key Laboratory of Rare Earth Resource Utilization (RERU2014012). We are also grateful to Instrumental Analysis & Research Center of Shanghai University.
Notes and references
- F. J. Feher, D. A. Newman and J. F. Walzer, J. Am. Chem. Soc., 1989, 111, 1741 CrossRef CAS.
- J. F. Brown and L. H. Vogt, J. Am. Chem. Soc., 1965, 87, 4313 CrossRef CAS.
- J. J. Scwab and J. D. Lichtenhan, Appl. Organomet. Chem., 1998, 707 CrossRef.
- R. A. Mantz, P. F. Johes, K. P. Chafee, J. D. Lichtenhan, J. W. Gilman, I. M. K. Ismail and M. J. Burmeister, Chem. Mater., 1996, 8, 1250 CrossRef CAS.
- G. Ligadas, J. C. Ronda and M. Gali, Biomacromolecules, 2006, 7, 3521 CrossRef PubMed.
- V. K. Daga, E. R. Anderson, S. P. Gido, S. P. Gido and J. J. Watkins, Macromolecules, 2011, 44, 6793 CrossRef CAS.
- J. H. J. Choi, A. F. Yee, Q. Zhu and R. M. Laine, J. Am. Chem. Soc., 2001, 123, 11420 CrossRef CAS PubMed.
- A. V. Y. Wang, H. Yang, S. Gupta, F. Hetsch, S. V. Kershaw, W. Y. Teoh, H. Li and A. L. Rogach, J. Phys. Chem. C, 2013, 117, 1857 Search PubMed.
- A. S. V. I. Jerman, M. Kozelj, B. Orel and J. Kovac, Langmuir, 2008, 24, 3123 CrossRef PubMed.
- M. Janssen, J. Wilting, C. Muller and D. Vogt, Angew. Chem., Int. Ed., 2010, 49, 7738 CrossRef CAS PubMed.
- F. J. Feher, J. Am. Chem. Soc., 1986, 108, 3850 CrossRef CAS.
- D. A. N. F. J. Feher and J. F. Walzer, J. Am. Chem. Soc., 1989, 111, 1741 CrossRef.
- K. K. Y. Kim, M. F. Roll, R. M. Laine and A. J. Matzger, Macromolecules, 2010, 43, 6995 CrossRef.
- W. W. M. Seino, J. E. Lofgreen, D. P. Puzzo, T. Manabe and G. A. Ozin, J. Am. Chem. Soc., 2011, 133, 18082 CrossRef PubMed.
- L. Zhang, H. C. L. Abbeehuis, Q. H. Yang, Y. M. Wang, P. C. M. M. Magusin, B. Mezari, R. A. van Santen and C. Li, Angew. Chem., Int. Ed., 2007, 46, 5003 CrossRef CAS PubMed.
- H. F. L. S. W. Kuo, W. J. Huang, K. U. Jeong and F. C. Chang, Macromolecules, 2011, 42, 1619 CrossRef.
- E. V. S. I. L. Odinets, O. I. Artyshin, K. A. Lyssenko, Y. V. Nelyubina, G. V. Myasoedova, N. P. Molochnikova and E. A. Zakharchenro, Dalton Trans., 2010, 39, 4170 RSC.
- A. F. O. Monticelli, E. S. Cozza, M. Prato and V. Bruzzo, J. Mater. Chem., 2011, 21, 18049 RSC.
- K. Y. Pu, K. Li and B. Liu, Adv. Mater., 2010, 22, 643 CrossRef CAS PubMed.
- I. G. M. A. Costela, L. Cerdan, V. Martin, O. Garcia and R. Sastre, Adv. Mater., 2009, 21, 4163 CrossRef.
- H. W. F. Du, Y. Bao, B. Liu, H. Zheng and R. Bai, J. Mater. Chem., 2011, 21, 10859 RSC.
- M. Liras, M. Pintado-Sierra, F. Amat-Guerri and R. Sastre, J. Mater. Chem., 2011, 21, 12803 RSC.
- F. Du, Y. Bao, B. Liu, J. Tian, Q. Li and R. Bai, Chem. Commun., 2013, 49, 4613 RSC.
- H. Liu, S. Kondo, N. Takeda and M. Unno, J. Am. Chem. Soc., 2008, 13, 10074 CrossRef PubMed.
- S. Kuo and F. Chang, Prog. Polym. Sci., 2011, 36, 1649 CrossRef CAS.
- A. Luo, X. Jiang, H. Lin and J. Yin, J. Mater. Chem., 2011, 21, 12753 RSC.
- X. Zhao, S. Wang, W. Zhang, J. Qiu, Y. Wu, H. Liu, C. Xu and X. Hao, RSC Adv., 2014, 4, 598 RSC.
- J. Feng and H. Zhang, Chem. Soc. Rev., 2013, 42, 387 RSC.
- Y. Liu, L. Sun, J. Liu, Y. X. Peng, X. Ge, L. Shi and W. Huang, Dalton Trans., 2015, 44, 237 RSC.
- L. N. Sun, J. B. Yu, H. J. Zhang, Q. G. Meng, E. Ma, C.-Y. Peng and K. Y. Yang, Microporous Mesoporous Mater., 2007, 98, 156 CrossRef CAS.
- J. Xu, Z. Sun, L. Jia, B. Li, L. Zhao, X. Liu, Y. Ma, H. Tian, Q. Wang, W. Liu and Y. Tang, Dalton Trans., 2011, 40, 12909 RSC.
- J.-N. Hao and B. Yan, J. Mater. Chem. C, 2014, 2, 6758 RSC.
- Y. Lu and B. Yan, J. Mater. Chem. C, 2014, 2, 5526 RSC.
- L. Sun, Y. Qiu, T. Liu, J. Z. Zhang, S. Dang, J. Feng, Z. Wang, H. Zhang and L. Y. Shi, ACS Appl. Mater. Interfaces, 2013, 5, 9585 CAS.
- L. Maggini, M. E. Fustos, T. W. Chamberlain, C. Cebrian, M. Natali, M. Pietraszkiewicz, O. Pietraszkiewicz, E. Szekely, K. Kamaras, L. De Cola, A. N. Khlobystov and D. Bonifazi, Nanoscale, 2014, 6, 2887 RSC.
- J. Cuan and B. Yan, RSC Adv., 2013, 3, 20077 RSC.
- X. Chen, P. Zhang, T. Wang and H. R. Li, Chem. – Eur. J., 2014, 20, 2551 CrossRef CAS PubMed.
- G. C. C. Marcolli, Appl. Organomet. Chem., 1999, 13, 213 CrossRef.
- W. F. Sager, N. Filipescu and F. A. Serafin, J. Phys. Chem. C, 1965, 69, 1092 CrossRef CAS.
- Y. X. Zheng, J. Lin, Y. J. Liang, Q. Lin, Y. N. Yu, Q. G. Meng, Y. H. Zhou, S. B. Wang, H. Y. Wang and H. J. Zhang, J. Mater. Chem., 2001, 11, 2615 RSC.
- L. N. Sun, Z. J. Wang, J. Z. Zhang, J. Feng, J. Liu, Y. Zhao and L. Y. Shi, RSC Adv., 2014, 4, 28481 RSC.
- P. S. Calefi, A. O. Ribeiro, A. M. Pires and O. A. Serra, J. Alloys Compd., 2002, 344, 285 CrossRef CAS.
- L. N. Sun, S. Dang, J. B. Yu, J. Feng, L. Y. Shi and H. J. Zhang, J. Phys. Chem. B, 2010, 114, 16393 CrossRef CAS PubMed.
- L. N. Sun, W. P. Mai, S. Dang, Y. N. Qiu, W. Deng, L. Y. Shi, W. Yan and H. J. Zhang, J. Mater. Chem., 2012, 22, 5121 RSC.
Footnote |
| † Electronic supplementary information (ESI) available: FT-IR spectra of OA-POSS, bpdc-POSS, and Eu-bpdc-POSS. The ZETA potential charge of OA-POSS, bpdc-POSS and Eu-bpdc-POSS. EDX spectra of OA-POSS and Eu-bpdc-POSS. The UV-vis absorption spectrum of Eu-bpdc-POSS. The excitation spectrum of Yb-bpdc-POSS materials. The digital photographs of Eu-bpdc-POSS, Tb-bpdc-POSS and Sm-bpdc-POSS, taken under the natural light and UV light after one week and three months, respectively. See DOI: 10.1039/c5nj02105g |
|
| This journal is © The Royal Society of Chemistry and the Centre National de la Recherche Scientifique 2016 |
Click here to see how this site uses Cookies. View our privacy policy here.