DOI:
10.1039/C5NJ02081F
(Paper)
New J. Chem., 2016,
40, 231-237
Improved CO2 adsorption capacity and cyclic stability of CaO sorbents incorporated with MgO
Received
(in Montpellier, France)
7th August 2015
, Accepted 23rd October 2015
First published on 27th October 2015
Abstract
Calcium oxide (CaO) sorbents incorporated with magnesium oxide (MgO) were synthesized using a co-precipitation route. The sorbents were prepared with different MgO concentrations (from 5 wt% to 30 wt%). The as-prepared sorbents were characterized using X-ray diffraction (XRD), field emission scanning electron microscopy (FE-SEM), energy dispersive X-ray spectroscopy (EDX) and BET surface area analysis techniques. The sintering effect of CaO sorbents was decreased after the incorporation of MgO. The sorbents with 5 wt% and 10 wt% of MgO retained their CO2 adsorption capacity over multiple cycles. Most importantly, CaO with 10 wt% MgO showed constant CO2 adsorption capacity over 30 carbonation cycles. The results revealed that CaO with 10 wt% MgO is sufficient to produce sorbents with high surface area, good structural stability and enhanced CO2 adsorption capacity.
1. Introduction
The combustion of fossil fuels from electricity generation or transportation is the major source of the anthropogenic emissions of CO2 greenhouse gas. To mitigate the global climate deterioration, large scale CO2 capture and sequestration (CCS) has been proposed. The alkaline earth metal oxides play a major role in CO2 adsorption, in which CO2 molecules can be adsorbed to form mono- or multidentate species.1 Among the oxide adsorbents, calcium oxide (CaO) and magnesium oxide (MgO) are prominent, since they have the ability to adsorb equimolar CO2 by the carbonation reaction. However the adsorption capacity of CaO decreases during repeated adsorption–desorption cycles.2 The performance of CaO is improved by various methods such as hydration treatment using water or steam (during carbonation, calcination and separate hydration treatment on CaO/CaCO3), thermal pretreatment of natural minerals and synthesis of sintering resistant sorbents.3 Among them, the synthesis of sintering resistant CaO sorbents with the incorporation of an inert support is the best method to improve the cyclic stability.
The stability of CaO sorbents during cyclic runs can be achieved via the incorporation of inert support materials such as MgO,1,4–12 TiO2,13–15 Al2O3,1,8,13,15–17 ZrO2,15,18,19 CeO2,20 Mn2O3,20 La2O3,7,17 Y2O321 and Nd2O3.22 Among the available inert materials, MgO is much cheaper and most promising for CO2 capture.23 Furthermore, MgO has high stability and a high Tammann temperature (1400 °C – Tammann temperature is approximately half of the melting point, and it is considered to be the minimum temperature where the sintering occurs). MgO will not adsorb CO2 at the CaO reaction temperature and also it will not react with CaO or CaCO3 under the operating conditions. The Tammann temperature of CaO is 1285 °C, whereas the Tammann temperature of CaCO3 is only 412 °C. Therefore, the sorbent is affected by the sintering effect when the reaction is performed above the Tammann temperature. It is hoped that the presence of MgO would suppress the sintering of CaO and CaCO3. Summaries of previous studies on CaO–MgO sorbents are shown in Table 1. They have been used as a benchmark for our current research work.
Table 1 Summary of the CO2 adsorption capacity of CaO–MgO sorbents prepared by co-precipitation
| Precursors |
CaO![[thin space (1/6-em)]](https://www.rsc.org/images/entities/char_2009.gif) :MgO ratio :MgO ratio |
Synthesis method |
Hydration |
Precipitating agent |
Temperatures (°C) |
CO2 sorption (%) at 10 cycles |
Method |
Ref. |
| Carbonation |
Decarbonation |
| Ca(NO3)2·3H2O and Mg(NO3)2·6H2O |
75:25 |
Co-precipitation |
Hydration |
Na2CO3 |
700 |
700 |
40 |
TGA |
5
|
| Ca(NO3)2·3H2O and Mg(NO3)2·6H2O |
50:50 |
Co-precipitation |
Hydration |
Na2CO3 |
700 |
700 |
30 |
TGA |
5
|
| Ca(NO3)2·3H2O and Mg(NO3)2·6H2O |
25:75 |
Co-precipitation |
Hydration |
Na2CO3 |
700 |
700 |
18 |
TGA |
5
|
| CaO and MgO |
58:42 |
Dry physical mixing |
— |
— |
758 |
758 |
42 |
TGA |
6
|
| CaO and MgO (2-propanol) |
58:42 |
Wet physical mixing |
— |
— |
758 |
758 |
42 |
TGA |
6
|
| Calcium acetate and magnesium acetate |
58:42 |
Solution mixing |
— |
— |
758 |
758 |
38 |
TGA |
6
|
| Calcium acetate and magnesium acetate |
58:42 |
Co-precipitation |
No hydration |
Na2CO3 |
758 |
758 |
14 |
TGA |
6
|
| CaCO3 and Mg(NO3)2 (tetrahydrofuran (THF)) |
80:20 |
Wet mixing |
— |
— |
750 |
750 |
37 |
TGA |
7
|
| CaO–Mg(NO3)2 solution/MgO |
63:37 |
Co-precipitation 75 °C |
Hydration |
Na2CO3 |
750 |
750 |
8 |
Bench-scale fluidized bed |
8
|
| Calcium D-gluconate, magnesium D-gluconate (distilled water) |
33:67 |
Wet mixing |
— |
— |
650 |
900 |
39 |
TGA |
9
|
| Ca(NO3)2·3H2O and Mg(NO3)2·6H2O |
25:75 |
Co-precipitation |
Hydration |
Na2CO3 |
750 |
750 |
40 |
TGA |
11
|
| Calcium nitrate and magnesium nitrate |
80:20 |
Sol–gel |
Hydration (steam) |
— |
650 |
950 |
35 |
TGA |
23
|
Table 1 clearly shows that most of the CO2 adsorption was carried out between 700 °C and 758 °C. In the literature, the highest CO2 adsorption capacity of 40% (30–40%, 7–9 mmol CO2 per g sorbent) was attained for CaO with 25 to 75 wt% (18–40%, 4–9 mmol CO2 per g sorbent) of MgO.11 Park et al. claimed that the adsorption capacity was increased with the increase of the MgO content.5 The inert portion performed as a skeleton to maintain its microstructure over multiple carbonation and decarbonation cycles. Even though the incorporation of inert materials in CaO increases the adsorption capacity, the operating costs are high due to the presence of a huge amount of inert materials. Furthermore, it would not be very useful if the content of CaO is small because excess heat would be wasted to warm up MgO. If the CaO adsorbent is used alone, CaO is converted to CaCO3 during the carbonation step. The CaCO3 layer formed around the adsorbent will limit the mass transfer of CO2 to CaO. Therefore, it would be ideal to determine the optimum content of MgO that provides a CaO based adsorbent with a weight gain that is equivalent to pure CaO with good cyclic stability during carbonation/decarbonation. This is one of the main focuses of this research work. CaO–MgO sorbents were prepared via a co-precipitation method. The cyclic stability of the sorbents during multiple carbonation/decarbonation cycles was also investigated.
2. Experimental
2.1 Preparation of sorbents
Calcium nitrate, magnesium nitrate, sodium hydroxide and ethanol were purchased from Sigma-Aldrich. All the chemicals used were of analytical grade and were used without further purification. Deionized water (DIW) was used for the synthesis of sorbents.
Ca(NO3)2·4H2O and Mg(NO3)2·6H2O were used as precursors, while ethanol and DIW were used as solvents (78 ml of ethanol and 2 ml of DIW was used based on the optimized parameter in this study). The CaO:MgO weight % was varied as 95:05, 90:10, 85:15, 80:20 and 70:30. Both the precursors (Ca and Mg) were mixed simultaneously in the solvent and heated in a water bath at 35 °C. Then, 30 ml of 0.1 M NaOH was added dropwise into the mixture. The mixture was vigorously stirred for different reaction times at 35 °C. The obtained precipitates were collected by centrifugation and washed several times with DIW and ethanol to remove all impurities. The precipitates were then dried at 60 °C in air overnight. Finally, calcination was carried out in air at 650 °C and 800 °C for 2 h using a muffle furnace with a heating rate of 10 °C min−1.The samples were named according to their composition: C95M5 for the sample with 95 wt% CaO and 5 wt% MgO, C90M10 for the sample with 90 wt% CaO and 10 wt% MgO, C85M15 for the sample with 85 wt% CaO and 15 wt% MgO, C80M20 for the sample with 80 wt% CaO and 20 wt% MgO and C70M30 for the sample with 70 wt% CaO and 30 wt% MgO.
X-ray diffraction (XRD) measurements were employed for the identification of crystalline phases using a Philips PW1729 powder X-ray diffractometer with a Cu Kα radiation source (wavelength = 1.5406 Å) and operated at 45 kV and 40 mV in the 2 theta range of 10° to 80°. Field emission scanning electron microscopy (FESEM) measurements were performed on the synthesized sorbents to obtain information on morphology (Zeiss SUPRA 35VP). BET (Brunauer–Emmett–Teller) surface area and pore size distribution analysis were conducted by N2/physisorption at 77 K using a Quantachrome Autosorb-I machine. The CO2 uptake (carbonation and decarbonation performance) of the sorbent was measured using a thermogravimetric analyzer (TGA, STA 6000, Perkin Elmer).
2.2 CO2 adsorption tests
The carbonation was conducted at 650 °C for 30 min in 100% CO2, while the decarbonation was carried out at 800 °C for 10 min in 100% N2. About 10 mg of the sorbent was placed in an alumina crucible and the sample was first activated by heating it at room temperature under an N2 atmosphere. The flow rate of gas was adjusted to 20 ml min−1 by a mass flow controller. Once the carbonation temperature was reached and stabilized, pure CO2 (100%) was introduced, while the change in the sample weight was recorded. The weight and temperature of the sample were continuously monitored and recorded during the entire carbonation–decarbonation process. The CO2 adsorption capacity of the sample was calculated from the weight change. The flue gas released from power plants mainly contains about 15% of CO2. Hence, the adsorption capacity of the sorbents was also tested for flue gas (15% CO2 with 85% of N2) at the same experimental conditions.
3. Results and discussion
The sorbents were characterized by XRD, FESEM, EDX and BET analysis. The crystalline phases and average crystallite sizes of the synthesized sorbents were detected by XRD. The morphology and the sintering effect of the sorbents were studied using FESEM analysis. The existence of elements in the sorbents was verified in EDX. The surface area, pore volume and pore diameter were calculated from BET analysis. CO2 adsorption studies were carried out in a TGA. The carbonation was conducted at 650 °C for 30 min in 100% CO2, while the decarbonation was carried out at 800 °C for 10 min in 100% N2.
3.1 Characterization
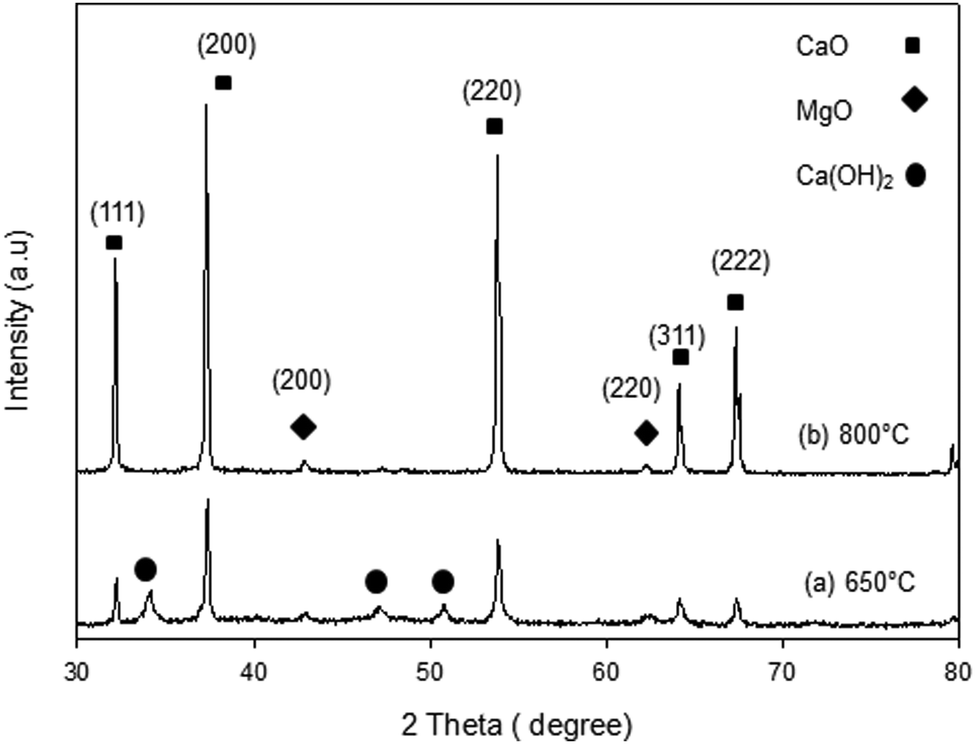
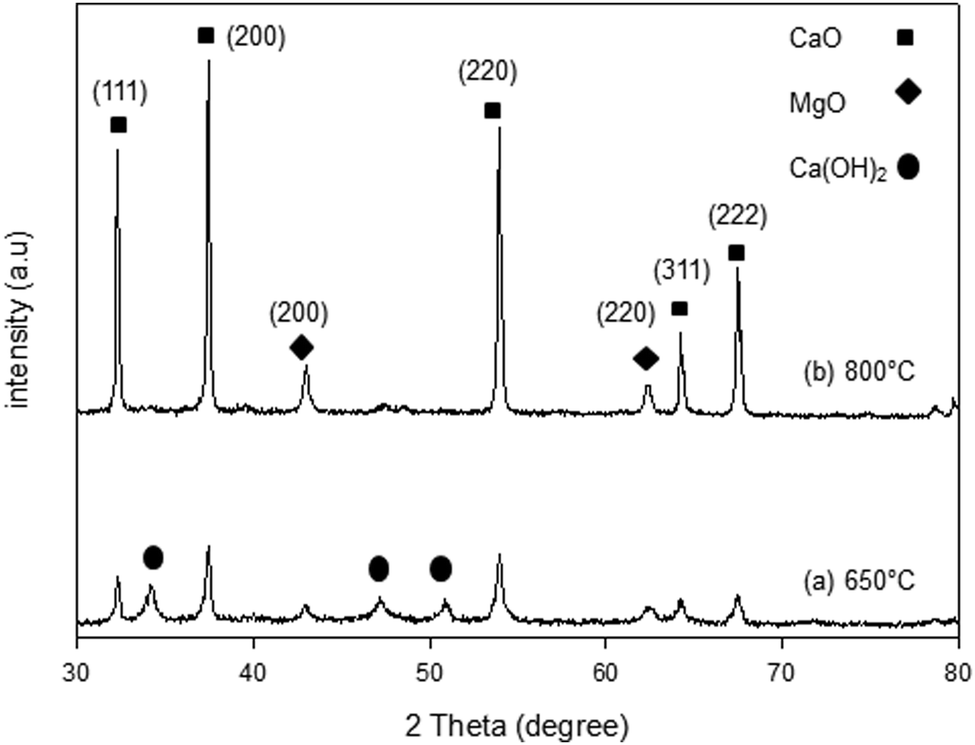
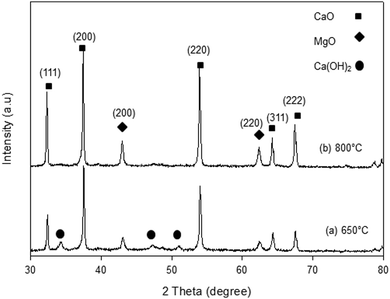
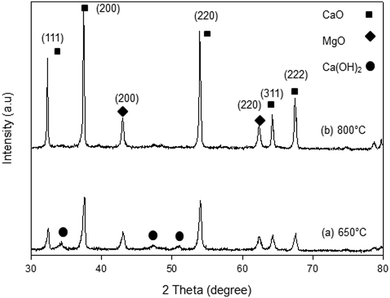
The XRD patterns of the synthesized samples are presented in Fig. 1–5. The diffraction peaks at 2θ values of 32.20°, 37.36°, 53.86°, 64.15° and 67.37° are in good agreement according to the standard JCPDS of CaO (JCPDS: 00-004-0777), while the peaks at 2θ values of 42.94° and 62.17° represent the cubic MgO phase (JCPDS: 01-077-2364).
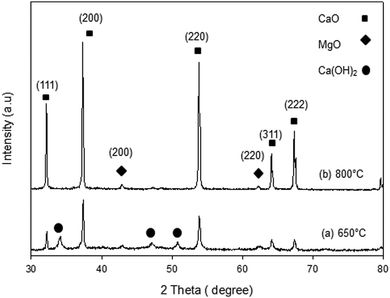 |
| | Fig. 1 XRD patterns of C95M5 sorbent. | |
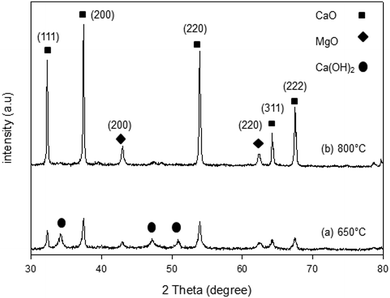 |
| | Fig. 2 XRD patterns of C90M10 sorbent. | |
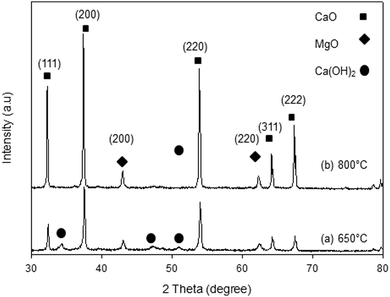 |
| | Fig. 3 XRD patterns of C85M15 sorbent. | |
 |
| | Fig. 4 XRD patterns of C80M20 sorbent. | |
 |
| | Fig. 5 XRD patterns of C70M30 sorbent. | |
It is clearly observed that CaO and MgO are formed at 650 °C but the peak intensities are low. Moreover, Ca(OH)2 is detected at 650 °C. The intensity of the diffraction peaks is higher at 800 °C, indicating good crystallinity and Ca(OH)2 is completely transformed into CaO. The results also suggest that CaO and MgO will act as individual structures in the sorbents. The average crystallite size of CaO and MgO at 800 °C was determined from diffraction peak broadening ((200) plane) using Scherrer's equation and the results are summarized in Table 2. The average crystallite size of CaO increases with the concentration of the MgO content.
Table 2 The average crystallite size of CaO–MgO sorbents at various calcination temperatures
| Samples |
Calcination temperatures (°C) |
Average crystallite size (nm) |
| CaO |
MgO |
| C95M5 |
650 |
32.1 |
17.5 |
| 800 |
57.5 |
18.8 |
| C90M10 |
650 |
42.8 |
15.3 |
| 800 |
52.8 |
21.8 |
| C85M15 |
650 |
42.7 |
21.2 |
| 800 |
43.0 |
27.0 |
| C80CM20 |
650 |
61.4 |
21.0 |
| 800 |
69.7 |
22.0 |
| C70M30 |
650 |
46.5 |
22.4 |
| 800 |
47.4 |
29.7 |
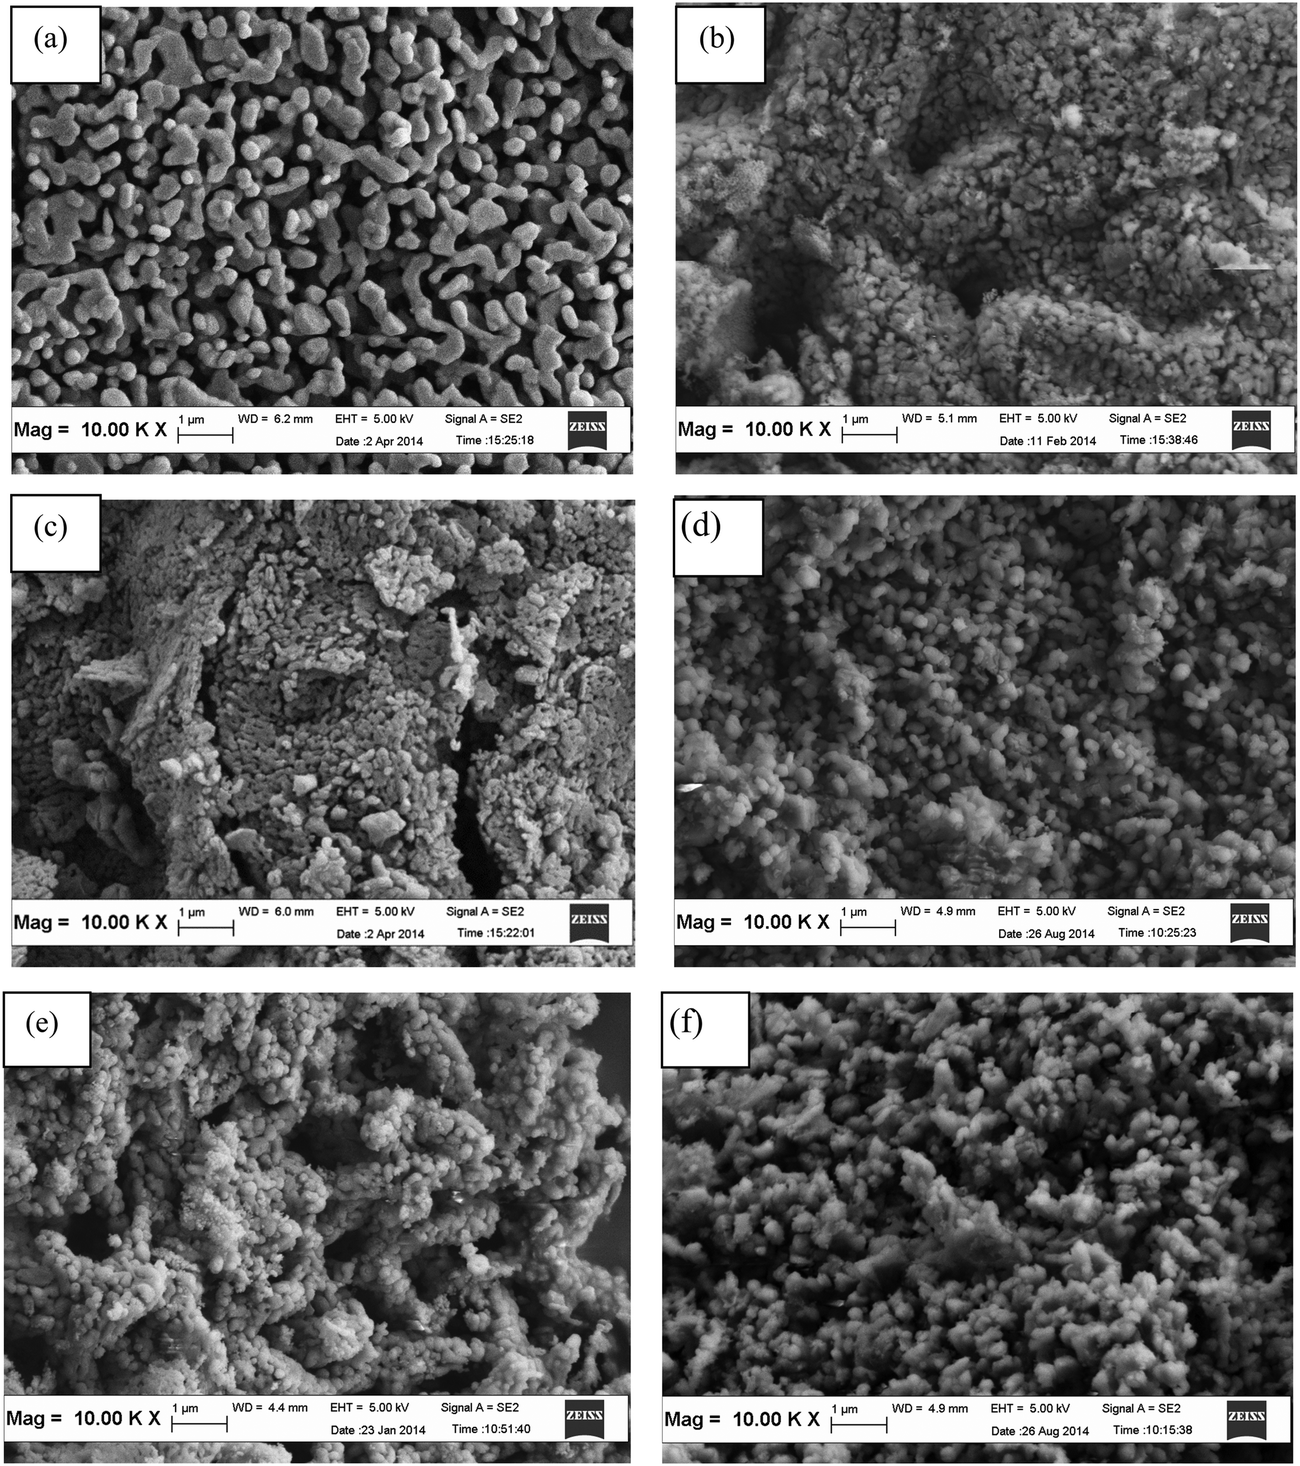
The FESEM images of the CaO–MgO with different weight % of MgO calcined at 800 °C are shown in Fig. 6. As shown in Fig. 6(a), CaO that was calcined at 800 °C without MgO is composed of spherical particles that are diffused together, indicating a heavy sintering effect. Fig. 6(b) shows the CaO sorbent with 5 wt% of MgO. The addition of MgO improves pores, demonstrating the reduced sintering effect of the sorbent. When the MgO concentration is increased to 10 wt%, the size of the particles is similar to that at 5 wt%, but the voids are larger within clusters of particles. Beyond 10 wt% of MgO, larger spherical particles are obtained. Most importantly, the results showed that the addition of MgO in the range 5 wt% to 30 wt% overcomes the sintering effect. Thus, MgO would enhance the CO2 adsorption capacity of CaO during multiple cycles when compared to pure CaO.
 |
| | Fig. 6 FESEM images of CaO–MgO sorbents prepared with various MgO wt% loading; (a) 0 wt% (b) 5 wt% (c) 10 wt% (d) 15 wt% (e) 20 wt% and (f) 30 wt%. | |
The data obtained from N2 BET isotherms of CaO–MgO sorbents are presented in Table 3. Generally it is known that sorption capacity depends on the degree of porosity development, high surface area and pore volume. The surface area of CaO with 5 wt% of MgO is higher than that of pure CaO. This is obviously attributed to the reduced sintering effect when compared to pure CaO (Table 3). Beyond 5 wt% of MgO, the specific surface area is decreased. This is ascribed to a large pore diameter of the sorbents. However, in comparison to pure CaO, the surface area of the entire CaO–MgO samples is high, suggesting that MgO addition overcomes the sintering effect that is prone to happen in pure CaO sorbents.
Table 3 BET surface area of CaO–MgO sorbents at different MgO loading
| Samples |
BET surface area (m2 g−1) |
Pore volume (cm3 g−1) |
Pore diameter (nm) |
| CaO |
18.62 |
0.11 |
14.5 |
| C95M5 |
51.73 |
0.15 |
10.6 |
| C90M10 |
49.09 |
0.22 |
10.2 |
| C85M15 |
31.44 |
0.29 |
17.6 |
| C80M20 |
23.01 |
0.24 |
38.8 |
| C70M30 |
20.02 |
0.29 |
41.9 |
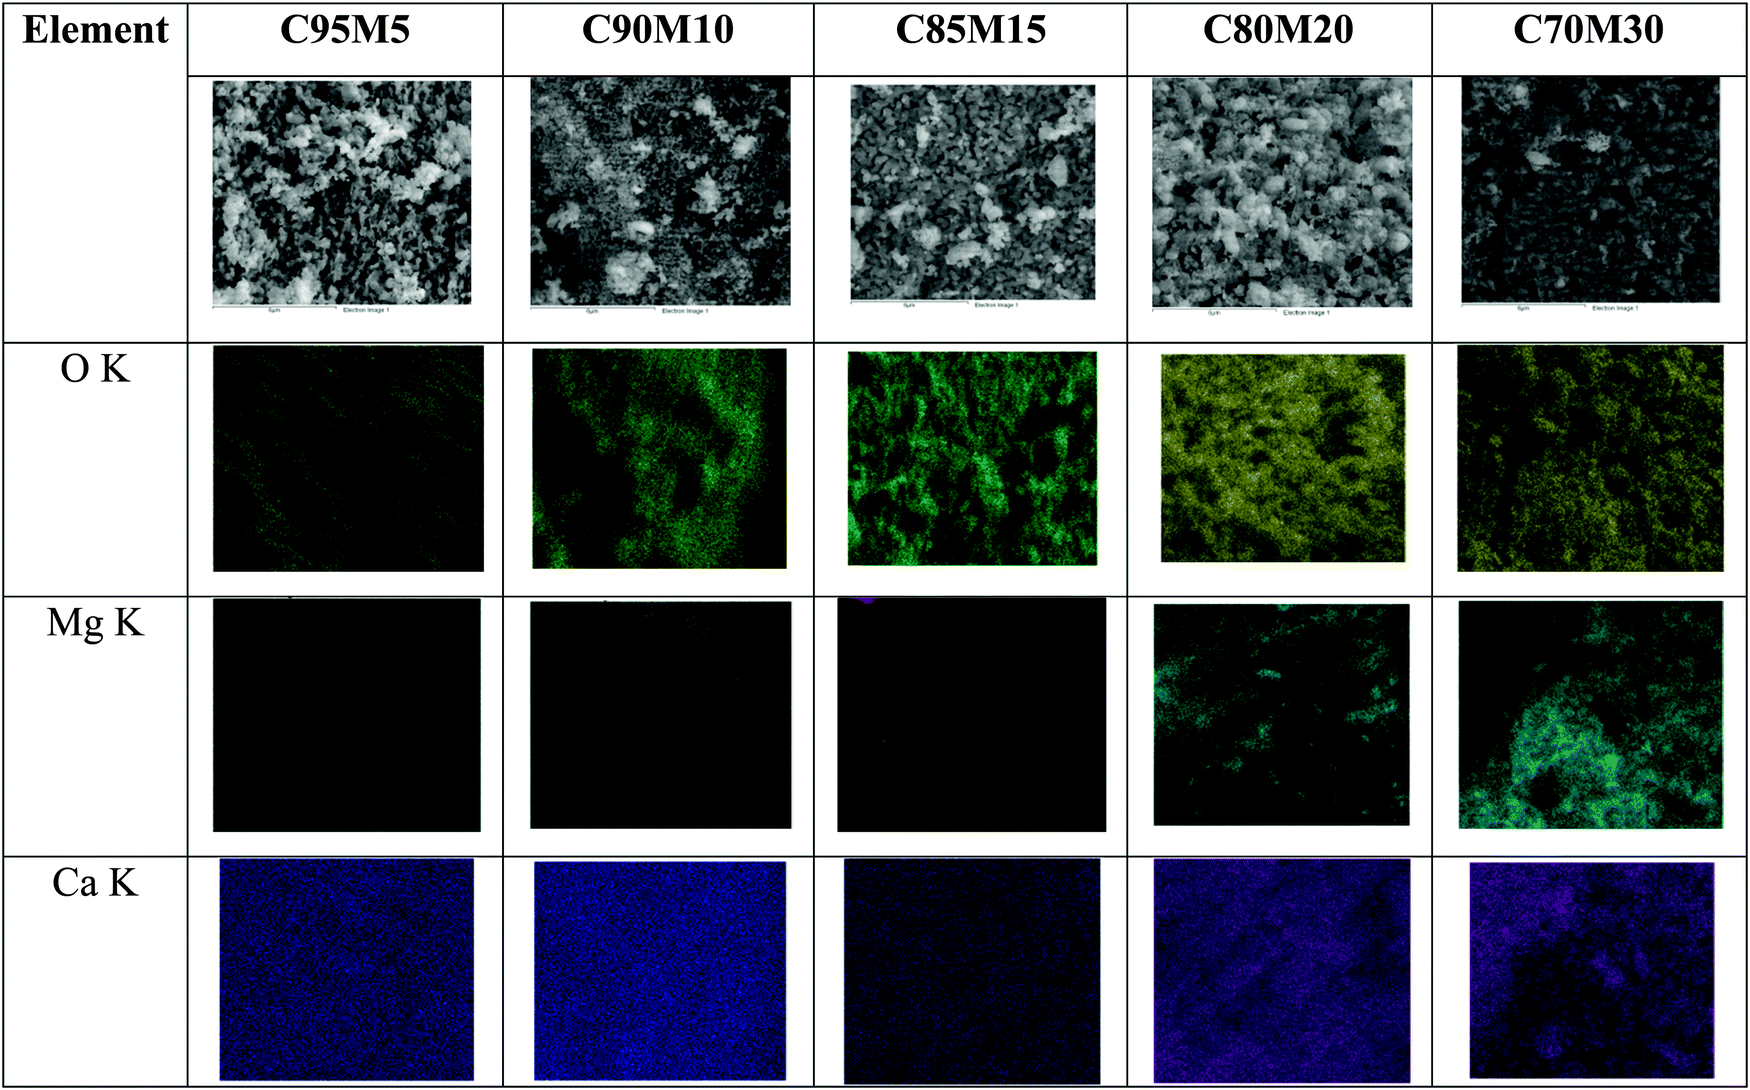
EDX elemental mapping was conducted to further understand the distribution of MgO within CaO. As seen from Fig. 7, the presence of the Mg element is obvious beyond 15 wt% and it is not evenly distributed. Moreover, it is found that the spot has a strong signal for Ca in the absence of the Mg element. This result suggests that MgO acts like an independent structure rather than being a compound that is bonded with calcium.
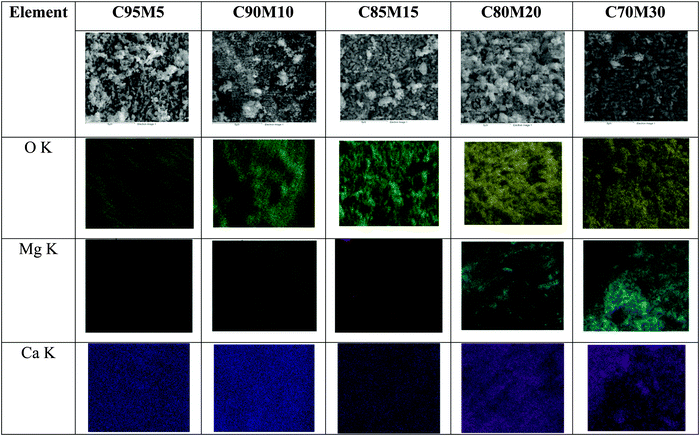 |
| | Fig. 7 EDX elemental mapping of CaO–MgO sorbents with various MgO wt% loading. | |
3.2 CaO–MgO sorbent at various carbonation temperatures
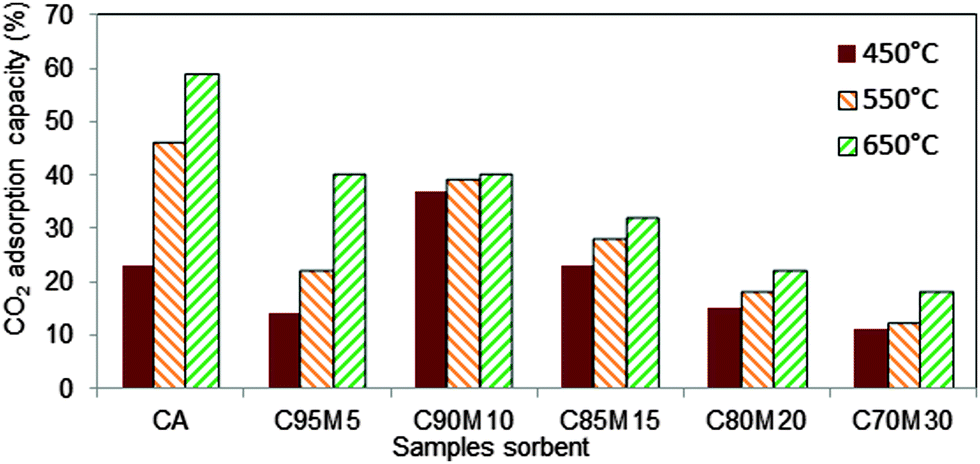
In this experiment, the influence of inert supports on the uptake of CO2 was investigated. Fig. 8 indicates the variation in the adsorption capacity of the sorbents. From Fig. 8, it can be observed that the CO2 adsorption capacity of pure CaO and 5 wt% MgO–CaO increased with the increase of carbonation temperature. However, beyond 5 wt% MgO, the variation in adsorption capacities as a function of carbonation temperature is not obvious, suggesting the potential of using such sorbents to capture CO2 at intermediate temperatures. Nevertheless, the overall adsorption capacity is higher at 10 wt% of MgO–CaO sorbents. The high and stable adsorption capacities with carbonation temperature are ascribed to several reasons: (1) high surface area, (2) large pore volume, (3) the small diameter of the pores and (4) no sintering effect. The poor adsorption capacity with 15%, 20% and 30 wt% MgO is ascribed to the lack of active surface area of CaO that is available for CO2 adsorption.
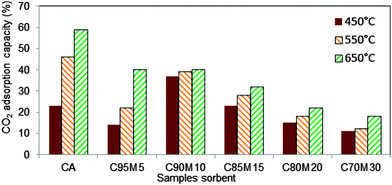 |
| | Fig. 8 CO2 adsorption capacity at 450 °C, 550 °C and 650 °C for CaO–MgO sorbents synthesized with solvent volume of 78 ml of ethanol and 2 ml of DIW. | |
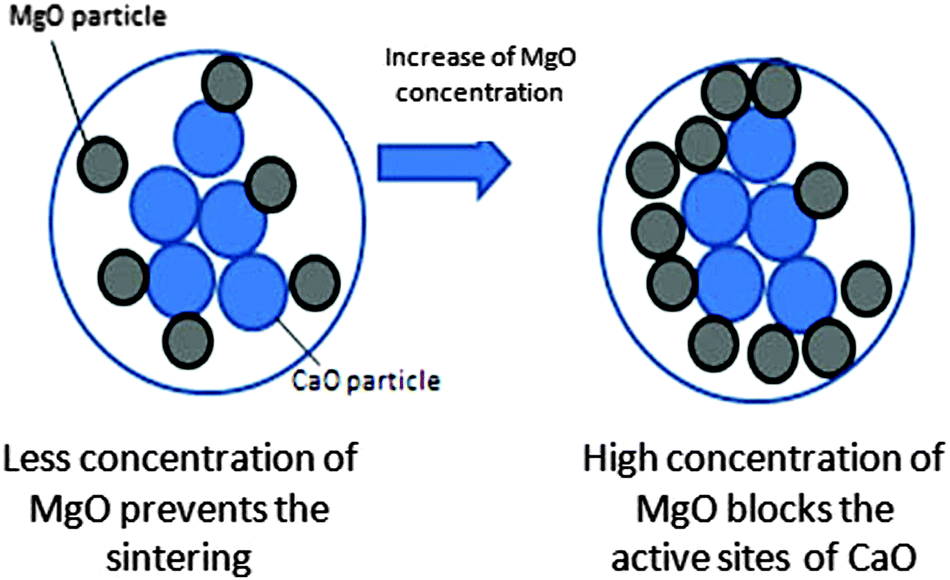
At the optimum content, MgO acts like a partition wall and a physical barrier to prevent the sintering of CaO during the carbonation and decarbonation processes, because of its high sintering temperature.24 This phenomenon is illustrated in Fig. 9. Zhou et al.16 reported that the uniform dispersion of inert materials and good surface areas of the sorbents are the responsible factors for reducing the sintering effect. The high amount of inert materials plays a negative role in the CO2 adsorption capacity. This is attributed to the active sites of CaO for CO2 adsorption that are blocked by the high concentration of inert material. Li et al.25 explained that MgO particles only located at the boundary or surface of CaO would exert a resistance to the sintering effect. The sintering effect can be explained by the pinning force exerted by MgO, which is related to particle size, surface area, volume fraction and interaction between MgO and CaO.
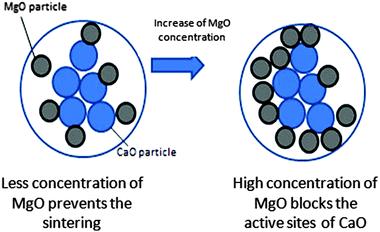 |
| | Fig. 9 The CaO–MgO sorbent with increasing wt% of MgO. | |
3.3 The cyclic stability of CaO–MgO for CO2 adsorption
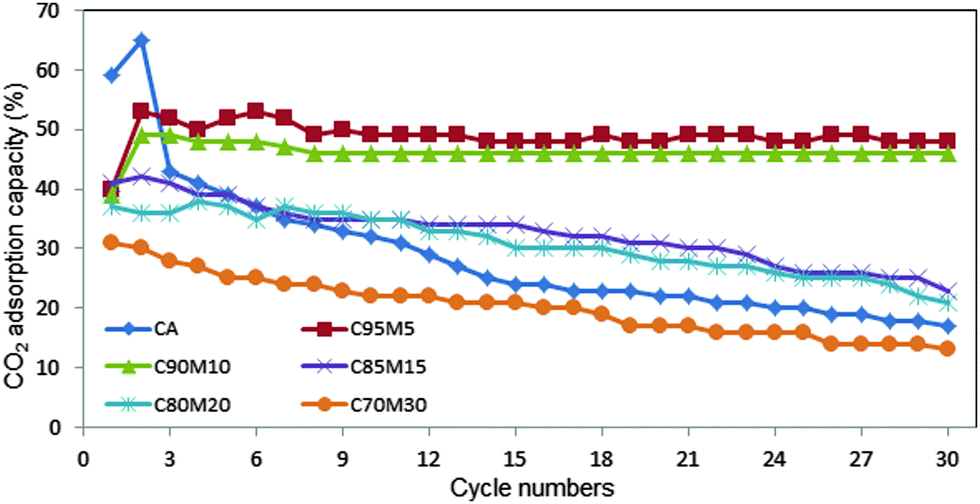
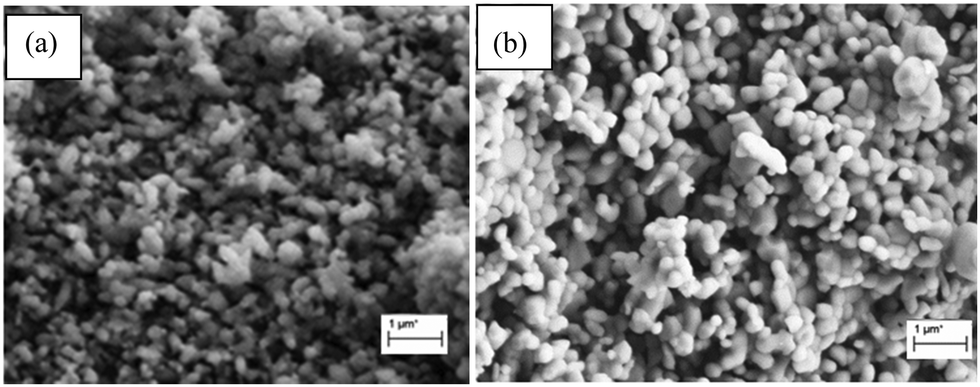
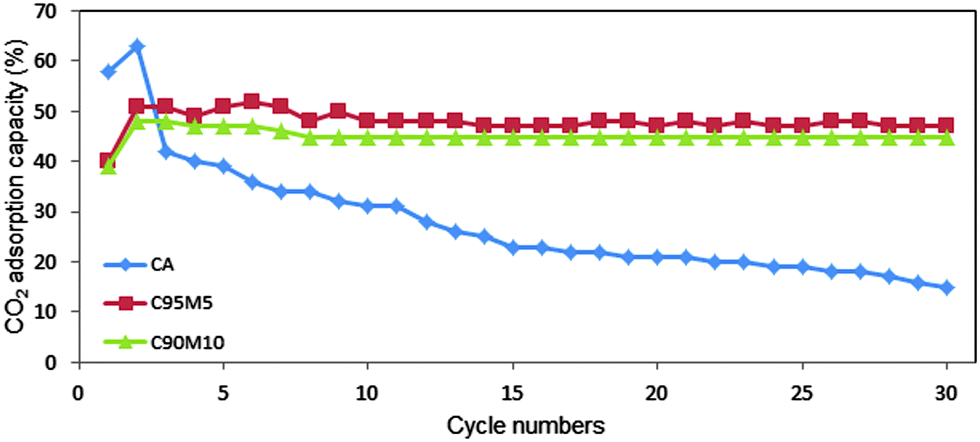
Fig. 10 summarizes the CO2 adsorption capacity and carbonation conversion for the entire sorbents. The highest adsorption capacity was obtained by CaO at 5 wt%, followed by 10 wt%, 15 wt%, 20 wt% and 30 wt%, respectively. However, at 5 wt% MgO, the CO2 adsorption fluctuates with the number of cycles. This is probably attributed to the significant agglomeration of small particles. The C90M10 sorbent with 10 wt% MgO is very stable and exhibited good CO2 adsorption capacity for up to 30 cycles. This result suggests that C90M10 is a stable and promising adsorbent to capture CO2. The structural stability of C95M5 and C90M10 sorbents was verified after 10 cycles using FESEM analysis (Fig. 11). The results revealed that the particles obtained after 10 cycles are free from the sintering effect.
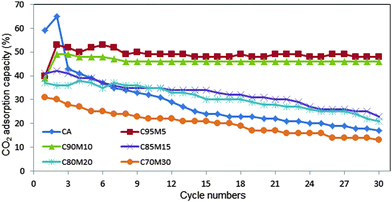 |
| | Fig. 10 CO2 adsorption capacity of CaO sorbents with different MgO wt% (calcination temperature 800 °C, carbonation at 650 °C with 100% CO2, de-carbonation at 800 °C in 100% N2). | |
 |
| | Fig. 11 FESEM images of CaO–MgO sorbents after 10 cycles of carbonation/decarbonation (650 °C/800 °C); (a) C95M5; (b) C90M10. | |
Pure CaO, CaO with 5 wt% and 10 wt% MgO sorbents were further evaluated for their adsorption capacity using a flue gas of 15% CO2 (balanced with N2) and the results are illustrated in Fig. 12. It is clearly seen that the MgO incorporated sorbents exhibited stable CO2 adsorption capacity and good structural stability when compared to pure CaO. Besides, the adsorption capacity of sorbents is almost the same and has only a small drop in activity (less than 3%) when compared with 100% CO2. Furthermore, MgO incorporated CaO could be utilized to adsorb the CO2 gas that is released from power plants.
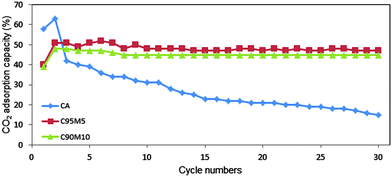 |
| | Fig. 12 CO2 adsorption capacity of bare CaO, CaO with 5 wt% and 10 wt% MgO (calcination temperature 800 °C, carbonation at 650 °C with 15% CO2 (balanced with N2), de-carbonation at 800 °C in 100% N2) for 30 cycles carbonation/de-carbonation. | |
4. Conclusion
In this study, the addition of MgO (5 wt% to 30 wt%) on CaO for CO2 adsorption capacity has been investigated in detail. The sorbent with 10 wt% MgO (C90M10) has good structural stability with high surface area (49.09 m2 g−1), pore volume (0.215 cc g−1), average pore diameter (10.2 nm), good cyclability and CO2 adsorption capacity. The addition of MgO improves the pores within small particles and reduces the sintering effect. CaO with 10 wt% MgO exhibited constant CO2 adsorption capacity (50%, 15 mmol CO2 per g sorbent) during 30 cycles of carbonation–decarbonation.
Acknowledgements
The authors would like to acknowledge financial support received under the Postgraduate Fellowship Scheme from University of Islam Antarabangsa Malaysia (UIAM), the Ministry of Higher Education (MOHE) Malaysia; a Long Term Research Grant (LRGS) (203/PKT/6723001) from the Ministry of Higher Education (MOHE) Malaysia and PRGS grant 1001/PBAHAN/8046029.
References
- Z. Yong, V. Mata and A. E. Rodrigues, Sep. Purif. Technol., 2002, 26, 195–205 CrossRef CAS.
- T. Witoon, Ceram. Int., 2011, 37, 3291–3298 CrossRef CAS.
- W. Liu, H. An. C. Qin, J. Yin, G. Wang, B. Feng and M. Xu, Energy Fuels, 2012, 26, 2751–2767 CrossRef CAS.
- M. Guo, L. Zhang, Z. Yan and Q. Tang, Energy Fuels, 2011, 25, 5514–5520 CrossRef CAS.
- J. Park and K. B. Yi, Int. J. Hydrogen Energy, 2012, 37, 95–102 CrossRef CAS.
- L. Li, D. L. King, Z. Nie and C. Howard, Ind. Eng. Chem. Res., 2009, 48, 10604–10613 CrossRef CAS.
- K. O. Albrecht, K. S. Wagenbach, J. A. Satrio, B. H. Shanks and T. D. Wheelock, Ind. Eng. Chem. Res., 2008, 47, 7841–7848 CrossRef CAS.
- R. Pacciani, C. R. Müller, J. F. Davidson, J. S. Dennis and A. N. Hayhurst, Can. J. Chem. Eng., 2008, 86, 356–366 CrossRef CAS.
- W. Liu, B. Feng, Y. Wu, G. Wang, J. Barry and J. C. Diniz da Costa, Environ. Sci. Technol., 2010, 44, 3093–3097 CrossRef CAS PubMed.
- D. S. Sultan, C. R. Müller and J. S. Dennis, Energy Fuels, 2010, 24, 3687–3697 CrossRef CAS.
- R. Filitz, A. M. Kierzkowska, M. Broda and C. R. Müller, Environ. Sci. Technol., 2011, 46, 559–565 CrossRef PubMed.
- X. Yang, L. Zhao, S. Yang and Y. Xiao, Asia-Pac. J. Chem. Eng., 2013, 8, 906–915 CrossRef CAS.
- S. F. Wu, Q. H. Li, J. N. Kim and K. B. Yi, Ind. Eng. Chem. Res., 2007, 47, 180–184 CrossRef.
- L. Vieille, A. Govin and P. Grosseau, Powder Technol., 2012, 228, 319–323 CrossRef CAS.
- C. Zhao, Z. Zhou and Z. Cheng, Ind. Eng. Chem. Res., 2014, 53, 14065–14074 CrossRef CAS.
- Z. Zhou, Y. Qi, M. Xie, Z. Cheng and W. Yuan, Chem. Eng. Sci., 2012, 74, 172–180 CrossRef CAS.
- C. Luo, Y. Zheng, N. Ding and C. Zheng, Korean J. Chem. Eng., 2011, 28, 1042–1046 CrossRef CAS.
- H. Lu, A. Khan, S. E. Pratsinis and P. G. Smirniotis, Energy Fuels, 2008, 23, 1093–1100 CrossRef.
- R. Koirala, K. R. Gunugunuri, S. E. Pratsinis and P. G. Smirniotis, J. Phys. Chem. C, 2011, 115, 24804–24812 CAS.
- H. Lu and P. G. Smirniotis, Ind. Eng. Chem. Res., 2009, 48, 5454–5459 CrossRef CAS.
- V. S. Derevschikov, A. I. Lysikov and A. G. Okunev, Ind. Eng. Chem. Res., 2011, 50, 12741–12749 CrossRef CAS.
- Y. Hu, W. Liu, J. Sun, M. Li, X. Yang, Y. Zhang and M. Xu, Chem. Eng. J., 2015, 273, 333–343 CrossRef CAS.
- C. Luo, Y. Zheng, J. Yin, C. Qin, N. Ding, C. Zheng and B. Feng, Energy Fuels, 2013, 27, 4824–4831 CrossRef CAS.
- Y. Wang, Y. Zhu and S. Wu, Chem. Eng. J., 2013, 218, 39–45 CrossRef CAS.
- Z. Li, Y. Liu and N. Cai, Chem. Eng. Sci., 2013, 89, 235–243 CrossRef CAS.
|
| This journal is © The Royal Society of Chemistry and the Centre National de la Recherche Scientifique 2016 |
Click here to see how this site uses Cookies. View our privacy policy here.