Synthesis, controlled release and antibacterial studies of nalidixic acid–zinc hydroxide nitrate nanocomposites
Hafezeh
Nabipour
*a,
Moayad Hossaini
Sadr
a and
Nygil
Thomas
b
aChemistry Department, Faculty of Science, Azarbaijan Shahid Madani University, Tabriz, Iran. E-mail: ha.nabipour@gmail.com; Fax: +98 4134327541; Tel: +98 4134327500
bPost Graduate and Research Department of Chemistry, Nirmalagiri College, Kannur, Kerala 670701, India
First published on 26th October 2015
Abstract
Nalidixic acid (NA) was intercalated into zinc hydroxide nitrate (ZHN) by an ion exchange method. The resultant nanocomposite showed a basal spacing of 11.74 Å that corresponds to a pure phase, confirmed by powder X-ray diffraction (PXRD) studies. The arrangement of NA in the interlayer of ZHN was in a monolayer form. A FTIR spectroscopy study showed that the intercalation took place without any change in the structure of NA and the thermal analysis results showed that NA is stabilized in the interlayers by electrostatic interactions. Biocompatible NA–ZHN/chitosan nanocomposites were prepared by coating of the NA–ZHN nanocomposite with chitosan and the drug release behavior in vitro was studied. The antibacterial activities of the nanocomposite were tested against microorganisms. The results showed that the synthesized nanocomposites show good inhibition against two Gram-positive and Gram-negative species. NA–ZHN can prevent the growth of harmful bacteria more effectively than the NA drug.
1. Introduction
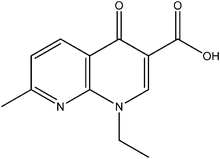
Brucite-like layered metal hydroxide compounds can be broadly classified into two types based on their structure and chemical compositions.1 Layered double hydroxides (LDH) (LDH – M1−x2+Mx3+(OH)2(Am−)x/m·nH2O) and layered hydroxide salts (LHS) (LHS – M2+(OH)2−x(Am−)x/m·nH2O) are layered crystalline materials belonging to the layered metal hydroxide family.2 LDH and LHS have attracted considerable attention due to their technological importance in catalysis, separation technology, nanocomposite materials engineering,3 matrices for immobilization of different metallocomplexes, magnetic materials,4,5 controlled release formulation, slow-release fertilizers,6,7 pharmaceutical products8,9 and polymer reinforcement materials.10,11 Zinc hydroxide nitrate (ZHN) is a layered hydroxide salt that can be classified into two sub-groups.12 In type with empirical formula Zn2(OH)2(NO3)2·2H2O, a Zn2+ cation is coordinated octahedrally with six OH groups, and nitrate anions are present between the hydroxide layers and coordinated to the Zn2+ cations13 and types IIa and IIb have formula: Zn5(OH)8(NO3)2·2H2O, Zn5(OH)8(NO3)2. In both of these, one quarter of the octahedral zinc cations are displaced from the main layer to tetrahedral sites located above and below each empty octahedron. The hydroxide ions shared with the octahedral sheet occupy the three vertices of the tetrahedron, and the apex is occupied by water molecules in type IIa and takes on a Zn5(OH)8(NO3)2·2H2O structure.14 However, in type IIb, nitrate ions occupying the apex are directly coordinated with the zinc tetrahedron.12 ZHN has also been used as a drug delivery system for compounds like ellagic acid,15 cetirizine,16 and protocatechuate.17Nalidixic acid (1-ethyl-1,4-dihydro-7-methyl-4-oxo-1,8-naphthyridine-3-carboxylic acid), as shown in Fig. 1, is the first synthetic quinolone antibiotic that was introduced in therapy in the 1960s.18 NA is effective against both Gram-positive and Gram-negative bacteria. It acts as a bacteriostatic agent in lower concentrations but can be bactericidal at higher concentrations. M. Trikeriotis and D. F. Ghanotakis19 studied intercalation and release profiles of NA in LDH. Zinc, an essential trace element in the human body, takes part in the catalytic activity of approximately 100 enzymes and plays a role in immune function, protein synthesis, wound healing, DNA synthesis, and cell division.20 ZHNs are unstable in low pH media and when dissolved in lysosome (pH 4.5–5), zinc anions release and become part of the nutrient cycle.21 In addition, zinc compounds show interesting antibacterial properties.22 In drug delivery systems, various drug carriers such as polymeric nanoparticles,23 dextran,24 and chitosan25,26 have used NA.
In this work, we prepared an inorganic–organic drug carrier based on ZHN and chitosan host materials intercalated with NA. The antibacterial and controlled-release properties of the nanomaterial were investigated. In vitro release studies in buffer (pH 4.8 and 7.4) at 37 °C showed an initial burst effect followed by slow release. In addition, the antibacterial activity of the intercalated compound was evaluated against microorganisms. Fourier transform infrared (FTIR), thermal analysis (TG/DTA), scanning electron microscopy (SEM) and surface area studies of the composites are also discussed. The controlled release of NA from NA–ZHN and NA–ZHN/chitosan nanocomposites in buffer solution has been performed and monitored by UV-Visible spectroscopy.
2. Experimental
Nalidixic acid was purchased from Alborz Drug Company in Iran. All other reagents were purchased from Merck chemical company and used without further purification.2.1 Synthesis
2.2 Characterization
The powder X-ray diffraction patterns (XRD) of the samples were collected using a Bruker AXS model D8 advance diffractometer using a CuKα source (λ = 1.542 Å) at 40 kV, 35 mA, and a scan range of 2°–70°. Infrared spectra were recorded using a Bruker Fourier transform infrared (FT-IR) spectrometer, using KBr pellets, scanned from 4000 to 400 cm−1. Absorption spectra were recorded in the range of 200–800 nm on a Shimadzu model 1601 PC UV-Visible spectrophotometer. The thermal behavior of the samples was determined by thermogravimetric analysis (TGA) on a Mettler-Toledo TGA 851e apparatus with a heating rate of 10 °C min−1 under a N2 atmosphere. Scanning electron micrographs (SEMs) were taken on a KYKY-EM3200 and a VEGA-TESCAN. The nitrogen adsorption–desorption isotherms of the samples were measured at 77 K using a micromeritics ASAP 2020 analyser. The specific surface area was obtained using the Brunauer–Emmett–Teller (BET) method and the pore size distribution was evaluated using the Barrett–Joyner–Halenda (BJH) method.2.3 Drug-release studies
The release of NA from ZHN, NA–ZHN/chitosan and plain NA was performed in a medium of PBS (phosphate buffered saline) at pH 7.4 and 4.8 at 37 °C. These solutions were stirred at 100 rpm using a magnetic stirrer for 24 h. In vitro drug release studies were studied using a dialysis membrane. 0.01 g of the obtained NA or its nanocomposites was poured onto a porous dialysis membrane. Every 10 min, 3 ml of the solution was removed and immediately replaced by an equal volume of fresh buffer solution (to keep the diffusion medium constant). The amount of drug released was monitored using a UV-Vis spectrophotometer at 257 nm.The percentage of drug release was evaluated by using the following definition:
2.4 Antimicrobial activity
The antimicrobial activity of NA–ZHN and NA–ZHN/chitosan was evaluated against the following pathogenic strains: S. aureus ATCC 25923, B. subtilis ATCC 1023 and E. coli ATCC 25922. The disk diffusion method was used to study the antimicrobial efficiency of the prepared nanocomposites.27 The antimicrobial activity was determined at a concentration of 20 μg ml−1 and their efficacy was assessed on Muller Hinton agar disks. All the solutions were prepared in 0.1 mol l−1 NaOH. The bacterial cultures were grown overnight at 37 °C in a nutrient broth medium and then the suspension was diluted to 0.5 McFarland standard (106 CFU ml−1). A lawn culture was made with these bacterial loads on Muller Hinton Agar plates. A filter paper disk (9 mm) impregnated with 10 μl of nanocomposite was suspended in sterile alkaline water and placed on the surface of the agar using a dispenser. The plates were inverted and incubated for 24 h at 37 °C. The inhibition ring diameter of growth, which appeared around the disks, was measured. Gentamicin was used at a concentration of 20 μg ml−1 as standard antibacterial.2.5 Determination of the minimum inhibitory concentration (MIC)
The minimum inhibitory concentration (MIC) assay is a technique used to determine the lowest concentration of a particular antibiotic needed to kill bacteria. MICs can be determined on plates of agar dilution or broth dilution methods. The MIC of the synthesized NA–ZHN and NA–ZHN/chitosan determined by the microdilution broth method. The nanocomposite was tested at different concentrations of 10, 5, 1, 0.5, 0.1, and 0 μg ml−1 in alkaline water. The MIC assay was performed using a 96 well plate in Muller Hinton broth medium at different concentrations of the nanocomposite with a standard antibiotic as positive and alkaline water as negative control. 100 μl of Mueller Hinton broth (106 CFU ml−1) was added to a 100 μl of aliquot of each dilution. The 96 well MIC plates were prepared in triplicate. The microbial cultures were incubated at 37 °C for 24 h. The MIC was determined by comparing the various concentrations of nanocomposites showing different inhibitory effects.3. Results and discussion
NA–ZHN nanocomposites were obtained using the ion-exchange method of ZHN on the NA drug with the aim of improving the biological properties. Microstructural characterization of the NA–ZHN nanocomposite was performed by PXRD, FT-IR spectra, thermogravimetric analyses, and BET analysis. The morphology of the nanocomposites was studied by SEM. Antibacterial activities of the nanocomposites were studied by disk diffusion and minimum inhibitory concentration, and finally, the release of NA molecules from the nanocomposite was studied in phosphate-buffered saline (PBS).3.1 Microstructural analysis of the drug intercalated ZHN
PXRD patterns for NA, NA–ZHN and ZHN are given in Fig. 2. The PXRD pattern of NA showed that the solid has good crystallinity. The PXRD pattern of ZHN confirms the formation of a layered structure with a basal spacing of 9.57 Å. The sharp peak at 2θ = 9.32 is due to the 200 planes of the monoclinic lattice. The NA–ZHN composite obtained after anion exchange with NA showed a peak at 8.22° in 2θ, which corresponds to a basal spacing of 11.74 Å. This indicates successful intercalation of NA into the interlayers of ZHN as reflected by the observation of the peak at lower 2θ value. When the ratio of NA![[thin space (1/6-em)]](https://www.rsc.org/images/entities/char_2009.gif) :
:![[thin space (1/6-em)]](https://www.rsc.org/images/entities/char_2009.gif) ZHN was changed, there was no considerable difference between the PXRD patterns of the resulting samples. Fig. 3 shows the 3D molecular size of NA. Using MarvinSpace software, the long and short axes of NA were estimated to be 8.03 and 7.16 Å, respectively (Fig. 3A). After intercalation of NA, the interlayer distance is increased to 11.74 Å, with the thickness of the zinc hydroxide nitrate basal layer being 4.8 Å28 and the gallery heights were estimated to be 4.34 Å. The obtained value is smaller than the phenomenal l length of the NA molecule. This smaller d-spacing value suggests that the NA anions are arranged as a monolayer between the ZHN interlayers, with the carboxylate groups positioned towards the ZHN layers (Fig. 3B). The possibility of the formation of a zinc salt of NA cannot be excluded.
ZHN was changed, there was no considerable difference between the PXRD patterns of the resulting samples. Fig. 3 shows the 3D molecular size of NA. Using MarvinSpace software, the long and short axes of NA were estimated to be 8.03 and 7.16 Å, respectively (Fig. 3A). After intercalation of NA, the interlayer distance is increased to 11.74 Å, with the thickness of the zinc hydroxide nitrate basal layer being 4.8 Å28 and the gallery heights were estimated to be 4.34 Å. The obtained value is smaller than the phenomenal l length of the NA molecule. This smaller d-spacing value suggests that the NA anions are arranged as a monolayer between the ZHN interlayers, with the carboxylate groups positioned towards the ZHN layers (Fig. 3B). The possibility of the formation of a zinc salt of NA cannot be excluded.
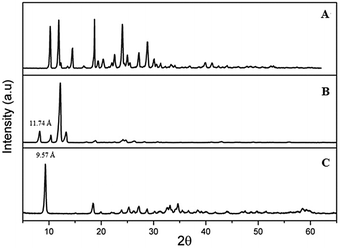 | ||
| Fig. 2 Powder X-ray diffraction patterns of (A) nalidixic acid, (B) nalidixic acid–ZHN, and (C) ZHN. | ||
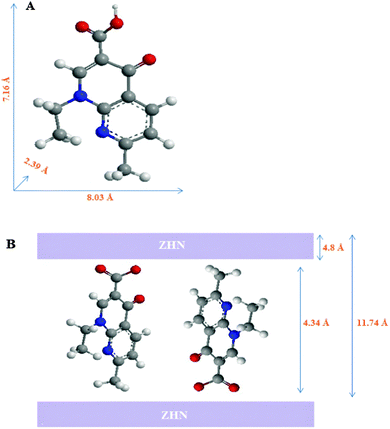 | ||
| Fig. 3 (A) Molecular dimensions of the nalidixic acid molecule. (B) Schematic arrangement of nalidixic acid anions in the interlayer space of nalidixic acid–ZHN. | ||
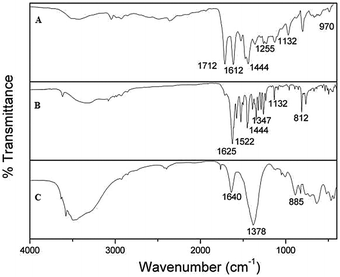
Fig. 4 shows the infrared spectrum of the sample. Fig. 4A shows the FTIR spectrum of pure NA. Strong bands at 1712 and 1617 cm−1 are characteristic of the stretching vibrations of the carbonyl group of carboxylic acid and pyridone, respectively. Aromatic hydrocarbons show absorption in the region 1444 cm−1 due to C–C stretching vibrations in the aromatic ring. Nitrogen–carbon–hydrogen (NCH) deformation bands occur in the regions 1518, 1470, 1294–1050 and 705–776 cm−1. The bands observed at 1370, 1479, and 1518 cm−1 are assigned to the C![[double bond, length as m-dash]](https://www.rsc.org/images/entities/char_e001.gif) N stretching vibration mode. Bands at 2984 and 2945 cm−1 are assigned to aliphatic CH stretching vibration of ethyl and methyl groups present in NA.29 The FTIR spectrum of ZHN is shown in Fig. 4C. The peaks at 436 and 468 cm−1 are assigned to the zinc–oxygen bond. The band observed at 641 cm−1 is due to the δ-mode of the O–H group O–H stretching. The sharp absorption at 1373 cm−1 and weak absorption at 833 cm−1 are due to N–O stretching, the latter being characteristic of D3h (ν3 mode). The 3486 cm−1 band may be due to the vibrations of the hydroxyl group, which is hydrogen bonded to the nitrate groups in the interlayer. The sharp peak at 3580 cm−1 is due to stretching vibrations of hydroxyl groups belonging to the inorganic lattice. An absorption band at 1640 cm−1 is attributed to the bending mode of water molecules.30 In the NA–ZHN nanocomposite (Fig. 4B), the weak bands at around 3050 cm−1 due to
N stretching vibration mode. Bands at 2984 and 2945 cm−1 are assigned to aliphatic CH stretching vibration of ethyl and methyl groups present in NA.29 The FTIR spectrum of ZHN is shown in Fig. 4C. The peaks at 436 and 468 cm−1 are assigned to the zinc–oxygen bond. The band observed at 641 cm−1 is due to the δ-mode of the O–H group O–H stretching. The sharp absorption at 1373 cm−1 and weak absorption at 833 cm−1 are due to N–O stretching, the latter being characteristic of D3h (ν3 mode). The 3486 cm−1 band may be due to the vibrations of the hydroxyl group, which is hydrogen bonded to the nitrate groups in the interlayer. The sharp peak at 3580 cm−1 is due to stretching vibrations of hydroxyl groups belonging to the inorganic lattice. An absorption band at 1640 cm−1 is attributed to the bending mode of water molecules.30 In the NA–ZHN nanocomposite (Fig. 4B), the weak bands at around 3050 cm−1 due to ![[double bond, length as m-dash]](https://www.rsc.org/images/entities/char_e001.gif) C–H are characteristic peaks of aromatic compounds. Bands at 2980–2950 cm−1 are attributed to ethyl and methyl stretching. A broad band at 3336 cm−1 is attributed to the O–H stretching vibration of the hydroxyl group. The asymmetric and symmetric stretching bands of the COO− group of the NA anions can be observed at 1575 and 1388 cm−1, respectively. In addition, the characteristic peak at 1260 cm−1 is attributed to the stretching vibration of the C–N group. The characteristic C
C–H are characteristic peaks of aromatic compounds. Bands at 2980–2950 cm−1 are attributed to ethyl and methyl stretching. A broad band at 3336 cm−1 is attributed to the O–H stretching vibration of the hydroxyl group. The asymmetric and symmetric stretching bands of the COO− group of the NA anions can be observed at 1575 and 1388 cm−1, respectively. In addition, the characteristic peak at 1260 cm−1 is attributed to the stretching vibration of the C–N group. The characteristic C![[double bond, length as m-dash]](https://www.rsc.org/images/entities/char_e001.gif) O stretching vibration of the COO− group at 1712 cm−1 disappeared in NA–ZHN. This result indicates that NA in the NA–ZHN interlayer takes the form that has a negatively charged oxygen atom. The band at 762 cm−1 is due to hydroxyl bending within the layers. Two bands at 444 and 495 cm−1 are due to the lattice vibrations of Zn–O and Zn–OH. These results further confirmed that NA has been intercalated into the interlayer space of ZHN.
O stretching vibration of the COO− group at 1712 cm−1 disappeared in NA–ZHN. This result indicates that NA in the NA–ZHN interlayer takes the form that has a negatively charged oxygen atom. The band at 762 cm−1 is due to hydroxyl bending within the layers. Two bands at 444 and 495 cm−1 are due to the lattice vibrations of Zn–O and Zn–OH. These results further confirmed that NA has been intercalated into the interlayer space of ZHN.
3.2 Thermal stability and surface morphologies of the hybrids
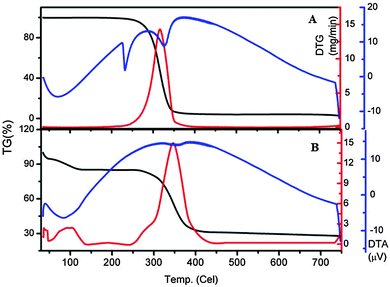
The thermogravimetric and differential thermogravimetric analyses obtained for NA and NA–ZHN are shown in Fig. 5. The TGA-DTG thermograms for NA show a single stage of weight loss at 316.2 °C, which can be due to combustion of the drug NA. For NA–ZHN, three steps of weight loss were observed (Fig. 5B). The first step of weight loss is due to the removal of surface physisorbed water molecules at 43.5 °C. The second step of weight loss at 92.8 °C is attributed to the removal of the interlayer anions and dehydroxylation of the OH layer. The last step of weight loss is due to decomposition of the intercalated anions and dehydroxylation of the OH layer at 343.5 °C. The decomposing temperature of the composite was slightly greater (343.51 °C) than that of the pristine NA drug (316.2 °C), which indicates that the NA–ZHN nanocomposite is thermally more stable than the unbound compound. This may be due to the encapsulation effect of the drug inside the LDH gallery space.Fig. 6A and B show the adsorption–desorption isotherm curve for NA–ZHN and ZHN. The shape of the isotherm curve for both materials shows type IV behavior under IUPAC classification, indicating a mesopore type of material. For ZHN, the N2 uptake was slow at the relative pressure in the range of 0.0–0.7, followed by rapid adsorption of the adsorbent at 0.7 until an optimum adsorption of 65 cm3 g−1 was achieved. The isotherm for NA–ZHN adsorption increased from the relative pressure of 0.0 to 0.68 and reached a peak at 90 cm3 g−1. Then the adsorption increased slowly in the range 0.68–0.8, followed by the increase of the relative pressure range 0.8–1.0, and reached an optimum peak at 140 cm3 g−1. For ZHN, the desorption branch of the hysteresis loop was narrower compared with NA–ZHN which may be due to different pore textures.
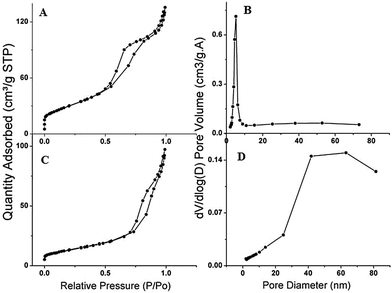 | ||
| Fig. 6 Nitrogen adsorption–desorption isotherms of (A) nalidixic acid–ZHN and (B) ZHN, and BJH pore size distribution of (C) nalidixic acid–ZHN and (D) ZHN. | ||
The surface area of the drug and the nanocomposite determined by the BET technique are shown in Table 1. The increased surface area for NA–ZHN 108.45 m2 g−1 compared to 22.56 m2 g−1 for ZHN is due to a change in the pore texture and formation of the lamellar nanocomposite. The BJH pore volume and the average pore diameter by BJH desorption are shown in Table 1. The average pore diameter increased from 5.76 Å for ZHN to 20.17 Å for NA–ZHN due to the intercalation of NA into ZHN. The BJH desorption pore volume increased from 0.089 cm3 g−1 to 0.203 cm3 g−1 for ZHN and NA–ZHN, respectively.
| Sample | BET surface area (m2 g−1) | BJH pore volume (cm3 g−1) | BJH average pore diameter (nm) |
|---|---|---|---|
| ZHN | 22.56 | 0.089 | 5.76 |
| Nalidixic acid–ZHN | 108.45 | 0.203 | 20.17 |
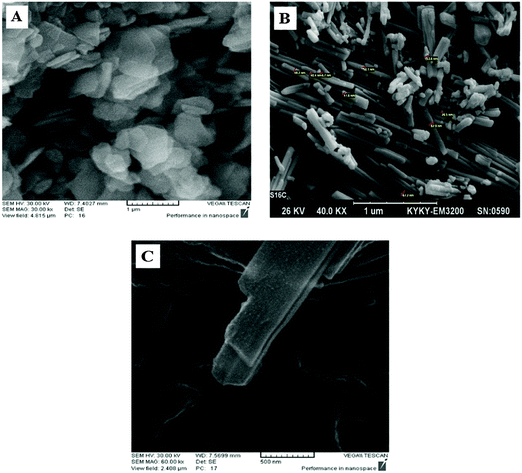
Fig. 7A–C show the SEM images of ZHN, NA–ZHN and NA–ZHN/chitosan. Fig. 7A shows flake-like particles that are collected together with various sizes. This structure was transformed into a ribbon-like structure when the NA–ZHN nanocomposite was formed by a direct reaction of ZHN with NA in an aqueous environment (Fig. 7B). This confirmed that the intercalation of NA into the interlayer of ZHN resulted in a change of the surface morphology from a flake-like structure to a ribbon-like structure with sizes in the nanometer range. The morphology of NA–ZHN/chitosan is found to be sheet-like, as can be seen from the image (Fig. 7C).
3.3 Antibacterial activities of drug intercalated layered hybrids
Antibacterial activities of NA–ZHN and NA–ZHN/chitosan were tested against microorganisms using disk diffusion assays. The study of disc diffusion indicated that NA–ZHN/chitosan and NA–ZHN composites are the most active nanocomposites with a zone of inhibition of 49 mm E. coli and 37 mm against S. aureus for the composite. On the other hand, the use of NA showed the lowest effect on all tested microorganisms in Table 2. The average size of the particles was around 200 micrometers for NA on the microparticle scale. The antibacterial activity of NA–ZHN might be due to their small size, which is 100 times smaller than NA. The size of particles plays a significant role in antibacterial activity. The antibacterial activity of the NA–ZHN nanocomposite is influenced by the dimensions of the particles; smaller particles have a greater antimicrobial effect because as the particles get smaller, their surface area to volume ratio increases and smaller particles have an easier time in getting through the cell membrane and the cell wall relative to larger nanoparticles.31| Bacterium | Zone of inhabitation (mm) | ||
|---|---|---|---|
| Nalidixic acid | Nalidixic acid–ZHN | Nalidixic acid–ZHN/chitosan | |
| S. aureus | <13 | 29 | 37 |
| B. subtilis | <13 | 24 | 34 |
| E. coli | 19 | 33 | 49 |
Nanocomposites possess well-developed surface chemistry and chemical stability that make them easier to interact with microorganisms and easier to adhere to the cell wall of the microorganisms, causing their destruction and leading to the death of the cell.32,33 This could be explained based on the nature of the material present in the cell wall. Gram-negative bacteria are surrounded by a thin peptidoglycan cell wall and Gram-positive bacteria are surrounded by layers of peptidoglycan many times thicker than those found in Gram-negative bacteria. Thus, an easier permeability could be achieved in the case of Gram-negative organisms. This confirms that the nanocomposites show higher antibacterial activity with E. coli.
3.4 Minimum inhibitory concentration (MIC)
The antimicrobial activities of the nanocomposite against microorganisms were studied quantitatively in terms of MIC. Five nanocomposite suspensions at concentrations of 20, 10, 5, 1, and 0.5 μg ml−1 were tested and the results are given in Table 3. The MIC of nalidixic acid–ZHN/chitosan against E. coli and S. aureus shows the best effect for both strains. The antimicrobial activity of the nanocomposite may be related to the presence of Zn2+ ions, chitosan and particle size. Zinc ions exhibit antimicrobial activity against various bacterial and fungal strains34 and chitosan is a versatile material with proved antimicrobial activity.35| Bacterium | MIC (μg ml−1) | ||
|---|---|---|---|
| Nalidixic acid | Nalidixic acid–ZHN | Nalidixic acid–ZHN/chitosan | |
| S. aureus | >5 | >1 | >1 |
| B. subtilis | >10 | >5 | >5 |
| E. coli | >1 | >0.5 | >0.5 |
3.5 Release behaviors of NA–ZHN and NA–ZHN/chitosan
To investigate the drug release behaviors of ZHN and ZHN/chitosan nanocomposites, the samples were individually dispersed in PBS at pH 7.4 and 4.8. Fig. 8 shows the release behaviors of chitosan, ZHN and ZHN/chitosan at pH 7.4 and 4.8. Fig. 8A shows the effect of pH on the release performance of NA anions from the chitosan nanocomposite. At pH 7.4, the release rates of NA are slower than that at pH 4.8 and the release percentage of NA from chitosan at pH 7.4 was about 72% at 540 min, compared to 85% at 390 min at pH 4.8.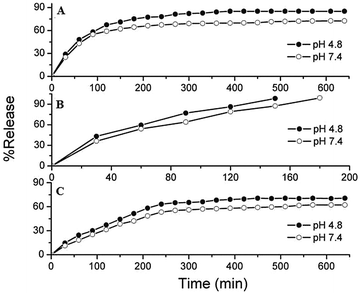 | ||
| Fig. 8 Release properties of nalidixic acid from (A) chitosan, (B) ZHN, and (C) the ZHN–chitosan nanocomposite at pH 4.8 and pH 7.4. | ||
The release rate of NA from ZHN and ZHN/chitosan is shown in Fig. 8B and C. Fig. 8B shows that the release of NA from ZHN was completed in 150 min at pH 4.8, compared with the slower release rate of NA at pH 7.4, where the time taken for 79% to be released was 150 min. This phenomenon is due to the electrostatic attraction between NA anions and the ZHN layers together with the ion-exchange property. These results confirmed the suitability of the ZHN intercalated systems for controlled release of the antibiotic drugs. ZHN is stable in a pH range of 7.4. The release behavior of NA shows a fast release at the beginning, 67% for the first 120 min, which is possibly due to very low dissolution of ZHN because it is not stable in acidic media. The slow release process shown may be related to the ion-exchange reaction between NA anions in the ZHN and phosphate anions in the buffer solution.36,37
The percentage release rate of NA–ZHN from chitosan at pH 7.4 reaches about 62% within about 640 min, compared to about 70% within about 450 min at pH 4.8. The NA–ZHN nanocomposite shows a faster release rate than NA–chitosan, while the NA–ZHN/chitosan nanocomposite shows a slower release rate than NA–chitosan and NA–ZHN. Therefore, this result confirms that the NA–ZHN and NA–ZHN/chitosan nanocomposites show good potential to be used for controlled release drug delivery.
4. Conclusion
A nalidixic acid–zinc hydroxide nitrate nanocomposite was synthesized by intercalating nalidixic acid into the interlayer space of zinc hydroxide nitrate by an ion-exchange method. Then, a nalidixic acid–zinc hydroxide nitrate/chitosan nanocomposite was prepared. To prove that interlayer nitrate ions were replaced by nalidixic acid anions X-ray diffraction, Fourier transform infrared, and thermogravimetric analysis were used. Nalidixic acid–zinc hydroxide nitrate showed a gallery height of 4.34 Å and nalidixic acid anions were arranged with a tilting angle of 32° in the interlayer with a monolayer arrangement. FT-IR spectroscopy exhibits the presence of functional groups of both zinc hydroxide nitrate layers and nalidixic acid anions. The antibacterial activity of the nanocomposite was studied by the diffusion disc method and the results showed that the antibacterial activity of the nanocomposite is more than that of the drug nalidixic acid. In vitro drug release of nalidixic acid–zinc hydroxide nitrate and nalidixic acid–zinc hydroxide nitrate/chitosan shows that the release rate from the nalidixic acid–zinc hydroxide nitrate/chitosan nanocomposite is remarkably lower than that from nalidixic acid chitosan and nalidixic acid–zinc hydroxide nitrate/chitosan at pH 7.4. All of these results suggest that nalidixic acid–zinc hydroxide nitrate and nalidixic acid–zinc hydroxide nitrate/chitosan materials are suitable for drug delivery and biological applications.Acknowledgements
Financial support from Azarbaijan Shahid Madani University research council is greatly appreciated.References
- M. Z. Hussein, N. Hashim, A. Hj. Yahaya and Z. Zainal, Solid State Sci., 2010, 12, 770–775 CrossRef CAS.
- S. H. Al Ali, M. Al-Qubaisi, M. Z. Hussein, M. Ismail, Z. Zainal and M. N. Hakim, Int. J. Nanomed., 2012, 7, 3351–3363 CrossRef.
- M. Ogawa and K. Kuroda, Chem. Rev., 1995, 95, 399–438 CrossRef CAS.
- P. Laurence, J. Noureddine and F. Fernand, Chem. Mater., 2000, 12, 3123 CrossRef.
- G. R. William and D. O’Hare, J. Mater. Chem., 2006, 16, 3065 RSC.
- M. Z. Hussein, S. H. Sarijo, A. Yahaya and Z. Zainal, J. Nanosci. Nanotechnol., 2007, 7, 2852–2862 CrossRef.
- E. Kandare and J. M. Hossenlopp, J. Phys. Chem. B, 2005, 109, 8469 CrossRef CAS.
- L. Tammaro, U. Costantino, A. Bolognese, G. Sammartino, G. Marenzi, A. Calignano, S. Teté, F. Mastrangelo, L. Califano and V. Vittoria, Int. J. Antimicrob. Agents, 2007, 29, 417 CrossRef CAS.
- M. R. Berbera, K. Minagawaa, M. Katoha, T. Morib and M. Tanaka, Eur. J. Pharm. Sci., 2008, 35, 354 CrossRef.
- Q. H. Zeng, A. B. Yu, G. Q. Lu and D. R. Paul, J. Nanosci. Nanotechnol., 2005, 5, 1574 CrossRef CAS.
- R. Marangoni, L. P. Ramos and F. Wypych, J. Colloid Interface Sci., 2009, 330, 303 CrossRef CAS.
- F. Barahuie, M. Z. R. Hussein, S. Fakurazi and Z. Zainal, Int. J. Mol. Sci., 2014, 15, 7750–7786 CrossRef CAS.
- M. Louer, D. Louer and D. Grandjean, Acta Crystallogr., Sect. B: Struct. Crystallogr. Cryst. Chem., 1973, 29, 1696–1703 CrossRef CAS.
- W. Stahlin and H. R. Oswald, Acta Crystallogr., Sect. B: Struct. Crystallogr. Cryst. Chem., 1970, 26, 860–863 CrossRef.
- M. Z. Hussein, A. S. Al, Z. Zainal and M. N. Hakim, Int. J. Nanomed., 2011, 6, 1373–1383 CrossRef CAS.
- S. Hasan, A. H. Al and M. Al-Qubaisi, Int. J. Nanomed., 2012, 7, 3351 CAS.
- F. Barahuie, M. Z. Hussein, S. AbdGani, S. Fakurazi and Z. Zainal, Int. J. Nanomed., 2014, 9, 3137–3149 CrossRef.
- P. M. de la Torre, Y. Enobakhare, G. Torrado and S. Torrado, Biomaterials, 2003, 24, 1499–1506 CrossRef CAS.
- M. Trikeriotis and D. F. Ghanotakis, Int. J. Pharm., 2007, 332, 176–184 CrossRef CAS.
- K. Jeejeebhoy, Gastroenterology, 2009, 137, S7–S12 CrossRef CAS.
- S. J. Xia, Z. M. Ni, Q. Xu, B. X. Hu and J. Hu, J. Solid State Chem., 2008, 181(10), 2610–2619 CrossRef CAS.
- U. Faiz, T. Butt, L. Satti, W. Hussain and F. Hanif, J. Ayub. Med. Coll. Abbottabad., 2011, 23(2), 18–21 Search PubMed.
- A. Abouzarzadeh, M. Forouzani, M. Jahanshahi and N. Bahramifar, J. Mol. Recognit., 2012, 25(7), 404–413 CrossRef CAS.
- J. S. Lee, Y. J. Jung, M. J. Doh and Y. M. Kim, Drug Dev. Ind. Pharm., 2001, 27(4), 331–336 CrossRef CAS.
- M. Georgeta, A.-J. Elie, L. Didier, P. Luc, C. Adrian and M. Guy, Curr. Drug Delivery, 2004, 1(3), 227–233 CrossRef CAS.
- J. Berger, M. Reist, J. M. Mayer, O. Felt and R. Gurny, Eur. J. Pharm. Biopharm., 2004, 57, 35 CrossRef CAS.
- C. Perez, M. Pauli and P. Bazevque, Acta Biologiae et. Medicine Experimentalis, 1990, 113–115 Search PubMed.
- C. Misra and A. J. Perrota, Clays Clay Miner., 1992, 40, 145–150 CAS.
- A. Debnath, N. K. Mogha and D. T. Masram, Appl. Biochem. Biotechnol., 2015, 175(5), 2659–2667 CrossRef CAS.
- W. Stählin and H. R. Oswald, Acta Crystallogr., Sect. B: Struct. Sci., 1970, 26, 860 CrossRef.
- G. A. Nirmala and K. Pandian, Colloids Surf., A, 2007, 297, 63–70 CrossRef.
- G. Rezaie Behbahani, M. Hossaini Sadr and H. Nabipour, Biophys. Rev. Lett., 2013, 08, 51 CrossRef.
- B. D. Korant, J. C. Kauer and B. F. Butterworth, Nature, 1974, 248, 588 CrossRef CAS.
- E. De Clercq, Met.-Based Drugs, 1997, 4, 173 CrossRef CAS.
- R. C. Goy, D. de Britto and O. B. G. Assis, Polímeros, 2009, 19(3), 241–247 CrossRef CAS.
- V. Ambrogi, G. Fardella, G. Grandolini, L. Perioli and M. C. Tiralti, AAPS PharmSciTech, 2002, 3, 77–82 CrossRef.
- M. Z. Bin Hussein, Z. Zainal, A. H. Yahaya and D. W. Foo, J. Controlled Release, 2002, 82(2–3), 417–427 CrossRef CAS.
| This journal is © The Royal Society of Chemistry and the Centre National de la Recherche Scientifique 2016 |

