Nickel oxide nanoparticles/ionic liquid crystal modified carbon composite electrode for determination of neurotransmitters and paracetamol†
Nada F.
Atta
*,
Asmaa H.
Ibrahim
and
Ahmed
Galal
Chemistry Department, Faculty of Science, Cairo University, 12013 Giza, Egypt. E-mail: anada@sci.cu.edu.eg; Fax: +20 0235727556; Tel: +20 0237825266
First published on 24th November 2015
Abstract
The ionic liquid crystal 1-butyl-1-methyl-piperidinium hexafluorophosphate and nickel oxide nanoparticles were used to construct a carbon composite electrode. This novel composite was used successfully as a sensor platform for the determination of paracetamol and some neurotransmitters such as dopamine, norepinephrine, levodopa and serotonin. Several advantages are realized in this approach due to the unique properties of nanomaterials and ionic liquid crystals, and the ease of fabrication of the carbon composite electrode. The modified sensor was evaluated and compared with nickel oxide nanoparticles/ionic liquid modified electrodes in the presence of surfactants, namely 1-n-hexyl-3-methyl imidazolium tetrafluoroborate and 1-butyl-4-methyl pyridinium tetrafluoroborate, for the electrocatalytic oxidation of paracetamol. Modification with ionic liquid crystals showed superior current signals compared to ionic liquids. The interaction of surfactants with neurotransmitters resulted in preconcentration of the drug at the ionic liquid crystal interface that allowed both ionic channeling and charge transfer mediation. Figures of merits with optimized performance are a linear dynamic range of 44.4 × 10⁻⁷–3.33 × 10⁻⁵ mol L−1 for paracetamol sensing with a correlation coefficient of 0.999 and a limit of detection of 8.61 × 10⁻⁹ mol L−1. The electrode was successfully employed for the direct determination of paracetamol in human urine samples, for paracetamol assay in pharmaceutical formulations and simultaneous determination of paracetamol and neurotransmitters. High reproducibility and selectivity in the presence of potential interfering species were ascertained for this electrode.
1. Introduction
Acetaminophen (N-acetyl-p-aminophenol or paracetamol) (ACOP) is one of the most common drugs used in the world and has a similar structure to aspirin. Acetaminophen acts as a pain-killer by inhibiting prostaglandin's synthesis in the central nervous system and relieves fever. ACOP action also extends to reduce other pains including migraine and muscular aches, neuralgia, back and rheumatic pain, and protect against ovarian cancer.1–6 It was reported that very few or almost no side effects are suffered by patients treated with ACOP.7,8The development of voltammetric sensors for the determination of catecholamine neurotransmitters (NTs) including dopamine (DA) has received considerable interest during the last few years.9 Other NTs of interest are levodopa (L-DOPA), serotonin (ST) and norepinephrine (NEP). Trace level measurements in the brain are especially important in studying the role of NTs in neuro-physiology and disease control. The changes in the level of NTs have been associated with various diseases and disorders, such as Parkinson's disease,10 Alzheimer's disease,11 Down's syndrome, Huntington's disease,12 schizophrenia, epilepsy and cocaine addiction.13 The determination of these important biological molecules is therefore of prime importance to the medical field and pharmaceutical industry.
The chemical structure of room temperature ionic liquids (RTILs) contains mainly ions. Some interesting properties of RTILs such as high chemical and thermal stability, relatively high ionic conductivity, negligible vapor pressure and wider electrochemical windows rendered these materials useful in several applications.14 Because of their relatively high ionic conductivity, electrode modification using RTILs was cited by several researchers in the last few years.15–18 The enhanced ionic conduction is also advantageous to allow substituting ILs for paraffin oil to construct carbon-based voltammetric electrodes. Electrocatalysis and several other enhancing properties proved effective when using carbon ionic liquid electrodes (CILEs) as probes in electrochemistry,19 gas and liquid chromatography,20 mass spectrometry,21 capillary electrophoresis22 and other sensors.23–30 The electrochemical behavior of electroactive molecules, such as clozapine, adenine, guanine, nitrite, dopamine, ascorbic acid and DNA, were also investigated using IL modified electrodes.31–36
Combining the unique properties of ionic liquids and liquid crystals is realized in ionic liquid crystals (ILCs). These materials are anisotropic in nature that allows control of thermal behavior through ion exchange. This is in contrast to conventional mesogens that often require tedious organic synthesis routes. The mesophase is developed and stabilized when ionic moieties are incorporated into the ILCs which distinguishes their properties from regular ionic liquids.37–40 In general, lamellar mesophases are favored because of the distinct segregation between ionic and non-ionic parts and cation–anion pairing. One of the most promising features of ionic liquid crystals is ionic conductivity that will widen their application as ingredient in the fabrication of electrode materials.
Nanostructured materials have also been used extensively as modifiers for electrochemical sensors for the analysis of environmental, biological, and pharmaceutical samples.41–44 Nano-materials provide enhanced electron transfer, large edge plane/basal plane ratios, and rapid kinetics of electrode processes.45–48 Metal oxide nanoparticles such as nickel oxide have been successfully used for immobilization and direct electrochemistry of biomolecules.49 Research on the synthesis of nanosized porous nickel oxide materials and their application in catalytic reactions and in industrial processes was mentioned in previous publications.50–52 Furthermore, due to the excellent electrocatalytic activity and good antifouling properties of electrodes modified with nickel oxide, these modified electrodes have been used for enhanced oxidation and determination of insulin, thiols, disulfides, mercaptans, and sulfur oxoanions.53–55
Surfactants are amphiphilic molecules with a hydrophilic head and a long hydrophobic tail. Surfactants adsorb on the electrode surface and affect the electrode/electrolyte interactions. The interactions at the interface affect the electrochemical processes of electroactive analytes.56,57 Thus several applications were reported for these compounds in electrochemistry and electroanalytical studies.58 Also, they have proven effective in the electroanalysis of some biological compounds and drugs.59–62 Surfactants were suggested to combine with the substrate and result in its adsorption on the electrode surface, which facilitated the electron or the substance transfer between the electrode and the solution.63–66
In this work, for the first time we introduce a new composite based on nickel oxide nanoparticles and an ionic liquid crystal in the presence of SDS (NiONps/ILCMCPE⋯SDS) for determination of paracetamol (ACOP) and neurotransmitters. The voltammetric response of the composite towards the electrooxidation of these compounds will be compared with composites based on nickel oxide nanoparticles and ionic liquids in the presence of SDS (NiONps/ILMCPE⋯SDS). The sensor will be tested for its stability and anti-interference ability via the simultaneous determination of ACOP/DA and selective determination of ACOP in the presence of AA and UA. Furthermore the sensor will be applied for direct determination of ACOP in human urine samples and for the drug assay in pharmaceutical formulations. This work will allow comparing the solid/solid interaction between ILCs and carbon-based structures with the liquid/solid interaction of ILs and carbon materials.
2. Experimental
2.1. Chemicals and reagents
All chemicals were of analytical grade and used without any further purification. Acetaminophen (ACOP), ascorbic acid (AA), uric acid (UA), dopamine (DA), norepinephrine (NEP), levodopa (L-DOPA), serotonin (ST), the ionic liquid crystal (1-butyl-1-methyl piperidinium hexafluorophosphate), ionic liquids (1-n-hexyl-3-methyl imidazolium tetrafluoroborate (ILMCPE1) and 1-butyl-4-methyl pyridinium tetrafluoroborate (ILMCPE2)), nickel oxide nanoparticles (NiONps) and sodium dodecyl sulfate (SDS) were purchased from Sigma (USA). The two ionic liquids are different in the nucleus (one is imidazolium based and the other is pyridinium based). Phosphoric acid and sodium hydroxide were purchased from Adwic Co. (Egypt), acetic acid was provided by Loba-Chemic Co. (India), and boric acid was from Polski Chemiczne (Poland). The chemicals were used without further treatment or purification. Britton–Robinson buffer (B–R buffer) was prepared by mixing different volumes of 0.04 M H3PO4, 0.04 M acetic acid and 0.04 M boric acid with an appropriate amount of 0.2 M NaOH to obtain the desired pH (2.0–9.0). Buffer solutions were kept in a refrigerator. All solutions were prepared from analytical grade chemicals and sterilized Milli-Q deionized water.2.2. Instrumental and experimental set-up
The solutions pHs were measured using a JENWAY 3510 pH meter (England) connected to a glass combination electrode. Scanning electron microscopy (SEM) measurements were carried out using a field emission FE-SEM (JEOL JSM-6360LA electron microscope). Energy dispersive X-ray analysis (EDXA) was used to identify the elemental composition of the surface.
![[thin space (1/6-em)]](https://www.rsc.org/images/entities/char_2009.gif) 000 Hz with an AC signal amplitude of 5 mV were applied on bare CPE, ILCMCPE, NiONps/ILCMCPE and NiONps/ILCMCPE⋯SDS which were tested in 1.0 × 10⁻³ M ACOP in B–R buffer (pH 7.4). The applied DC potential was determined from the cyclic voltammetry diagrams.
000 Hz with an AC signal amplitude of 5 mV were applied on bare CPE, ILCMCPE, NiONps/ILCMCPE and NiONps/ILCMCPE⋯SDS which were tested in 1.0 × 10⁻³ M ACOP in B–R buffer (pH 7.4). The applied DC potential was determined from the cyclic voltammetry diagrams.
2.3. Analysis in spiked urine
Urine samples were obtained from healthy volunteers without any pretreatment, and were diluted 400 times with B–R buffer (pH 7.4) to eliminate the matrix background effect. Standard ACOP provided by the National Organization for Drug Control and Research of Egypt was dissolved in B–R buffer pH 7.4 to make a stock solution with 1.0 × 10⁻³ M concentration. Successive additions of ACOP were added to 5 mL of diluted urine. The calibration graphs were constructed by plotting the peak current against drug concentration.3. Results and discussion
Composite electrodes are fabricated as indicated in the experimental section based on nickel oxide nanoparticles and an ionic liquid crystal in the presence of SDS (in solution) (NiONps/ILCMCPE⋯SDS). The electrochemical behavior of the proposed electrode will be studied and used for the determination of paracetamol (ACOP) and neurotransmitters. A comparison will also be made between the proposed electrode and composite electrodes based on nickel oxide nanoparticles and ionic liquids in the presence of SDS (NiONps/ILMCPE⋯SDS). Two types of ionic liquids will be tested (1-n-hexyl-3-methyl imidazolium tetrafluoroborate (ILMCPE1) and 1-butyl-4-methyl pyridinium tetrafluoroborate (ILMCPE2)). Other important parameters will be shown for the performance of the proposed sensor including surface morphological data.3.1. Cyclic voltammetry of ACOP at the modified electrodes
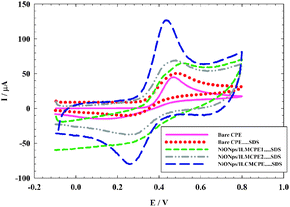
The electrochemical behavior of 1.0 × 10⁻³ mol L−1 ACOP was studied using four different working electrodes CPE⋯SDS, NiONps/ILMCPE1⋯SDS, NiONps/ILMCPE2⋯SDS and NiONps/ILCMCPE⋯SDS; the dots indicate that SDS is present in solution and not immobilized on the surface of the electrode. The cyclic voltammetry was measured in the range −100 to 800 mV in the presence of 10 μL of 0.01 M SDS (Fig. 1) in B–R buffer pH 7.4, at a scan rate 100 mV s−1. The anodic peak currents for the electrochemical oxidation of ACOP at bare CPE and at CPE in the presence of 10 μL of 0.01 M SDS (CPE⋯SDS) were 45 μA and 51 μA respectively at oxidation potential 0.470 V.NiONps exhibit enhanced electrocatalytic properties that facilitates the charge transfer at the interface.49–55 Modification with ILCs should further enhance the current signal of the oxidation by increasing the ionic conductance within the electrode material. The electrochemical oxidation of ACOP was examined using cyclic voltammetry at different modified electrodes. At NiONps/ILMCPE1⋯SDS and NiONps/ILMCPE2⋯SDS, the oxidation peak currents were 63 μA and 69 μA, respectively. The oxidation potential was shifted to a more positive value of 0.525 V for NiONps/ILMCPE1⋯SDS. The oxidation peak potential was 0.470 V at the NiONps/ILMCPE2⋯SDS electrode compared to CPE. At NiONps/ILCMCPE⋯SDS, an anodic peak current of 115 μA (at 0.425 V) was obtained which is nearly two and half times higher than that obtained at bare CPE with a negative shift of the oxidation potential value compared to NiONps/IL modified electrodes. The variation in the oxidation potential values illustrates the thermodynamic limitation with respect to each surface used in the electrochemical experiment.
Some ionic materials are also known to form amphitropic liquid crystals. Piperidinium salts for example have wider electrochemical potential window compared to the imidazolium and pyridinium analogues. The piperidinium salts deprotonate while keeping a localized positive charge on the nitrogen atom and on the aromatic ring for the other two salts. It will be advantageous to know that ILCs form ordered structures even in the solid state.67,68 A remarkable increase in the rate of electron transfer in such a system is expected which is due to the high polarizability and conductivity of ILCs.69,70 Another reason is the electrocatalytic activity of transition metal ions, electronic conductivity and good antifouling properties of electrodes modified with nickel oxide nanoparticles.71 ACOP is also expected to be in ionic form and the presence of SDS would therefore synergistically improve the current signal as the accumulation and preconcentration of the electrolyte increases at the interface.
3.2. Electrochemical impedance spectroscopy (EIS) studies
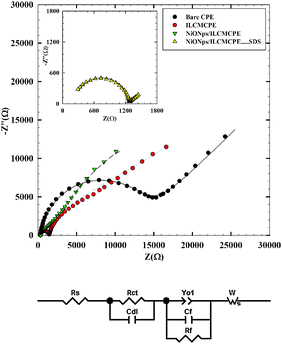
Since the major contribution to the enhancement of charge transfer is attributed to surface rearrangements, EIS helps in understanding the interfacial properties of surface modified electrodes. Therefore, EIS was used to investigate the nature of ACOP interaction at the NiONps/ILCMCPE⋯SDS surface in comparison to other electrode surfaces. EIS data are obtained for the modified electrode at ac frequencies varying between 0.1 Hz and 100 kHz with an applied potential according to the oxidation potential values (Epa) as indicated in Table 3 (for each electrode) (vs. Ag/AgCl) in the region corresponding to the electrolytic oxidation of 1.0 mmol L−1 ACOP in 0.04 M B–R buffer pH 7.4. Fig. 2A shows a typical impedance spectrum presented in the form of Nyquist plot of ACOP at CPE, ILMCPE, NiONps/ILMCPE and (inset) NiONps/ILCMCPE⋯SDS. The experimental data were compared and fitted to an equivalent circuit according to the non-linear least square fitting with Levenberg–Marquardt algorithm (the goodness of the fitting was verified according to the Kramers–Kronig fit). The circuit used some of the conventional circuit elements, namely resistance, capacitance, diffusion, and constant phase elements. The equivalent circuit is shown in Fig. 2B. In this circuit, Rs is the solution resistance, Rct is the charge transfer resistance (that will be affected by changes in the interface), and Rf is the film resistance (that will be affected by the inclusion of ILC and nanostructures). Capacitors in EIS experiments do not behave ideally; instead they act like a constant phase element (Yo). Therefore, Yo1 is a constant phase element representing surface roughness and a is its corresponding exponent (a is less than one). Cf is the film capacitance and Cdl represents the capacitance of the double layer. Diffusion can create impedance known as the Warburg impedance W (a constant diffusion parameter is considered in this case and assuming that diffusion within the film will also be affected by interfacial changes).Table 1 lists the best fitting values calculated from the equivalent circuit for the impedance data. The error analysis is χ2 = 3.48 × 10⁻³, the weighed sum of squares = 1.27 × 10⁻² and the goodness of fit is 1.048 × 10⁻³. The NiONps/ILCMCPE⋯SDS shows increased values of the interfacial capacitance component compared to the other electrodes due to an increase in ionic accumulation at the surface of the electrode. The value of Rct decreases in the interfacial electron transfer region which is attributed to the selective interaction between NiONps/ILCMCPE⋯SDS and ACOP. Good electronic and ionic conductivity of NiONps/ILCMCPE⋯SDS resulted in the observed increase in the current signal for the electro-oxidation process. An important feature in the data is the decrease in the value of film resistance (Rf) that ascertains the increase in ionic conductance upon ILC inclusion and due to the increase in the metallic character imparted by the presence of nanostructures in the film. The roughness factor represented by an increase in the value of Yo1 is noticed as the solid components increase in the structure.
| E pa (mV) | R s (kΩ cm2) | R ct (kΩ cm2) | C dl (μF cm−2) | R f (Ω cm2) | C f (μF cm−2) | W (kΩ S−1/2) | Y o1 (Ssa/cm2) | a | |
|---|---|---|---|---|---|---|---|---|---|
| Bare CPE | 470 | 0.258 | 1.61 | 1.13 | 14.6 | 0.146 | 15.7 | 0.124 | 0.18 |
| ILCMCPE | 482 | 0.252 | 0.641 | 1.20 | 6.41 | 2.17 | 7.11 | 0.819 | 0.33 |
| NiONps/ILCMCPE | 457 | 0.239 | 0.113 | 6.03 | 2.08 | 4.16 | 4.65 | 1.56 | 0.49 |
| NiONps/ILCMCPE⋯SDS | 425 | 0.198 | 0.100 | 6.12 | 1.27 | 6.72 | 2.13 | 7.88 | 0.75 |
3.3. Morphologies of the different electrodes
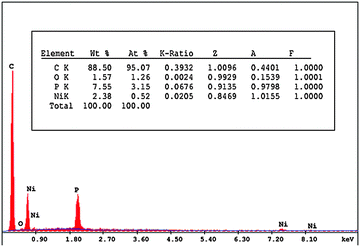
The surface homogeneity and roughness affect the extent of adsorption and rate of charge transfer. Thus, scanning electron microscopy (SEM) was used to characterize the morphology of the bare CPE, ILCMCPE, NiONps/ILCMCPE and NiONps/ILCMCPE⋯SDS. Fig. 3 represents the SEM morphology of the prepared electrodes. The SEM image of the bare carbon paste electrode (Fig. 3A) shows edge-structured layering of graphite flakes. The surface structure of the bare carbon paste electrode also shows that the graphite particles are covered by a very thin film of paraffin oil which is not clearly shown because of lack of resolution. The SEM image of ILCMCPE (Fig. 3B) shows clearly observed roughness increase which should result in a relatively large surface area. This could be attributed to the high viscosity of ILC used, which infiltrated into the void space between the graphite flaks. Fig. 3C shows a microstructure with a continuous grain growth of nanoparticles incorporated with ILC in NiONps/ILCMCP. Also, a spongy film is observed in Fig. 3D due to the surfactant film on the surface which influences the conductivity level of the film and helps in the attraction of ACOP to the electrode surface. It is worth mentioning that the scale of the SEM images differed in order to reveal the structural details for each surface. In addition, the energy dispersive X-ray (EDX) spectra of NiONps/ILCMCPE⋯SDS confirmed the presence of NiONps in the paste as shown in Fig. 4.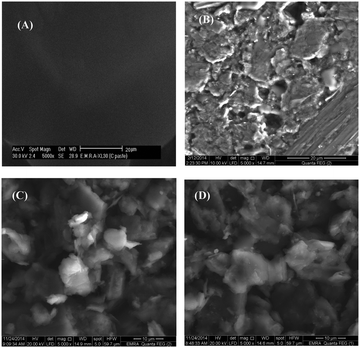 | ||
| Fig. 3 Scanning electron microscope images of different electrodes: (A) bare CPE, (B) ILCMCPE, (C) NiONps/ILCMCPE and (D) NiONps/ILCMCPE⋯SDS. | ||
3.4. Electrochemistry of ACOP and neurotransmitters
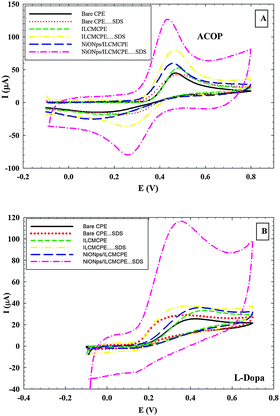
The voltammetric behavior of ACOP and some neurotransmitters (DA, NEP, ST and L-Dopa) was examined at bare CPE, bare CPE⋯SDS, ILCMCPE, ILCMCPE⋯SDS, NiONps/ILCMCPE and NiONps/ILCMCPE⋯SDS using cyclic voltammetry. Table 2 summarizes the electrochemical data for the oxidation of the studied compounds. Upon modification with NiONps/ILCMCPE⋯SDS, the oxidation peak current increased and the oxidation potential shifted to less positive values due to the improvement in the reversibility of the redox reaction and facilitation of the electron transfer process at the modified electrode. The thermodynamic limitation is realized in lower oxidation potential values and kinetically enhanced as manifested by the increase in the current values. Fig. 5 shows typical cyclic voltammograms of (A) 1.0 mM ACOP and (B) one of the neurotransmitters (L-Dopa), in B–R buffer pH 7.4 at scan rate 100 mV s−1 recorded at bare CPE (solid line), CPE⋯SDS (dotted line), ILCMCPE (small dashed line), ILCMCPE⋯SDS (dashed double dotted line), NiONps/ILCMCPE (large dashed line) and NiONps/ILCMCPE⋯SDS (dashed dotted line). The incorporation of NiONps into ILCMCPE in the presence of SDS resulted in an observable increase in the peak current, which indicated an improvement in the electrode kinetics and a decrease in the potential of oxidation substantially (i.e. thermodynamically feasible reaction) in all the compounds studied compared to the bare CPE. The results confirmed the key role played by NiONps, ILC and SDS in the catalytic oxidation, which enhances the electrochemical reaction as discussed earlier. IL incorporation resulted in an increase in the conductivity that is relatively less pronounced compared to ILC. At this stage it could be concluded that surface alignment of ILCs proved effective in this application.| ACOP | DA | L-DOPA | ST | NEP | ||||||
|---|---|---|---|---|---|---|---|---|---|---|
| I (μA) | E (mV) | I (μA) | E (mV) | I (μA) | E (mV) | I (μA) | E (mV) | I (μA) | E (mV) | |
| Bare CPE | 45 | 472 | 13 | 379 | 12 | 412 | 17 | 435 | 23 | 414 |
| Bare CPE⋯SDS | 51 | 472 | 43 | 232 | 29 | 374 | 36 | 387 | 15 | 270 |
| ILCMCPE | 53 | 482 | 25 | 304 | 34 | 445 | 37 | 417 | 38 | 404 |
| ILCMCPE⋯SDS | 80 | 464 | 65 | 252 | 37 | 386 | 60 | 401 | 17 | 264 |
| NiONps/ILCMCPE | 60 | 457 | 32 | 312 | 36 | 445 | 32 | 425 | 11 | 329 |
| NiONps/ILCMCPE⋯SDS | 115 | 425 | 111 | 257 | 102 | 339 | 100 | 417 | 98 | 363 |
3.5. Parameters affecting the electrode performance
| Epa (V) = 0.786–0.052 pH (vs. Ag/AgCl) with a correlation coefficient of 0.9999. |
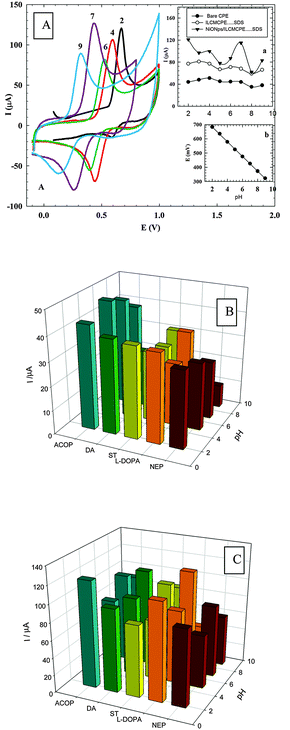
The slope was found to be −52.0 mV per pH-unit over the pH range of 2 to 9, compared to the theoretical value of −59 mV. This indicates that the number of protons and electrons involved in the oxidation mechanism is equal. The current response was also affected by changing the pH of the medium. Fig. 6B and C show the graph of current response of some neurotransmitters and ACOP at different pH values at bare CPE and NiONps/ILCMCPE⋯SDS, respectively. It is clear that at NiONps/ILCMCPE⋯SDS the anodic current responses for all neurotransmitter compounds and ACOP through the whole pH range are higher than the values obtained at bare CPE.
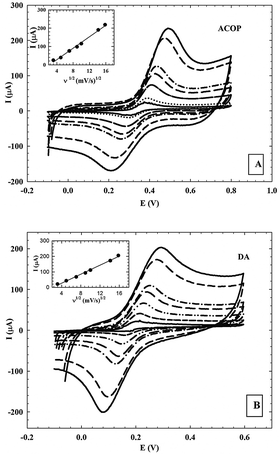
| ipa (10−6 A) = −15.707ν1/2 (V s−1)1/2 + 35.333 (n = 7, γ = 0.9985) and ipa (10−6 A) = −14.497ν1/2 (V s−1)1/2 + 31.099 (n = 7, γ = 0.9972) |
This suggests that the electrode reaction is under diffusion control.
| Ipa = (2.69 × 10⁵)n3/2AC0D01/2ν1/2 |
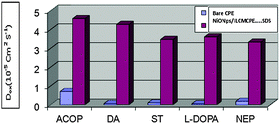
The apparent surface area used in the calculations did not take into account the surface roughness. The apparent diffusion coefficients, Dapp, of ACOP and the studied neurotransmitters on NiONps/ILCMCPE⋯SDS in B–R buffer (pH 7.4) were calculated from cyclic voltammetry (CV) experiments and were in the range of 3.33 × 10⁻⁵–4.58 × 10⁻⁵ cm2 s−1. These results were compared to those calculated in the case of bare CPE, which were in the range of 4.99 × 10⁻⁷–7.02 × 10⁻⁶ cm2 s−1, as shown in Fig. 8. This graph indicated the fast mass transfer of the analyte molecules towards the NiONps/ILCMCPE⋯SDS surface from bulk solutions and/or the fast electron transfer process of electrochemical oxidation of the analyte molecule at the electrode solution interface.72,73 Furthermore, it also showed that the redox reaction of the analyte species took place at the surface of the electrode under the control of the diffusion of the molecules from solution to the electrode surface. The calculated Dapp values at the bare CPE and NiONps/ILCMCPE⋯SDS showed that NiONps, ILC and SDS improve the electron transfer kinetics at the electrode/solution interface.
3.6. Effect of interferences on the behavior of ACOP
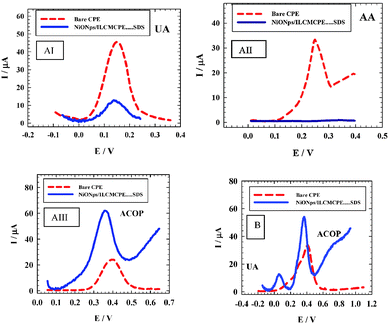
In biological samples, AA and UA are the common important interferences for the determination of neurotransmitters at sensor surfaces. To check the sensitivity and selectivity of the sensor in the presence of these interferences, the NiONps/ILCMCPE⋯SDS was used for voltammetric detection of ACOP in the presence of AA and UA. Mixture (I) contains 1.0 mM AA, 1.0 mM UA and 1.0 mM ACOP in B–R buffer pH 7.4. The applied scan rate was 10 mV s−1 using differential pulse mode. Fig. 9 (curve AI) shows the differential pulse voltammograms obtained with the bare CPE (dashed line) and NiONps/ILCMCPE⋯SDS (solid line) in 1 mmol L−1 UA. The current response at the CPE was 43.1 μA and decreased to 11.4 μA at the NiONps/ILCMCPE⋯SDS (solid line). The determination of 1.0 × 10⁻³ mol L−1 AA on bare CPE (dashed line) gives a peak current of 22.7 μA which disappears when using NiONps/ILCMCPE⋯SDS (solid line) (curve AII).Curve AIII shows that the anodic peak current of 1.0 × 10⁻³ mol L−1 ACOP increased from 25.04 μA in the case of bare CPE (dashed line) to 52.67 μA when using NiONps/ILCMCPE⋯SDS (solid line). Curve B shows the voltammograms of mixture (I), under the same optimum experimental conditions. As can be noticed in the case of bare CPE (dashed line) only one peak for UA, AA and ACOP has been obtained, while in the case of NiONps/ILCMCPE⋯SDS (solid line) one sharp peak with relatively high peak current for ACOP at 365 mV and a second peak for uric acid were observed as illustrated in Fig. 9B.
The results of this study show that it is possible to determine ACOP selectively in the presence of high concentration of AA and UA by using the proposed modified electrode. Other interference studies are given in ESI,† S3 for serotonin, norepinephrine and L-Dopa.
3.7. Simultaneous determination of ACOP and DA
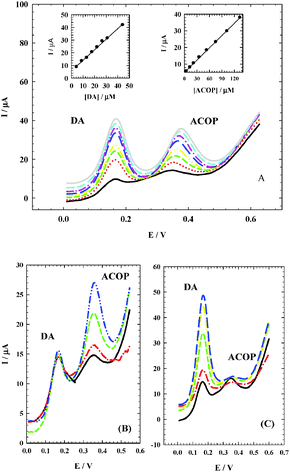
It is very important to determine ACOP in the presence of neurotransmitter compounds which play important roles in various biological, pharmacological and physical processes in the human body. Dopamine (DA) is one of the most important neurotransmitters that are widely distributed in the mammalian central nervous system for message transfer and it plays a very important role in the functioning of the central nervous system. As shown in Fig. 10A, ACOP exhibits well-defined differential pulse voltammograms (DPV) with good separation from DA in B–R buffer (pH 7.4) by changing the concentration of both ACOP (4.4–133.0 μmol L−1) and DA (4.4–36.0 μmol L−1). The current responses due to the oxidation of DA (at 170 mV) and ACOP (at 374 mV) with a peak separation of 204 mV were observed. With the increase in their concentrations, the current responses of both ACOP and DA were increased linearly with a correlation coefficient of 0.9996 and 0.9981, respectively; also the regression equation for ACOP was found to be Ip (μA) = 0.247c (μmol L−1) + 4.951, while the regression equation for DA was Ip (μA) = 0.832c (μmol L−1) + 5.748.Simultaneous determination of ACOP and DA in the mixture was also investigated when the concentration of one species was changed whereas the other was kept constant. Fig. 10B shows that the peak current of ACOP increases with an increase in the ACOP concentration (8.89–89.0 μmol L−1) while the concentration of DA was kept constant (4.4 μmol L−1). Also when the concentration of ACOP was kept constant (4.0 μmol L−1), the oxidation peak current of DA was positively proportional to its concentration (4.44–44.11 μmol L−1) (Fig. 10C).
It should be noted that the change of concentration of one compound did not have a significant influence on the peak current and peak potential of the other compound.
3.8. Analytical characterization of ACOP and reproducibility
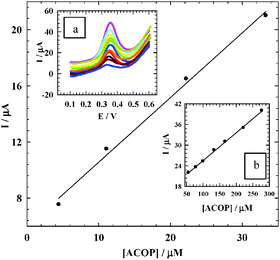
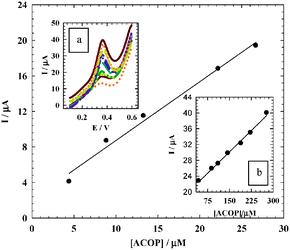
Pulse voltammetric techniques, such as DPV, are effective and rapid electroanalytical techniques with well-established advantages, including good discrimination against background current and low detection limits. To prove the sensitivity of NiONps/ILCMCPE⋯SDS towards the electrochemical measurement of ACOP, the effect of changing the concentration of ACOP in B–R buffer (pH 7.4) using DPV mode was studied (Fig. 11). The following are the parameters for the DPV experiments: Ei = 100 mV, Ef = 600 mV, scan rate = 10 mV s−1, pulse width = 25 ms, pulse period = 200 ms, and pulse amplitude = 10 mV. From the electrochemical responses in Fig. 11, the calibration plots were linearly related to ACOP concentration over a relatively short linear range of 44.4 × 10⁻⁷ to 3.33 × 10⁻⁵ mol L−1 with a regression equation of Ip (μA) = 0.461c (μM) + 5.951 and correlation coefficient 0.9997 and a large range of 5.56 × 10⁻⁵ to 2.78 × 10⁻⁴ mol L−1 with a regression equation of Ip (μA) = 0.081c (μM) + 17.443 and correlation coefficient 0.9998.The limits of detection (LOD) and the limits of quantitation (LOQ) were calculated from the oxidation peak currents using the following equations:
| LOD = 3s/m |
| LOQ = 10s/m |
| Electrode used | Limit of detection (LOD) (M) | Ref. |
|---|---|---|
| Dipyrromethene–Cu(II) monolayer modified gold electrode | 1.2 × 10⁻⁴ | 74 |
| Carbon ionic liquid electrode | 0.3 × 10⁻⁶ | 75 |
| Nanogold modified indium tin oxide electrode | 1.8 × 10⁻⁷ | 76 |
| Fullerene modified glassy carbon electrode | 5.0 × 10⁻⁵ | 77 |
| Boron-doped diamond electrode | 4.9 × 10⁻⁷ | 78 |
| MWNT modified basal plane pyrolytic graphite electrode | 1.0 × 10⁻⁸ | 79 |
| CNT modified screen-printed carbon electrode | 1.0 × 10⁻⁷ | 80 |
| NiONps/ILCMCPE⋯SDS | 8.6 × 10⁻⁹ | This work |
3.9. Validation in pharmaceutical and urine samples
The proposed sensor was validated for drug determination in formulation and urine according to the parameters described in the WHO technical report series.81 From the pH study using the proposed electrode (Section 3.5.1, Fig. 6), a negative shift in the oxidation potential of ACOP is observed as the pH increases. The highest current response was observed however at pH 7, and the method adopted was considered robust for this pH. The obtained validation results are described in Table S2 (ESI† S2). After the validation of the proposed sensor electrode, the tablets purchased from drug stores and urine samples spiked with ACOP were analyzed and the data are given in the following sections.| [Tablet] taken (×10−6 M) | [Standard] added (×10−6 M) | [Found] (×10−6 M) | Recovery (%) | %RSD |
|---|---|---|---|---|
| 5.0 | 5.00 | 10.110 | 101.10 | 0.35 |
| 10.0 | 15.260 | 101.73 | 0.21 | |
| 20.0 | 25.060 | 100.24 | 0.14 | |
| 30.0 | 35.108 | 100.31 | 0.34 | |
| 50.0 | 55.980 | 101.78 | 0.84 |
The analysis of the obtained responses allowed the conclusion that the drug excipients do not significantly interfere with the proposed method. Thus, the practical application was demonstrated with the determination of paracetamol directly in pharmaceutical formulations with satisfactory results. From Table 4 we can see that the recovery data obtained by the standard addition method for ACOP in drug formulations were found to be in the range of 100.24% to 101.78% and the relative standard deviation (RSD) was in the range of 0.14% to 0.84%, suggesting that NiONps/ILCMCPE⋯SDS has a high reproducibility and it would be a useful electrode for the quantitative analysis of ACOP in pharmaceutical formulations.
| [ACOP] added (M) × 10−6 | [ACOP] founda (M) × 10−6 | Recovery (%) | SD × 10−7 | S.Eb × 10−7 | C.L.c × 10−7 |
|---|---|---|---|---|---|
| a Mean of five determinations. b Standard error = SD/√n. c C.L. confidence at 95% confidence level and 4 degrees of freedom (t = 2.776). | |||||
| 6.0 | 6.12 | 102.0 | 0.83 | 0.48 | 2.06 |
| 10.0 | 10.1 | 101.0 | 2.64 | 1.18 | 3.28 |
| 25.0 | 25.6 | 102.5 | 3.22 | 1.86 | 3.98 |
| 50.0 | 49.8 | 99.6 | 2.09 | 0.85 | 2.20 |
4. Conclusion
In the present work, a novel sensor based on an ionic liquid crystal (1-butyl-1-methyl piperidinium hexafluorophosphate), nickel oxide nanoparticles and sodium dodecyl sulfate was used for the electrochemical determination of acetaminophen and some neurotransmitters. Ionic liquid crystal (1-butyl-1-methyl piperidinium hexafluorophosphate), nickel oxide nanoparticles and sodium dodecyl sulfate enhanced the sensitivity of the carbon paste electrode towards different compounds; furthermore, the combination of ionic liquid crystal (1-butyl-1-methyl piperidinium hexafluorophosphate), nickel oxide nanoparticles and sodium dodecyl sulfate has been proved to be efficient for the electrocatalytic oxidation of paracetamol in biological fluids. Simultaneous determination of acetaminophen with dopamine in a binary mixture was achieved with good separation. On the other hand, this sensor shows anti-interference ability; it can simultaneously determine acetaminophen with high current response in the presence of a large amount of ascorbic acid and uric acid and the method was simple, sensitive and successfully applied for the determination of acetaminophen in human urine and in commercial tablets with good precision and accuracy. Under the optimum conditions, calibration plots for acetaminophen were linear in the ranges of 44.4 × 10⁻⁷ to 3.33 × 10⁻⁵ mol L−1 and 5.56 × 10⁻⁵ to 2.78 × 10⁻⁴ mol L−1 with correlation coefficients of 0.9997 and 0.9998 and a detection limit of 8.613 × 10⁻⁹ mol L−1 and a limit of quantitation of 2.871 × 10⁻⁸ mol L−1 for the small range. The good properties of this modified electrode will expand its application in the electrochemical field for the determination of other drugs in biological fluids without any interference.Acknowledgements
The authors express their gratitude to the University of Cairo (Office of Vice President for Graduate Studies and Research) for providing partial financial support through “The Young Researchers' Program.”References
- Martindale: the Extra Pharmacopoeia, ed. A. Wade, The Pharmaceutical Press, London, 27th edn, 1979 Search PubMed.
- C. J. Nikles, M. Yelland, C. D. Marc and D. Wilkinson, Am. J. Therap., 2005, 12, 80–91 CrossRef.
- K. Brandt, Drugs, 2003, 63, 23–41 CrossRef CAS PubMed.
- A. A. Taylor, Baylor College of Medicine-Abstract from Munich Meeting (Thirteenth IUPHAR Congress of Pharmacology), 1998.
- National Institute of Health; National Heart, Lung and Blood Institute; National Asthma Initiative; Fact sheet 12-5075: “Asthma Care Quick Reference: Diagnosing and Managing Asthma,” 2009.
- D. W. Cramer, B. L. Harlow, L. T. Ernstoff, K. Bohlke, W. R. Welch and E. R. Greenberg, Lancet, 1998, 351, 104–107 CrossRef CAS.
- M. Knochen, J. Giglio and F. R. Boaventure, J. Pharm. Biomed. Anal., 2003, 33, 191–197 CrossRef CAS PubMed.
- V. Rodenas, M. S. Garcia, C. Sanchez-Pedreno and M. I. Albero, Talanta, 2000, 52, 517–523 CrossRef CAS PubMed.
- X. Huang, Y. Li, Y. Chen and L. Wang, Sens. Actuators, B, 2008, 134, 780–786 CrossRef CAS.
- M. Ebadi, S. Sharma, S. Shavali and H. E. L. Refaey, J. Neurosci. Res., 2008, 67, 285–289 CrossRef PubMed.
- C. Bruhlmann, F. Ooms, P. A. Carrupt, B. Testa, M. Catto, F. Leonetti, C. Altomare and A. Carotti, J. Med. Chem., 2001, 44, 3195–3198 CrossRef CAS PubMed.
- A. J. Shah, F. Crespib and C. Heidbrederb, J. Chromatogr. B: Anal. Technol. Biomed. Life Sci., 2002, 781, 151–163 CrossRef CAS.
- S. K. Lunsford, H. Choi, J. Stinson, A. Yeary and D. D. Dionysiou, Talanta, 2007, 73, 172–177 CrossRef CAS PubMed.
- W. Sun, Z. Zhai, D. D. Wang, S. F. Liu and K. Jiao, Bioelectrochemistry, 2009, 74, 295–300 CrossRef CAS PubMed.
- M. Opallo and A. Lesniewski, J. Electroanal. Chem., 2011, 656, 2–16 CrossRef CAS.
- A. A. Ensafi, B. Rezaei and H. Krimi-Maleh, Ionics, 2011, 17, 659–668 CrossRef CAS.
- X. Liu, Z. Ding, Y. He, Z. Xue, X. Zhao and X. Lu, Colloids Surf., B, 2010, 79, 27–32 CrossRef CAS PubMed.
- B. N. Chandrashekar, B. E. Kumara Swamy, N. B. Ashoka and M. Pandurangachar, J. Mol. Liq., 2012, 165, 168–172 CrossRef CAS.
- C. Díaza, C. García, P. Iturriaga-Vásquez, M. J. Aguirre, J. P. Muena, R. Contreras, R. Ormazábal-Toledo and M. Isaacs, Electrochim. Acta, 2013, 111, 846–854 CrossRef.
- P. Sun and D. W. Armstrong, Anal. Chim. Acta, 2010, 661, 1–16 CrossRef CAS PubMed.
- S. Pandey, Anal. Chim. Acta, 2006, 556, 38–45 CrossRef CAS PubMed.
- W. Qin and S. F. Y. Li, Electrophoresis, 2002, 23, 4110–4116 CrossRef CAS PubMed.
- D. Silvester, Analyst, 2011, 136, 4871–4882 RSC.
- W. Sun, Y. Wang, S. Gong, Y. Cheng, F. Shi and Z. Sun, Electrochim. Acta, 2013, 109, 298–304 CrossRef CAS.
- L.-N. Qu, J. Wu, X.-Y. Sun, M.-Y. Xi and W. Sun, J. Chin. Chem. Soc., 2010, 57, 701–707 CrossRef CAS.
- H. Beitollah, M. Goodarzian, M. A. Khalilzadeh, H. Karimi-Maleh, M. Hassanzadeh and M. Tajbakhsh, J. Mol. Liq., 2012, 173, 137–143 CrossRef CAS.
- B. Kavosi, A. Salimi, R. Hallaj and K. Amani, Biosens. Bioelectron., 2014, 52, 20–28 CrossRef CAS PubMed.
- A. A. Ensafi, H. Bahrami, B. Rezaei and H. Karimi-Maleh, Mater. Sci. Eng., C, 2013, 33, 831–835 CrossRef CAS PubMed.
- W. Sun, Q. Jiang, M. Yang and K. Jiao, Bull. Korean Chem. Soc., 2008, 29, 915–920 CrossRef CAS.
- L. Liu, C. Duan and Z. Gaoi, J. Serb. Chem. Soc., 2012, 77, 483–496 CrossRef CAS.
- H. Liu, P. He, Z. Li, C. Sun, L. J. Shi, Y. Liu, G. Y. Zhu and J. H. Li, Electrochem. Commun., 2005, 7, 1357–1363 CrossRef CAS.
- W. Sun, M. X. Yang, R. F. Gao and K. Jiao, Electroanalysis, 2007, 19, 1597–1602 CrossRef CAS.
- W. Sun, Y. Li, Y. Duan and K. Jiao, Biosens. Bioelectron., 2008, 24, 988–993 CrossRef CAS PubMed.
- F. Xiao, F. Zhao, J. Li, L. Liu and B. Zeng, Electrochim. Acta, 2008, 53, 7781–7788 CrossRef CAS.
- M. Arvand and M. Ghasempour Shiraz, Electroanalysis, 2012, 24, 683–690 CrossRef CAS.
- M. Musameh and J. Wang, Anal. Chim. Acta, 2008, 606, 45–49 CrossRef CAS PubMed.
- Q. Zhang, C. Shan, X. Wang, L. Chen, L. Niu and B. Chen, Liq. Cryst., 2008, 35, 765–772 CrossRef CAS.
- Q. Zhang, C. Shan, X. Wang, L. Chen, L. Niu and B. Chen, Liq. Cryst., 2008, 35, 1299–1305 CrossRef CAS.
- S. Kumar and S. K. Pal, Tetrahedron Lett., 2005, 46, 2607–2610 CrossRef CAS.
- J. Motoyanagi, T. Fukushima and T. Aida, Chem. Commun., 2005, 101–103 RSC.
- M. Elysi and M. A. Khalilzadeh, Food Chem., 2013, 141, 4311–4317 CrossRef PubMed.
- E. Afsharmanesh, H. Karimi-Maleh, A. Pahlavan and J. Vahedi, J. Mol. Liq., 2013, 181, 8–13 CrossRef CAS.
- H. J. Jeon, S. C. Yi and S. G. Oh, Biomaterials, 2003, 24, 4921–4928 CrossRef CAS PubMed.
- A. A. Ensafi, E. Khoddami, B. Rezaei and H. Karimi-Maleh, Colloids Surf., B, 2010, 81, 42–49 CrossRef CAS PubMed.
- H. Beitollahi, H. Karimi-Maleh and H. Khabazzadeh, Anal. Chem., 2008, 80, 9848–9851 CrossRef CAS PubMed.
- M. Roodbari Shahmiri, A. Bahari, H. Karimi-Maleh, R. Hosseinzadeh and N. Mirnia, Sens. Actuators, B, 2013, 177, 70–77 CrossRef.
- R. Moradi, S. A. Sebt, H. Karimi-Maleh, R. Sadeghi, F. Karimi, A. Baharie and H. Arabi, Phys. Chem. Chem. Phys., 2013, 15, 5888–5897 RSC.
- M. Bijad, H. Karimi-Maleh and M. A. Khalilzadeh, Food Anal. Methods, 2013, 6, 1639–1647 CrossRef.
- A. Salimi, E. Sharifi, A. Noorbakhash and S. Soltanian, Biosens. Bioelectron., 2007, 22, 3146–3153 CrossRef CAS PubMed.
- T. You, O. Niwa, Z. Chen, K. Hayashi, M. Tomita and S. Hirono, Anal. Chem., 2003, 75, 5191 CrossRef CAS PubMed.
- W. Xing, F. Li, Z. Yan and G. Q. Lu, J. Power Sources, 2004, 134, 324–330 CrossRef CAS.
- H. Kamal, E. K. Elmaghraby, S. A. Ali and K. Abdel-Hady, Thin Solid Films, 2005, 483, 330–339 CrossRef CAS.
- A. Salimi, M. Roushani, S. Soltanian and R. Hallaj, Anal. Chem., 2007, 79, 7431–7437 CrossRef CAS PubMed.
- A. Salimi and M. Roushani, Electroanalysis, 2006, 18, 2129–2136 CrossRef CAS.
- A. Salimi, M. Roushani and R. Hallaj, Electrochim. Acta, 2006, 51, 1952–1960 CrossRef CAS.
- R. Vittal, H. Gomathi and K. J. Kim, Adv. Colloid Interface Sci., 2006, 119, 55–68 CrossRef CAS PubMed.
- M. Plavsic, D. Krznaric and B. Cosovic, Electroanalysis, 1994, 6, 469–474 CrossRef CAS.
- P. Manisankar, G. Selvanathan and C. Vedhi, Talanta, 2006, 68, 686–692 CrossRef CAS PubMed.
- N. F. Atta, A. Galal and R. A. Ahmed, Bioelectrochemistry, 2011, 80, 132–141 CrossRef CAS PubMed.
- N. F. Atta, A. Galal and R. A. Ahmed, J. Electrochem. Soc., 2011, 158, F52–F60 CrossRef CAS.
- N. F. Atta, S. A. Darwish, S. E. Khalil and A. Galal, Talanta, 2007, 72, 1438–1445 CrossRef CAS PubMed.
- C. Li, Y. Ya and G. Zhan, Colloids Surf., B, 2010, 76, 340–345 CrossRef CAS PubMed.
- S. S. Hu, Y. Q. Yan and Z. F. Zhao, Anal. Chim. Acta, 1991, 248, 103–108 CrossRef CAS.
- H. C. Yi, K. B. Wu, S. S. Hu and D. F. Cui, Talanta, 2001, 55, 1205–1210 CrossRef CAS PubMed.
- S. H. Zhang, K. B. Wu and S. S. Hu, Talanta, 2002, 58, 747–754 CrossRef CAS PubMed.
- S. S. Hu, K. B. Wu, H. C. Yi and D. F. Cui, Anal. Chim. Acta, 2002, 464, 209–216 CrossRef CAS.
- D. Wei and A. Ivaska, Anal. Chim. Acta, 2002, 607, 126–135 CrossRef PubMed.
- K. V. Axenov and S. Laschat, Materials, 2011, 4, 206–259 CrossRef CAS.
- F. Li, J. Song, C. Shana, D. Gaoa, X. Xua and L. Niua, Biosens. Bioelectron., 2010, 25, 1408–1413 CrossRef CAS PubMed.
- F. Marken, R. D. Webster, S. D. Bull and S. G. Davies, J. Electroanal. Chem., 1997, 437, 209–218 CrossRef CAS.
- R. Ojani, J. B. Raoof and Sh. Fathi, J. Solid State Electrochem., 2009, 13, 927–943 CrossRef CAS.
- N. Yang, Q. Wan and J. Yu, Sens. Actuators, B, 2005, 110, 246–251 CrossRef CAS.
- W. Qijin, Y. Nianjun, Z. Haili, Z. Xinpin and X. Bin, Talanta, 2001, 55, 459–467 CrossRef CAS PubMed.
- B. Saraswathyamma, I. Grzybowska, C. Orlewska, J. Radecki, W. Dehaen, K. G. Kumar and H. Radecka, Electroanalysis, 2008, 20, 2317–2323 CrossRef CAS.
- X. ShangGuang and H. Zhang, Anal. Bioanal. Chem., 2008, 391, 1049–1055 CrossRef PubMed.
- R. N. Goyal, V. K. gupta, M. Oyama and N. Bachheti, Electrochem. Commun., 2005, 7, 803–807 CrossRef CAS.
- R. N. Goyal and S. P. Singh, Electrochim. Acta, 2006, 51, 3008–3012 CrossRef CAS.
- B. C. Lourencao, R. A. Medeiros, R. C. Rocha-Filho, L. H. Mazo and O. Fatibello-Filho, Talanta, 2009, 78, 748–752 CrossRef CAS PubMed.
- R. T. Kachoosangi, G. G. Wildgoose and R. G. Compton, Anal. Chim. Acta, 2008, 618, 54–60 CrossRef CAS PubMed.
- P. Fanjul-Bolado, P. J. Lamas-Ardisana, D. Hernandez-Santos and A. Costa-García, Anal. Chim. Acta, 2009, 638, 133–138 CrossRef CAS PubMed.
- WHO Technical Report Series, No. 937; World Health Organization. Annex 4: “Supplementary guidelines on good manufacturing practices: validation; Appendix 4: Analytical method validation, 2006, 136–140.
Footnote |
| † Electronic supplementary information (ESI) available. See DOI: 10.1039/c5nj01804h |
| This journal is © The Royal Society of Chemistry and the Centre National de la Recherche Scientifique 2016 |

