DOI:
10.1039/C5NJ01772F
(Paper)
New J. Chem., 2016,
40, 596-605
The synthesis and curing kinetics study of a new fluorinated polyurethane with fluorinated side chains attached to soft blocks
Received
(in Montpellier, France)
8th July 2015
, Accepted 23rd October 2015
First published on 27th October 2015
Abstract
Fluorinated polyurethane (FPU) with fluorine in the side chain was obtained using fluorinated polyether glycol (FPO) with fluorinated side chains and 4,4′-diphenyl methane diisocyanate (MDI). The direct visual inspection of microstructures by SEM revealed that the separation degree of soft and hard segments decreased with the introduction of fluorinated groups into polyurethane soft segments, leading to a decrease in the crystallinity of FPU. The glass transition temperatures (Tg) measured by DMA indicated that the optimal working temperature window of FPU separating soft and hard glass transitions became narrow. And the mechanical properties and surface properties of the FPU were also measured. Curing kinetics of FPU was studied using a rotational rheometer, and the activation energy of FPU was obtained. The relationship between the curing temperature and the mobility of fluorinated groups was characterized by XPS. The result showed that F content in the FPU surface decreased with increasing curing temperature.
Introduction
Polyurethanes (PUs) are used in a wide variety of applications, such as protective coatings, elastomers, sealants, adhesives, and foams.1–6 Also, fluorinated polyurethanes (FPUs), which incorporate fluorinated blocks into the molecular chains, not only maintain most of the outstanding properties of PUs, but also offer many useful and desirable features, such as unique surface properties, high thermal stability and chemical resistance.7–10
Fluorocarbon chains have been incorporated into polyurethanes by fluorinated diisocyanates, chain extenders, polyether glycols, polyester glycols and end-cappers.11–17 However, because of the higher synthetic cost, fewer varieties of fluorinated diisocyanates, and lower molecular weight of fluorinated alcohols, the improvement of the properties of fluorinated polyurethane prepared was not significant compared with hydrogenated polyurethane.8,18 Now, most FPUs are synthesized using fluorinated polyether glycols as soft segments. S. C. Yoon et al.19,20 proposed that the soft segments have higher mobility and easily migrate to the surface region at room temperature. P. F. Liu et al.21 synthesized FPUs with fluoropolydiol. Owing to the high amount of fluorinated blocks in the main-chain of the polymer, FPUs have excellent mechanical properties, low surface tension and high temperature performance. M. Castellano et al.22 synthesized a series of fluorinated polyurethanes using perfluoropolyether (PFPE) and poly-ε-caprolactone (PCL) as soft blocks via a different polymerization procedure. They found that the strong incompatibility between hydrogenated and fluorinated components and between low-polar soft segments (PCLs) and polar hard blocks was an effective driving force promoting the microphase segregation. And the polymerization procedure was a key parameter for ruling the composition of polymeric chains, but it had little effect on the surface properties. Tao Liu et al.23 synthesized fluorinated polyurethane fluorine-containing pendent groups in soft segments using polybutyleneadipate (PBA) which compounded with fluorinate polyether diol (PFGE) as the soft-segment of FTPU. Fluorine can be enriched on the surface during processing resulting in the high content of fluorine on the surface, and the surface tension significantly decreased. R. P. Jia et al.24 used polyetherpolyol containing fluorine in the side chain and polytetramethylene ether glycol (PTMEG) as soft segments to obtain fluorinated polyurethane. However, the properties of fluorinated polyurethanes were strongly dependent on the mass ratio and segment compatibility of the mixed soft-segment.
A number of studies have been carried out on the structure, morphology, and properties of FPUs. Nevertheless, only a few studies have been published on the curing kinetics of FPUs. Owing to the low polarizability and strong electronegativity of the fluorine atom, the reactivity of hydroxy-terminated fluorinated polyether glycols is surely different from the conventional polyether diols.25,26 L. Mashlyakovskiy et al.27 studied the urethane reactions of cycloaliphatic and aromatic diisocyanates with hydroxyl-terminated fluoropolyethers (FPEs). They proposed that the FPE diols were attributed to the autocatalysis of isocyanate-hydroxyl reaction, and also, the reactivity with diisocyanates strongly depended on the structure of FPEs and their molecular weights. S. Turri et al.28 studied the catalyst effect on the crosslinking kinetics of fluorinated polyurethane. The aim of this investigation was to elucidate the curing kinetics of FPU and the relationship between the curing temperature and the mobility of fluorinated groups. In order to carry it out, firstly, we prepared fluorinated polyether glycol with fluorine-containing side chains (FPO) via “living/controlled” cationic ring-open polymerization of tetrahydrofuran (THF) and fluorine-containing epoxy compounds (FO). Then FPU with fluorine-containing pendent groups in soft segments was obtained using FPO as a soft segment. The morphology, dynamics, crystallization, thermal properties and surface properties of FPU were investigated. Last but not least, curing kinetics of FPU was studied using a rotational rheometer. And the effect of curing temperature on the mobility of fluorinated groups was studied by X-ray Photoelectron Spectroscopy (XPS).
Experimental
Materials
Diphenyl-methane-diisocyanate (MDI, Sigma, USA) and 1,4-butanediol (BDO, AR, Shanghai, China) were distilled under vacuum and dried over 4 Å molecular sieves. THF (AR, Shanghai, China) was kept for 48 h over KOH pellets to remove peroxide. After filtration, THF was heated over sodium for 12 h and then distilled. Ethylene glycol (EG) was distilled twice. Methylene chloride (AR, Shanghai, China) was washed three times with concentrated sulfuric acid to remove unsaturated impurities and then washed several times with water, a 5% solution of NaHCO3, and again with distilled water. After drying for 24 h over CaCl2, methylene chloride was distilled over CaH2 and kept in a vacuum ampoule over fresh CaH2. 2,2,3,3-Tetrafluoro-1-propanol (TFP, Sigma, USA), 1-propyl alcohol (1-PA) and epichlorohydrin (ECH) (AR, Shanghai, China) were used as supplied. Initiator BF3·OEt2 (AR, Shanghai, China) was used after being purified by vacuum distillation.
Synthesis of fluorinated polyether glycols and hydrogenated polyether glycols
Stoichiometric amounts of ECH and cyclohexane (as water-carrying agent) were charged into a 3-necked round bottom flask equipped with a mechanical stirrer under a dry nitrogen atmosphere. When the temperature was raised to 80 °C, NaOH and TFP were fed dropwise for 2 h. The reaction mixture was kept for another 3 h at 80 °C. A fluorinated epoxy compound (FO) was obtained after being purified by vacuum distillation.29 Fluorinated polyether glycol (FPO) was prepared by slowly adding FO to the reaction mixture containing bulk THF, EG and BF3·OEt2 under nitrogen at 0 °C in a glass flask and kept for 5 h. Then FPO was obtained after washing and distillation.30 Hydrogenated polyether glycol (HPO) was also prepared, and the synthesized process and reaction conditions of HPO were almost the same as those of the fluorinated polyether glycol, except using 1-PA instead of TFP.
Synthesis of fluorinated polyurethane and hydrogenated polyurethane
Fluorinate polyurethane (FPU) was synthesized using FPO as a soft segment, MDI as a hard segment and BDO as a chain extender. Under a nitrogen atmosphere at 50 °C, a stoichiometric amount of MDI was added into a four-necked flask equipped with a heating mantle, a mechanical stirrer, and a thermometer. After dissolution, FPO was added dropwise into the four-necked flask. The temperature was raised to 80 °C and kept for 3 h. Then the temperature was reduced to 40 °C. The stoichiometric amount of chain extender was added dropwise. Finally the polymers were dried in a vacuum at 70 °C for 16 h. The reaction completion was monitored by the absence of the IR-free NCO group at 2270 cm−1. The whole reaction processes are depicted in Scheme 1. Hydrogenated polyurethane (HPU) was also obtained for comparison purposes. The synthetic process and reaction conditions were the same as those of fluorinated polyurethanes, except using HPO as the soft segment. The material composition and molecular weights are listed in Table 1.
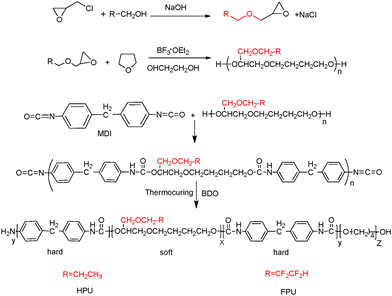 |
| | Scheme 1 The reaction process of FPU and HPU. | |
Table 1 The material composition and molecular weights
| Material |
Molar ration HPO (FPO)/MDI/BDO |
Soft segments (Mn) (g mol−1) |
Hard segment (wt%) |
M
n × 104GPC (g mol−1) |
MWDGPC |
| HPU |
1/3/2 |
HPO-650 |
53.6 |
2.16 |
3.17 |
| FPU |
1/3/2 |
FPU-670 |
47.2 |
2.70 |
3.10 |
Measurements
FTIR analysis.
The composition of the synthesized FPU was analyzed using a Fourier-transform infrared (FTIR) spectrometer (Perkin Elmer, SPECTRUM 100). The specimen was prepared by casting the polymer solution film on KBr discs. 32 scans were averaged for each sample in the range of 4000–400 cm−1 at a resolution of 4 cm−1.
1H NMR and 19F measurements.
1H NMR and 19F NMR spectra were recorded on a Bruker AC 400 NMR spectrometer with tetramethylsilane (TMS) as internal standard and deuterated dimethyl sulphoxide (DMSO-d6) as the solvent.
GPC analysis.
The molecular weights of HPU and FPU were characterized using a PL-GPC50 Gel-Permeation Chromatograph (GPC) with DMF as an eluent at a flow rate of 1.0 mL min−1. The measurement was carried out at 50 °C.
SEM analysis.
The fracture morphologies of FPU and HPU were assessed using an S-4800 field emission scanning electron microscope (FESEM; Hitachi, Japan). Samples were treated under liquid nitrogen before observation.
Thermal characterization.
The thermal response of HPU and FPU was characterized using a PE 8500 differential scanning calorimeter. The response was measured over a temperature range of −50 to 250 °C at a heating and cooling rate of 10 K min−1 under a nitrogen flow of 50 mL min−1.
Dynamic mechanical analysis (DMA).
Dynamic mechanical properties were measured on a dynamic mechanical thermal analyzer (NETZSCH, DMA 242). All the samples were measured in compression mode at a heating rate of 3 K min−1 and DF/CSF is 3.00N/0.30N at a frequency of 1 Hz over a temperature range of −80 to 200 °C. The sample size was 1.6 × 5.6 × 7.8 mm3.
X-ray diffractogram analysis (XRD).
X-ray diffractogram analysis was performed on a D8 Advance apparatus (Bruker, Germany) in the range of 2θ = 5–40°, with nickel-filtered Cu K-radiation (k = 0.154 nm) at an operation voltage of 40 kV and 30 mA, and the scan rate is 5° min−1.
The thermal stability analysis.
The thermal stabilities of FPU and HPU were obtained using a Perkin Elmer (PE) Pyris TGA thermogravimetric analyzer from room temperature to 800 °C at 10 K min−1 heating rates with N2 protection; the weights of the sample are 3–8 mg in all cases.
Tensile property analysis.
The tensile properties of FPU and HPU were measured using a Materials Testing Machine at room temperature and a relative humidity of 50%. A cross-head speed of 10 mm min−1 was used to determine the ultimate tensile strength and modulus as well as the elongation at break. The results reported are the mean values for five replicates.
Surface property analysis.
The surfaces properties of the HPU and FPU were analyzed by XPS and contact angles. XPS (PHI 5000 Versa Probe, Japan) was equipped with a monochromated AlKa X-ray source (15 kV, 25 W) and a take-off angle of 45° was used with an X-ray source.
The contact angles (DSA 30 KRUSS, Germany) were measured by the sessile drop method using telescoping goniometers at room temperature. 5–10 μL of distilled water was pumped from a microsyringe onto the surfaces of the HPU and FPU film, and the image was captured using a telescope fitted with a video camera. All the results were expressed as the average value of at least five independent measurements.
Curing kinetics analysis.
The curing kinetics of HPUs and FPUs were obtained using a Haake Mars-III rotational rheometer (Thermo Scientific, Germany) with a cone-plate geometry (diameter of 20 mm, gap of 0.5 mm). Oscillatory measurements were carried out with an oscillatory time sweep t of 15 min. The oscillation frequency was 1 Hz.
Results and discussion
FPU structure characterization
The FTIR spectra of HPU (a) and FPU (b) are shown in Fig. 1. In the spectrum, there are characteristic peaks of N–H (3305 cm−1). The characteristic bands at 1704 cm−1 and 1107 cm−1 confirm the carbonyl group of urethane and ether (C–O–C) of the ester group. There are C–H aliphatic stretch bands at 2958 and 2862 cm−1. Compared with Fig. 1(a), the absorption bands dealing with the vibration absorption of the C–F bond are observed in Fig. 1(b). The stronger characteristic absorption bands located at 1225 and 1205 cm−1 can be attributed to stretching vibrations of –CF2.31,32 And a combination of rocking and wagging vibration of the CF2 group at 798 and 672 cm−1 in the fingerprint region is detected. It can be concluded that F has been introduced into polyurethane. In addition, the absorption bands of the NCO group (2270 cm−1) and the OH group (3340 cm−1) are not found in the spectrum.
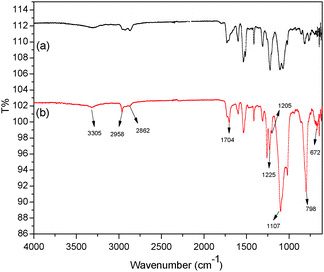 |
| | Fig. 1 FTIR spectra of (a) HPU and (b) FPU. | |
The 1H NMR spectrum of FPU is shown in Fig. 2. It is evident that the peak appears at 9.5 ppm, which is assigned to the protons of –OCONH–. The peaks at 6.33–6.25 ppm are relative to the fluoromethyl protons (–CHF2) and the peaks at 1.51–1.69 ppm are assigned to the –OCH2CH2CH2CH2O– protons of BDO and THF. The peaks at 3.68–3.88 ppm dealing with –OH2CCH(O)–CH2O– and –OCH2CF2 protons and the peaks assigned to the –OCH– protons (5.0 ppm) are also observed in the 1H NMR spectrum of FPU. The peak at 3.95 ppm is assigned to the protons of –COOCH2–. The peak appearing at 7.37–7.09 ppm is assigned to the protons of phenyl. And 19F NMR (Fig. 3) of FPU shows two different peaks remarkably. The resonant absorbance of fluorine in the –CF2– group shifted to −126.4 ppm. The resonance of the fluorine in –CF2H is observed at about −140.8 ppm. The results of 1H NMR and 19F NMR indicate that FPU based MDI and FPO has been prepared successfully.
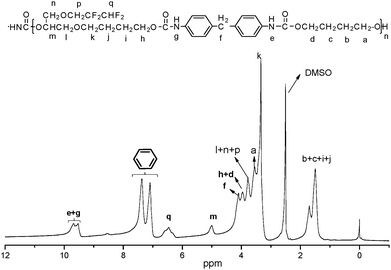 |
| | Fig. 2
1H NMR spectrum of FPU. | |
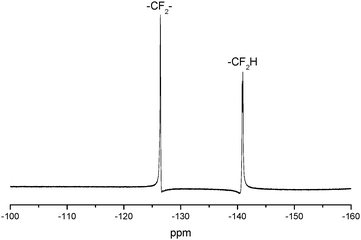 |
| | Fig. 3
19F NMR spectrum of FPU. | |
Microstructures of HPU and FPU
In this study, SEM was used to understand the bulk morphology of fluorinated polyurethane. Fig. 4 displays the SEM images of fractured surfaces of HPU and FPU. All samples exhibit a typical microphase separation morphology with dispersed hard domains in a continuous soft phase as is reported.33 It can be seen that the image of the HPU displays numerous micron-sized particles on the fracture surfaces. When F was introduced into the soft segment, the size of particles decreased, meanwhile the intermediate phase interface became smoother, indicating that the compatibility of the fluorinated soft and the hard segments was enhanced. This is because fluorine with strong electronegativity easily forms a hydrogen bond with N–H of the urethane groups, leading to the enhancement of interactions between soft and hard segments, and the decrease of the degree of microphase separation.34 It is believed that the introduction of a polar group into the side chains has an influence on the formation of the H-bond within PU, thereby affecting the microphase separation.35
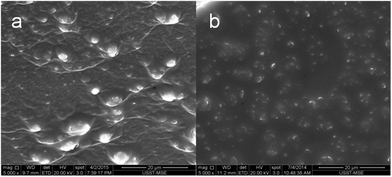 |
| | Fig. 4 SEM fracture surface of (a) HPU and (b) FPU. | |
XRD analysis
Fig. 5 shows the XRD patterns of HPU and FPU samples at room temperature. The feature at 21° as diffraction peaks is observed for polyurethanes arising from crystallinity in the hard domains.36 It can be found that 2θ at 21° becomes decreasingly evident for FPU, suggesting that the introduction of F into soft segments decreases the level of the degree of crystallinity in polyurethane. However, they are much subtler than the diffraction patterns, indicating the very low degree of hard segment crystallinity arising from ordered urea linkages.
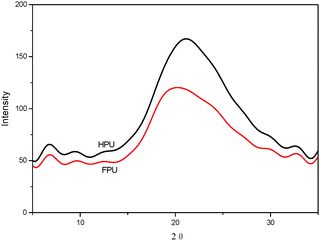 |
| | Fig. 5 XRD patterns of HPU and FPU. | |
DSC analysis
The DSC heating curves of HPU and FPU are shown in Fig. 6(a). Fig. 6(b) shows the magnified graph of endothermic peaks. The enthalpy ΔH was determined by the integration of the peak areas. The Tg and other thermal characteristic results are summarized in Table 2. It can be seen that Tg of the soft segment is observed in each sample. At higher temperatures, the existence of minor endothermic peaks results from the dissociation of domains containing long-range order.37 And the melting peak relatively decreases after introducing fluorine into the soft segments. This result indicates that in FPU the association of domains with long-range order becomes much lower. In the cooling scans (dotted lines in Fig. 6), no exothermic peak is observed in any of the materials, indicating the low degree of hard segment crystallinity, which is consistent with the results of XRD.
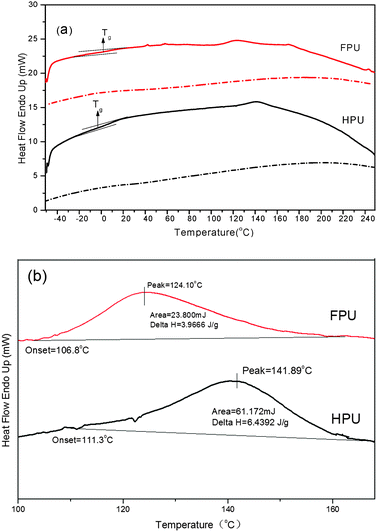 |
| | Fig. 6 DSC thermogram of HPU and FPU, (a) DSC curve and (b) the magnified graph of endothermic peaks at higher temperature. | |
Table 2 The analytical result of DSC and DMA
| |
Transition temperatures and enthalpies in DSC |
The storage and loss modulus (Tg + 50 °C); dissipation factor and glass transition temperature in DMA |
T
g![[thin space (1/6-em)]](https://www.rsc.org/images/entities/char_2009.gif) soft (°C) soft (°C) |
T
m (°C) |
ΔH (J g−1) |
T
g![[thin space (1/6-em)]](https://www.rsc.org/images/entities/char_2009.gif) soft (°C) soft (°C) |
T
g![[thin space (1/6-em)]](https://www.rsc.org/images/entities/char_2009.gif) hard (°C) hard (°C) |
E′ (MPa) |
E′′ (MPa) |
| HPU |
4.2 |
141.9 |
6.4 |
31.4 |
156.6 |
6.4 |
1.2 |
| FPU |
7.5 |
124.1 |
4.0 |
38.2 |
139.8 |
3.8 |
1.0 |
Dynamic mechanical analysis
Dynamic mechanical analysis provides information on glass transition and the mechanical behavior of a polymer. The dynamic mechanical properties of HPU and FPU are shown in Fig. 7. From the modulus vs. temperature curves (Fig. 7(a)), the storage modulus and loss modulus in the glassy plateau region of HPU are higher than those of FPU. In order to better understand the effect of the fluorinated side chain on the phase separation, the rubber plateau modulus (at temperature Tg + 50 °C) is listed in Table 2. An increased rubber plateau storage modulus for HPU but a decreased rubber plateau storage modulus for FPU are observed. The increase in storage modulus of HPU is believed to be the formation of more continuous hard phase morphology. The decreased storage modulus of FPU indicates enhanced phase mixing upon introducing the fluorinated side chain into polyurethane.38,39
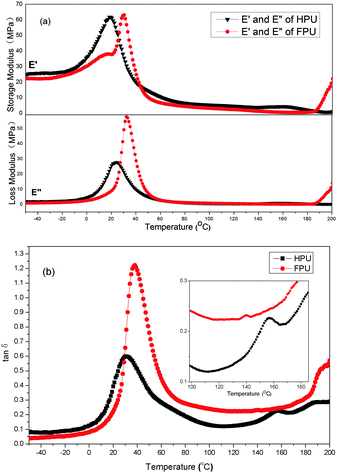 |
| | Fig. 7 DMA analysis comparison between HPU and FPU: (a) storage and loss modulus vs. temperature (b) tan![[thin space (1/6-em)]](https://www.rsc.org/images/entities/char_2009.gif) δ vs. temperature. δ vs. temperature. | |
On the other hand, polyurethane has two phases. The glass transition temperatures (soft segment and hard segment) of these two phases are very important characteristics of the interaction between the soft segment and the hard segment. Different from the results of DSC, all the samples exhibited two loss peaks corresponding to the glass transition temperatures of the soft segment and the hard segment (Fig. 7(b)). The Tg obtained from DMA for HPU and FPU is slightly higher than the DSC Tg, as expected from the dynamic nature of DMA experiments. In comparison to the loss peaks of HPU, the loss peak of FPU corresponding to the soft segment is shifted toward higher temperature, and the loss peak of the hard segment is shifted toward lower temperature, resulting in the increase in Tg of the soft segment and decrease in Tg of the hard segment. The result can be considered that the introduction of F into the soft segment enhances interactions between soft and hard segments, leading to the reduction of the extent of microphase separation. In addition, the constraint given by the hard phase reduced the degree of freedom of the soft chains. Thereby the onset of large-scale motion of a polymer near Tg requires a higher energy, increasing the value of the tan![[thin space (1/6-em)]](https://www.rsc.org/images/entities/char_2009.gif) δ peak.35,40
δ peak.35,40
Mechanical property analysis
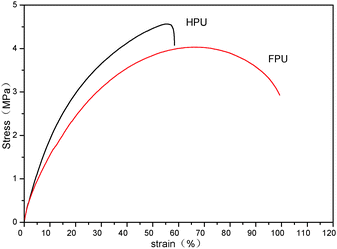
The changed degree of phase separation or mixing can be also reflected from tensile properties, since the tensile strength is remarkably affected by the two-phase structure of polyurethanes. Fig. 8 shows the stress–strain curves of HPU and FPU. It can be found that a decreased ultimate tensile strength and modulus (the slope) but an increased elongation at break are observed after introducing the fluorinated side chain into the soft segment. The decrease in tensile strength should be due to the lower crystalline order, which is consistent with the results of DSC. And also, from the above DMA results, the increased tensile strengths in HPU can be understood to be due to the increased phase separation, and the decreased tensile strengths in FPU are due to the increased phase mixing.41
 |
| | Fig. 8 Strain–stress curves of HPU and FPU. | |
Thermal stability analysis
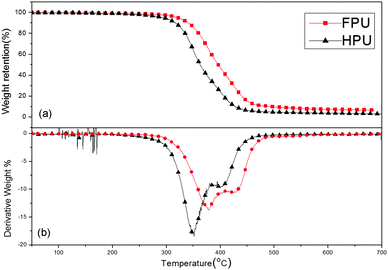
The thermal degradation of polyurethane is characterized by the decomposition of urethane bonds, the degradation of soft segments, and the evolution of the volatile components.42Fig. 9 displays the TGA and DTG curves of FPU and HPU. Obviously, the DTG curves exhibit two degradation stages. The first degradation stage appearing in the temperature range from 300 to 400 °C can be attributed to the decomposition of urethane bonds. The second degradation stage associated with the dissociation of the soft segments occurs from 400 to 500 °C.43,44 And also, the characteristic thermal decomposition temperature of HPU and FPUs is shown in Table 3. All the T10, T50, Thard![[thin space (1/6-em)]](https://www.rsc.org/images/entities/char_2009.gif) max and Tsoft
max and Tsoft![[thin space (1/6-em)]](https://www.rsc.org/images/entities/char_2009.gif) max values of FPU are higher than those of HPU and reach 340, 398, 378 and 427 °C, respectively. Meanwhile, the char yield of FPU (6.23%) is higher than that of HPU (2.43%). It can be concluded that FPU has a better thermal stability than HPU, although FPU and HPU have the same type of hard segment and chain extender.
max values of FPU are higher than those of HPU and reach 340, 398, 378 and 427 °C, respectively. Meanwhile, the char yield of FPU (6.23%) is higher than that of HPU (2.43%). It can be concluded that FPU has a better thermal stability than HPU, although FPU and HPU have the same type of hard segment and chain extender.
 |
| | Fig. 9 TGA analysis comparison between PU and FPU: (a) TGA and (b) DTG curves. | |
Table 3 Thermal stability of HPU and FPU
| Sample |
Weight remaineda (%) |
Temperatureb (°C) |
| 300 °C |
400 °C |
500 °C |
T
10
|
T
50
|
T
hard![[thin space (1/6-em)]](https://www.rsc.org/images/entities/char_2009.gif) max max
|
T
soft![[thin space (1/6-em)]](https://www.rsc.org/images/entities/char_2009.gif) max max
|
|
Weight losses of HPU and FPU at 300 °C, 400 °C, and 500 °C.
10% and 50% weight temperature, and the maximum degradation temperature.
|
| HPU |
94.7 |
24.9 |
4.7 |
317 |
362 |
350 |
400 |
| FPU |
97.9 |
48.3 |
9.7 |
340 |
398 |
378 |
427 |
Corrosion resistance of FPU and HPU
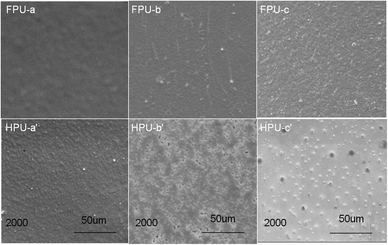
Corrosion resistances of FPU and HPU films were evaluated by immersing samples in 40 wt% aqueous solution of NaOH and H2SO4 is shown to mimic the high corrosive environment. After immersion in 40 wt% aqueous solution of NaOH and H2SO4 at room temperature for 24 h, the surfaces of HPU and FPU were observed by SEM. The original surface of HPU film under a SEM shows grooves, whereas almost no grooves are observed on FPU films (Fig. 10 (FPU-a, HPU-a′)), suggesting that the introduction of F into HPU soft segments strengthens the interactions between soft and hard segments, thus reducing the degree of microphase separation. A comparison between HPU and FPU exposed to 40 wt% NaOH and H2SO4 is shown in Fig. 10 (FPU-b, c HPU-b′, c′); it can be seen that HPU shows signs of deep, aggressive corrosion after immersion in 40 wt% NaOH and H2SO4, but FPU is devoid of significant surface corrosion. These analyses confirm that the introduction of fluorine enhances corrosion resistance of polyurethane film.
 |
| | Fig. 10 SEM for HPU and FPU corroded by immersion in 40 wt% NaOH and H2SO4 for 24 h at room temperature: (FPU-a), original FPU sample; (HPU-a′) original HPU sample; (FPU-b) and (HPU-b′) FPUs and HPU corroded in 40 wt% NaOH for 24 h, respectively; (FPU-c) and (HPU-c′) FPUs and HPU corroded in 40 wt% H2SO4 for 24 h, respectively. | |
Surface properties of FPU and HPU
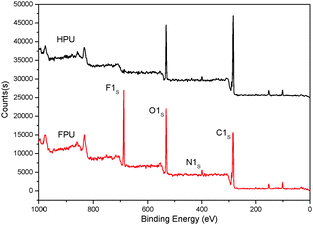
The surface properties of FPU and HPU were studied by XPS and contact angles. To study the surface compositions and the structure of HPU and FPU, the XPS analysis has been carried out. The XPS spectra of HPU and FPU are shown in Fig. 11. Compared with HPU, the photoionization peaks of carbon, oxygen, nitrogen and fluorine were observed in the FPU survey spectra. The bulk fluorine molar percent and surface fluorine molar percent are listed in Table 4. It can be found that the surface fluorine contents were higher than the bulk fluorine, due to the migration and enrichment of the fluorinated group. In addition, the results of contact angles and surface energy of HPU and FPU with water drops listed in Table 4 showed that FPU had a significantly higher contact angle and lower surface energy than HPU. This clearly indicates that the FPU exhibits hydrophobic and unique low surface energy as a result of introducing the fluorinated groups into the soft segment, and also the surface tension was decreased. The variance of contact angles of FPU and HPU with water drops can be clearly seen from Fig. 12.
 |
| | Fig. 11 The XPS survey spectra of HPU and FPU. | |
Table 4 Contact angle and surface energy of HPU and FPU
| Sample |
F% in bulk (mol%) |
F% in the surface (mol%) |
Contact angle (°) |
Surface energy (mN m−1) |
| HPU |
0 |
0 |
78.3 |
36.18 |
| FPU |
12.18 |
14.48 |
104.1 |
21.02 |
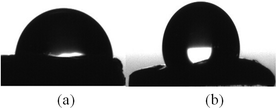 |
| | Fig. 12 Shape of the water drop on HPU (a) and FPU (b). | |
The analysis of the curing kinetics of HPU and FPU
The curing reaction of HPU and FPU was studied through solidification point measurements at various temperatures, as shown in Fig. 13. The crossover points of G′ and G′′ are defined as the solidification point (ts).45,46ts of FPU and HPU is the temperature at which FPU and HPU have no fluid properties. It can be seen that the ts decreases with the rise of temperature, and it might be concluded that the increase of temperature speeds up the reaction rate, leading to a faster consumption of NCO. A comparison between the ts of HPU and FPU at the same temperature is listed in Table 5. It can be seen that the reaction process is directly related to the initial monomer structure. When using fluorinated polyether as a soft segment, the ts value is slightly shorter. These phenomena are concerned in the reactivity of the hydroxyl in polyether. The higher electronegativity of fluorine in FPO strongly influences the charge distribution of the hydroxyl, and correspondingly, increases the reactivity of the hydroxyl, leading to the increase of the rate of curing reaction and reduction in the ts apparently. The reaction mechanism of urethane formation is as follows:
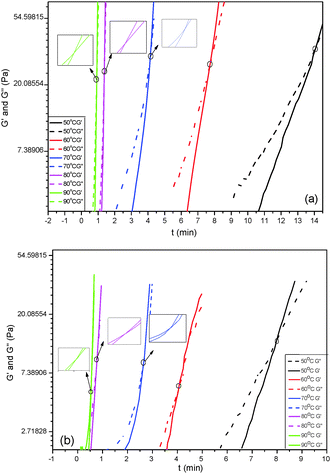 |
| | Fig. 13 Solidification point measurement of HPU (a) and FPU (b). | |
Absorbance FTIR spectra were registered to measure the conversion of NCO at ts. The ratio between the absorbances at 2270 cm−1 and the reference (constant) band at 1530 cm−1 was considered in order to evaluate the conversion of NCO content at ts. Because the absorbance at 1530 cm−1 was the stretching vibrations of the benzene ring, it did not overlap with other peaks and thus provided a direct means of monitoring the NCO concentration. The conversion of the NCO at ts obtained from the FTIR spectra (aIR) was calculated according to the following equation:47
where
INCO.O and
IR.O are the initial peak intensities of the NCO and reference bands, respectively, and
INCO.G and
IR.G are the peak intensities of the same bands at
ts. We experimented at least six times and took the average. The results are listed in
Table 5. It can be seen that the conversions of HPU and FPU at
ts are almost constant. The average value of the FPU conversion at the
ts is 48.46%. The value of FPU is slightly higher than the HPU value of 36.02%, and the difference is due to the higher rate of curing reaction of FPU.
Table 5 The ts and conversion at ts of FPU and HPU
| Temperature (°C) |
HPU |
FPU |
|
t
s (min) |
α
t
s
(%) |
t
s (min) |
α
t
s
(%) |
| 50 |
14.07 |
35.8 |
8.08 |
47.9 |
| 60 |
7.76 |
36.9 |
4.05 |
48.1 |
| 70 |
4.14 |
34.8 |
2.46 |
48.7 |
| 80 |
1.35 |
36.9 |
0.77 |
49.0 |
| 90 |
0.92 |
35.7 |
0.51 |
48.6 |
Under the kinetically controlled conditions, the reaction rate can be expressed by an Arrhenius rate expression as follows:48–51
| |  | (1) |
where
a is the conversion,
A is a constant factor,
E is the activation energy,
T is the curing temperature, and
f(
a) is the conversion-dependent function, independent of the curing temperature. By integrating from
a = 0 to
a =
ats, the equation becomes
| |  | (2) |
Since the terms in the last part of the right side of the equation are constant for a fixed conversion, the equation becomes
| |  | (3) |
Fig. 14 shows the Arrhenius plot of ln
![[thin space (1/6-em)]](https://www.rsc.org/images/entities/char_2009.gif) tsversus
tsversus 1/
T for HPU and FPU. The apparent activation energy
E can be calculated from the slope. The activation energy
E and the constant
C can be determined from the slope and the intercept of the linear relationship between ln
![[thin space (1/6-em)]](https://www.rsc.org/images/entities/char_2009.gif) t
t and 1/
T. The results are listed in
Table 6. It can be found that linear correlation coefficients were up to 0.988 and 0.955, which indicates the validity of this method. We found that the activation energy of HPU is 75.51 kJ mol
−1. And the activation energy of FPU is 70.24 kJ mol
−1, lower than the values of HPU, indicating that the curing reaction of FPU is much easier than that of HPU, which is in accordance with the analysis of the
ts.
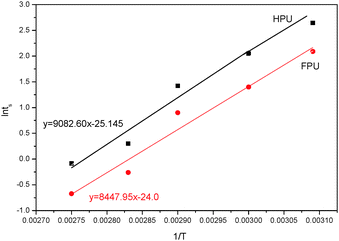 |
| | Fig. 14 Plots of ln![[thin space (1/6-em)]](https://www.rsc.org/images/entities/char_2009.gif) tsversus 1/T of HPU and FPU. tsversus 1/T of HPU and FPU. | |
Table 6 Activation energy of FPU and HPU
| Sample |
The linear correlation coefficient |
The slope of the lines |
Conversion C |
E
a (kJ mol−1) |
| FPU |
0.988 |
8447.95 |
−25.15 |
70.24 |
| HPU |
0.956 |
9082.60 |
−24.0 |
75.51 |
To study the influence of the curing process on the mobility of fluorinated groups to the surface of FPU, the XPS analysis of FPU was carried out. The XPS survey spectra are shown in Fig. 15. The XPS measurements showed the photoionization peaks of carbon, oxygen, nitrogen and fluorine in the FPU survey spectra. The peak intensity of F1s in the surface is higher at low temperature than that at high temperature. In addition, the peak intensity of N1s was weak due to the lower content of hydrophilic urethane groups in the surface layer. The surface element molar percents obtained by XPS are listed in Table 7. It can be seen that the amount of surface fluorine increases upon decreasing the curing temperature, indicating that the curing process has a great influence on the mobility of fluorinated groups. From the result of the analysis of ts, we knew that with increasing temperature, the ts decreases and the curing rate increases. Thus, there is not enough time for fluorinated groups to migrate to the surface of FPU, leading to the decrease of F content in the FPU surface. Thus it can be concluded that selecting the appropriate curing temperature is propitious for the movement of the fluorinated group and fluorine surface enrichment.
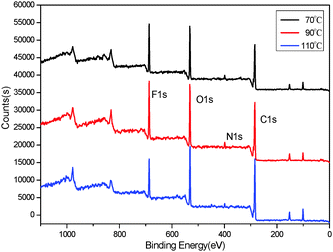 |
| | Fig. 15 XPS survey spectra of FPU. | |
Table 7 Element percentage on the S-FPU surface
| Temperature (°C) |
Surface element molar percent (mol%) |
| C |
O |
N |
F |
| 70 |
46.81 |
34.23 |
4.48 |
14.48 |
| 90 |
52.24 |
34.19 |
3.96 |
9.61 |
| 110 |
52.44 |
37.41 |
3.56 |
6.59 |
Conclusions
A novel fluorinated polyurethane (FPU) featuring fluorine-containing side chains was successfully synthesized by fluorinated polyether glycol with fluorine-containing side chains as soft segments, MDI as a hard segment and 1,4-butanediol (BDO) as a chain extender. The structure of the FPU was characterized by FTIR and NMR. SEM directly reveals that the extent of microphase separation reduces with the introduction of fluorinate into the soft segment. Moreover, the reduction of the microphase separation between the soft and hard segments decreases the crystallinity of FPU, increases the Tg of soft segments and decreases the Tg of the hard segment. Meanwhile the thermal stability, surface properties and corrosion resistance of FPU have been significantly enhanced. Furthermore, the results of the curing kinetics showed that the introduction of F into polyurethane increased the curing rate, and Ea of FPU (70.24 kJ mol−1) is lower than that of HPU (75.51 kJ mol−1). The XPS analytical results showed that there was an obvious effect of the curing process on the mobility of fluorinated groups to the surface of FPU.
Acknowledgements
This project was supported by the Natural Science Foundation of China (No. 3212310008), the innovation project of the Shanghai Municipal Education Commission (No. 15ZZ076) and the Hujiang Foundation of China (B14006).
Notes and references
- D. K. Chattopadhyay and K. V. S. N. Raju, Prog. Polym. Sci., 2007, 32, 352 CrossRef CAS.
- X. L. Li, Z. Fang, X. Li, S. G. Tang and K. Zhang, New J. Chem., 2014, 38, 3874 RSC.
- Z. Y. Lan, R. Daga, R. Whitehouse, S. McCarthy and D. Schmidt, Polymer, 2014, 55, 2635 CrossRef CAS.
- W. J. Lee and M. S. Lin, J. Appl. Polym. Sci., 2008, 109, 23 CrossRef CAS.
- M. Y. L. Chew, X. Zhou and Y. M. Tay, Polym. Test., 2001, 28, 87 Search PubMed.
- P. Krol, Prog. Mater. Sci., 2007, 52, 915 CrossRef CAS.
- C. B. McCloskey, C. M. Yip and J. P. Santerre, Macromolecules, 2002, 35, 924 CrossRef CAS.
- Z. Ge, X. Y. Zheng, J. B. Dai, W. H. Li and Y. J. Luo, Eur. Polym. J., 2009, 45, 530 CrossRef CAS.
- C. Wang, X. R. Li, B. Du and P. Z. Li, Colloid Polym. Sci., 2014, 292, 579 CAS.
- M. Zhang and S. L. Zhou, J. Univ. Shanghai Sci. Technol., 1998, 3, 272 Search PubMed.
- S. Turri, M. Levi and T. Trombetta, J. Appl. Polym. Sci., 2004, 93, 136 CrossRef CAS.
- S. Turri, M. Levi and T. P. Trombetta, Macromol. Symp., 2004, 218, 29 CAS.
- Y. S. Kim, J. S. Lee, Q. Ji and J. E. McGrath, Polymer, 2002, 43, 7161 CrossRef CAS.
- V. Durrieu and A. Gandini, Polym. Adv. Technol., 2005, 16, 840 CrossRef CAS.
- M. J. Zhu, F. L. Qing and W. D. Meng, J. Appl. Polym. Sci., 2008, 109, 1911 CrossRef CAS.
- C. H. Lim, H. S. Choi and S. T. Noh, J. Appl. Polym. Sci., 2002, 86, 3322 CrossRef CAS.
- Z. Ge, X. Y. Zhang and J. N. Dai, J. Macromol. Sci., Part A: Pure Appl.Chem., 2009, 46, 215 CrossRef CAS.
- C. Tonelli and G. J. Ajroldi, J. Appl. Polym. Sci., 2003, 87, 2279 CrossRef CAS.
- S. C. Yoon and B. D. Ratner, Macromolecules, 1988, 21, 2392 CrossRef CAS.
- S. C. Yoon and B. D. Ratner, Macromolecules, 1988, 21, 2401 CrossRef CAS.
- P. F. Liu, L. Ye, Y. G. Liu and F. D. Nie, Polym. Bull., 2011, 66, 503 CrossRef CAS.
- M. Castellano, C. Tonelli and A. Turturro, J. Mater. Sci., 2014, 49, 2519 CrossRef CAS.
- T. Liu and L. Ye, J. Fluorine Chem., 2010, 131, 36 CrossRef CAS.
- R. P. Jia, A. X. Zong, X. Y. He, J. Y. Xu and M. S. Huang, Fibers Polym., 2015, 16, 231 CrossRef CAS.
- G. Marchionni, G. Ajroldi, M. C. Righetti and G. Pezzin, Macromolecules, 1993, 27, 1751 CrossRef.
- A. Milani, J. Zanetti, C. Castiglioni, E. D. Dedda and S. Radice, Eur. Polym. J., 2012, 48, 391 CrossRef CAS.
- L. Mashlyakovskiy, V. Zaiviy, G. Simeone and C. Tonelli, J. Polym. Sci., Part A: Polym. Chem., 1999, 37, 557 CrossRef CAS.
- S. Turri, T. Trombetta and M. Levi, Macromol. Mater. Eng., 2000, 283, 144 CrossRef CAS.
- L. L. Li, Y. Li, X. Wang and Q. Z. Dong, Emerging Mater. Res., 2015, 4, 102 CrossRef CAS.
- L. L. Li, Y. Li, X. Wang, Y. C. Qing and J. J. Hu, J. Fluorine Chem., 2015, 175, 129 CrossRef CAS.
- R. M. Romano, J. Czarnowski and C. O. D. Vedova, Inorg. Chem., 2001, 40, 3039 CrossRef CAS PubMed.
- M. E. Ryan, J. L. C. Fonseca, S. Tasker and J. P. S. Badyal, J. Phys. Chem., 1995, 99, 7060 CrossRef CAS.
- Y. J. Xu, Z. Petrovic, S. Das and G. L. Wilkes, Polymer, 2008, 49, 4248 CrossRef CAS.
- L. F. Wang, Polymer, 2007, 48, 894 CrossRef CAS.
- W. W. Yu, M. Du, D. Z. Zhang, L. Yu and Q. Zheng, Macromolecules, 2013, 46, 7341 CrossRef CAS.
- A. M. Castagna, A. Pangon, T. Choi and G. P. Dillon, Macromolecules, 2012, 45, 8438 CrossRef CAS.
- C. Tonelli, G. Ajroldi, A. Turturro and A. Marigo, Polymer, 2001, 42, 5589 CrossRef CAS.
- H. Tan, J. H. Li and R. G. Du, Polymer, 2005, 46, 7230 CrossRef CAS.
- Y. J. Xu, Z. Petrovic, S. Das and G. L. Wilkes, Polymer, 2008, 49, 4248 CrossRef CAS.
- C. B. Wang and S. L. Cooper, Macromolecules, 1983, 16, 775 CrossRef CAS.
- P. F. Liu, L. Ye, Y. G. Liu and F. D. Nie, Polym. Bull., 2011, 66, 503 CrossRef CAS.
- Y. J. Xu, Z. Petrovic and S. Das, Polymer, 2008, 49, 4248 CrossRef CAS.
- M. G. Lu, J. Y. Lee, M. J. Shim and S. W. Kim, J. Appl. Polym. Sci., 2002, 85, 2552 CrossRef CAS.
- H. Q. Fu, C. B. Yan, W. Zhou and H. Huang, Compos. Sci. Technol., 2013, 85, 65 CrossRef CAS.
- X. Weibing, H. Pingsheng and C. Dazhu, Eur. Polym. J., 2003, 39, 617 CrossRef.
- C. Y. M. Tung and P. J. Dynes, J. Appl. Polym. Sci., 1982, 27, 569–574 CrossRef CAS.
- S. Turri, T. Trombetta and M. Levi, Macromol. Mater. Eng., 2000, 283, 144 CrossRef CAS.
- D. Olmos, A. Loayza and J. González-Bentito, J. Appl. Polym. Sci., 2010, 117, 2695 CAS.
- R. Rodriguez and B. Perez, J. Adhes., 2014, 90, 848 CrossRef CAS.
- L. Núñez, J. Taboada, F. Fraga and M. R. Núñez, J. Appl. Polym. Sci., 1997, 66, 1377 CrossRef.
- S. Cho, E. P. Douglas and J. Y. Lee, Polym. Eng. Sci., 2006, 46, 623 CAS.
|
| This journal is © The Royal Society of Chemistry and the Centre National de la Recherche Scientifique 2016 |
Click here to see how this site uses Cookies. View our privacy policy here. 
![[thin space (1/6-em)]](https://www.rsc.org/images/entities/char_2009.gif) soft (°C)
soft (°C)![[thin space (1/6-em)]](https://www.rsc.org/images/entities/char_2009.gif) soft (°C)
soft (°C)![[thin space (1/6-em)]](https://www.rsc.org/images/entities/char_2009.gif) hard (°C)
hard (°C)
![[thin space (1/6-em)]](https://www.rsc.org/images/entities/char_2009.gif) δ vs. temperature.
δ vs. temperature.![[thin space (1/6-em)]](https://www.rsc.org/images/entities/char_2009.gif) δ peak.35,40
δ peak.35,40![[thin space (1/6-em)]](https://www.rsc.org/images/entities/char_2009.gif) max and Tsoft
max and Tsoft![[thin space (1/6-em)]](https://www.rsc.org/images/entities/char_2009.gif) max values of FPU are higher than those of HPU and reach 340, 398, 378 and 427 °C, respectively. Meanwhile, the char yield of FPU (6.23%) is higher than that of HPU (2.43%). It can be concluded that FPU has a better thermal stability than HPU, although FPU and HPU have the same type of hard segment and chain extender.
max values of FPU are higher than those of HPU and reach 340, 398, 378 and 427 °C, respectively. Meanwhile, the char yield of FPU (6.23%) is higher than that of HPU (2.43%). It can be concluded that FPU has a better thermal stability than HPU, although FPU and HPU have the same type of hard segment and chain extender.
![[thin space (1/6-em)]](https://www.rsc.org/images/entities/char_2009.gif) max
max
![[thin space (1/6-em)]](https://www.rsc.org/images/entities/char_2009.gif) max
max


![[thin space (1/6-em)]](https://www.rsc.org/images/entities/char_2009.gif) tsversus 1/T for HPU and FPU. The apparent activation energy E can be calculated from the slope. The activation energy E and the constant C can be determined from the slope and the intercept of the linear relationship between ln
tsversus 1/T for HPU and FPU. The apparent activation energy E can be calculated from the slope. The activation energy E and the constant C can be determined from the slope and the intercept of the linear relationship between ln![[thin space (1/6-em)]](https://www.rsc.org/images/entities/char_2009.gif) t and 1/T. The results are listed in Table 6. It can be found that linear correlation coefficients were up to 0.988 and 0.955, which indicates the validity of this method. We found that the activation energy of HPU is 75.51 kJ mol−1. And the activation energy of FPU is 70.24 kJ mol−1, lower than the values of HPU, indicating that the curing reaction of FPU is much easier than that of HPU, which is in accordance with the analysis of the ts.
t and 1/T. The results are listed in Table 6. It can be found that linear correlation coefficients were up to 0.988 and 0.955, which indicates the validity of this method. We found that the activation energy of HPU is 75.51 kJ mol−1. And the activation energy of FPU is 70.24 kJ mol−1, lower than the values of HPU, indicating that the curing reaction of FPU is much easier than that of HPU, which is in accordance with the analysis of the ts.


