New insights into the complex regulation of the glycolytic pathway in Lactococcus lactis. II. Inference of the precisely timed control system regulating glycolysis
Sepideh
Dolatshahi
,
Luis L.
Fonseca
and
Eberhard O.
Voit
*
Department of Biomedical Engineering, Georgia Institute of Technology, Atlanta, GA 30332, USA. E-mail: sepideh@gatech.edu; llfonseca@gatech.edu; eberhard.voit@bme.gatech.edu
First published on 6th November 2015
Abstract
The dairy bacterium Lactococcus lactis has to master a complicated task. It must control its essentially linear glycolytic pathway in such a fashion that, when the substrate, glucose, runs out, it retains enough phosphoenolpyruvate and fructose-1,6-bisphosphate to be able to restart glycolysis as soon as new glucose becomes available. Although glycolysis is arguably the best-studied metabolic pathway, its details in L. lactis are still unclear, and it is, in particular, not understood how the bacterium manages the stop-and-start task. The primary purpose of this paper and its companion is a clarification of some of the details of the governing regulatory strategies with which L. lactis manages to retain the necessary metabolites for the restart of glycolysis after periods of starvation. The paper furthermore discusses how the bacterium changes these strategies when it is subjected to aerobic rather than anaerobic conditions.
1 Introduction
The companion paper1 described our efforts to create a fully kinetic, dynamic model, which was partially validated and constitutes a crucial prerequisite for the analysis in this paper. More generally, the analysis presented here exemplifies how computational modeling can add genuine value to wet lab experimentation by rendering it possible to convert data, which provide snapshots of reality, into dynamic storylines that explain strategies that organisms employ to survive.The pathway structure of the glycolytic pathway in L. lactis1 is depicted in Fig. 1 for convenience. While an earlier model had addressed the behavior of the organism under aerobic conditions,2 the companion paper1 models the glycolytic pathway under its preferred anaerobic conditions. This difference in conditions is of great importance, because no oxygen is available in the latter situation for the NADH-oxidase (NOX) reaction to proceed. As a consequence, the concentrations of NAD+ and NADH change dynamically, as they are exclusively driven by the glyceraldehyde phosphate dehydrogenase (GAPDH) and lactate dehydrogenase (LDH) steps of the glycolytic pathway. This restriction renders the NAD+ and NADH concentrations pivotal for the timely shut-down of the pathway, as we will discuss later.
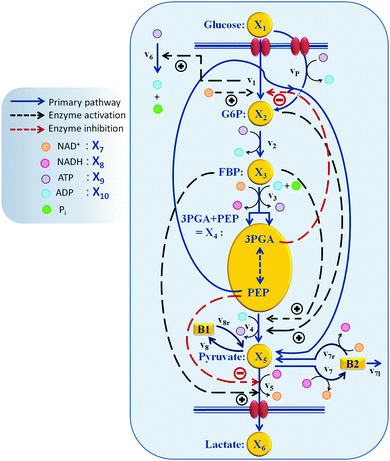 | ||
| Fig. 1 Model structure of the glycolytic pathway in L. lactis.1 Regulation of PTS flux by the redox state of the system (NAD+) and/or by 3PGA, as well as indirect regulation of the ATP dynamics by the availability of glucose (by v1) are among the new regulatory effects suggested as a result of the analysis in this paper. Other key regulations and their role in the timely control of the glycolytic pathway are confirmed and described. | ||
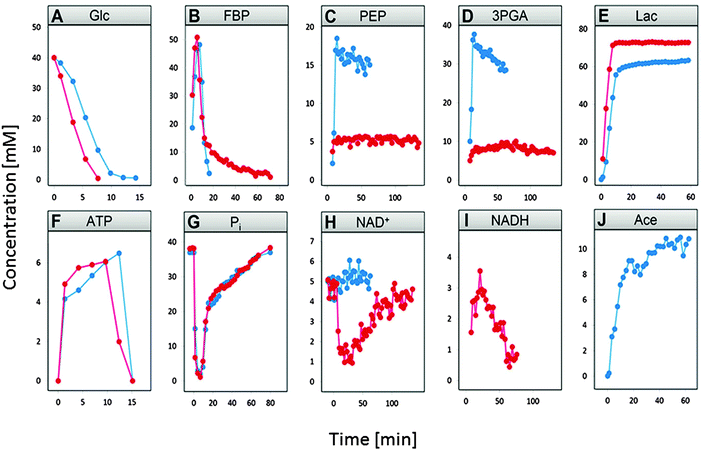
Although we focus primarily on anaerobic operation, it is beneficial to compare the time courses under the two conditions. Data for this purpose had been acquired after giving 40 mM of glucose to starving L. lactis cells at time zero.3
Fig. 2 compares the time dependent concentration profiles of glucose, FBP, PEP, 3PGA, end products lactate and acetate, as well as NAD+ and NADH, inorganic phosphate (Pi), and ATP under the two conditions. The comparison immediately reveals some obvious and some subtle differences in the responses with which L. lactis operates under the two experimental conditions.
Glucose is depleted faster under anaerobic conditions (panel A) and FBP becomes entirely depleted under aerobic condition, while it retains a residual concentration under anaerobic conditions (panel B). PEP and 3PGA are in both cases closely correlated due to a fast equilibrium between them. Nonetheless, they exhibit concentrations of much lower magnitudes in the anaerobic experiment (panels C and D). Lactate accumulates to somewhat lower amounts under aerobic conditions, due to channeling of some pyruvate toward acetate (panels E and F). Finally, one observes a sharp drop in NAD+ under anaerobic conditions when glucose is depleted (panel I), which does not occur under aerobic conditions.
A prime goal of this paper is to explain why these differences are necessary. To this end, the analysis uses the computational model in ref. 1 to decipher the complex coordination of regulatory signals of the pathway under aerobic and anaerobic conditions. The results of this analysis will also explain the complex chains of events required to stop and restart glycolysis, including the features of a suitable ready-to-respond state. Interestingly, the strategies are distinct under aerobic vs. anaerobic conditions.
2 Materials and methods
In addition to the three datasets for anaerobic conditions, as described in ref. 1, the datasets in Table 1 are used for the analyses in this paper.| Experiment | Condition | Technique | Metabolites Measured | Time Interval |
|---|---|---|---|---|
| (1) 20 mM [6-13C] glucose | Aerobic pH = 6.5 | 13C-NMR | glc, G6P, FBP, 3PGA, PEP, lac, ace | 30 s |
| (2) 40 mM [1-13C] glucose and [5-13C] nicotinate | Aerobic pH = 6.5 |
13C-NMR
31P-NMR |
glc, FBP, 3PGA, PEP, lac, ace, NAD+
ATP, Pi |
2.2 min
2.75 min |
Dynamic flux estimation (DFE)4 as well as other ad hoc methods of analysis including mathematical comparisons are used to infer biologically meaningful results and explain how proper operation of the pathway arises from the complex regulatory program in the cell.
3 Results
3.1. Regulation of glycolysis
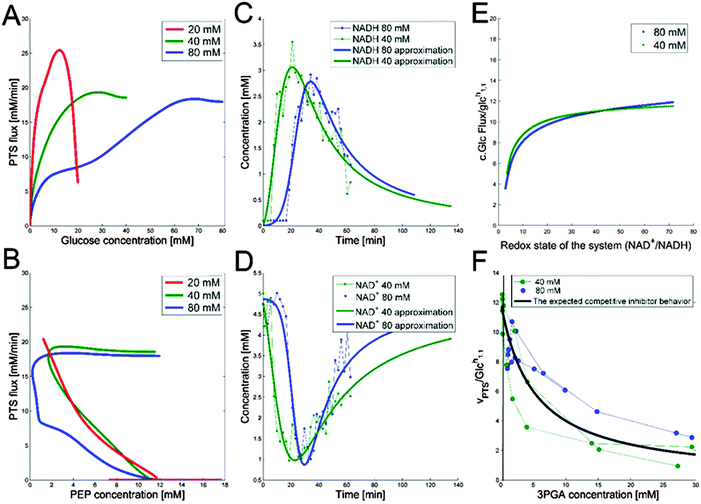
The companion paper1 demonstrated that a single dynamic model is capable of simultaneously capturing the dynamics of the glycolytic pathway under three glucose input conditions. This model contains several inhibitory and activating mechanisms, some of which had not been described in L. lactis. The goal here is to shed light on the specific roles of these regulatory signals. To achieve this goal, we use a variation of mathematically controlled comparisons5,6 between models with and without these regulatory signals, which will help us identify what the contributions of these signals are.As mentioned in the companion paper, the rate of glucose import rapidly increases during the first two or three minutes, and we captured this observation with an adjustment function for the first two minutes.1 Beyond this brief initial phase, the true shape of the glucose uptake profile is difficult to intuit from the glucose concentration curves, but it becomes apparent when one studies the PTS flux (PTSf), which can be computed directly through numerical differentiation of the experimental uptake profiles after some unbiased smoothing with third-order splines. The rationale now is the following. If one makes the simple supposition that PTSf is a function in the strict mathematical sense, i.e., that it has a unique value for each argument, it is easy to show that the sole dependence of PTSf on glucose and PEP is insufficient.
Beginning with PEP, one may reasonably assume that PTSf is independent of glucose, at least during the first several minutes of the experiments, because glucose is available in such high concentrations that the process is saturated with respect to glucose. If so, one may plot PTSf against the measured or inferred concentration of PEP.
One should note here that in vivo NMR does not detect the concentration of PEP at the beginning of the experiment, because PEP is initially unlabeled. However, Neves7 measured phosphorylated glycolytic metabolites in L. lactis MG5267 with in vivo NMR experiments, as well as using perchloric acid extracts obtained during the metabolism of glucose under anaerobic conditions. These measurements complement the NMR experiments used here and give a more comprehensive picture of the dynamics of PEP under anaerobic conditions in this organism. Specifically, it was observed that the concentration of PEP at the beginning of the experiment was essentially equal to its final concentration. Within one minute into the experiment, the PEP concentration dropped to 1.2 mM and remained low until glucose started to get depleted, upon which PEP started to accumulate. L. lactis MG1363, which we investigate in this paper, shows a very similar dynamics to MG5267. In the absence of similar complementary initial PEP data for L. lactis MG1363, the measured PEP dynamics7 was used to infer missing data points for PEP in our experiments. This conjecture regarding missing data points is further supported by a tandem experiment, where glucose was given twice.8
Thus, Fig. 3B was plotted using measured and inferred PEP data. The plots for the three experiments demonstrate that PTSf cannot solely be a function of PEP, because the trajectories from the three experiments would have to overlap, but they do not. Even if we attribute this discrepancy to noise in the data and to possible inference errors, PTSf depends on PEP in such a fashion that a decrease in PEP results in a higher flux, which is not to be expected from a substrate.
With respect to glucose, we use kinetic parameters measured in vitro9 and plot PTSf after excluding the effect of glucose, which can be inferred from these parameters. This plot shows a decreasing glucose uptake with increasing PEP. A possible explanation is that the dependence on PEP is rather weak and that simply a minimal amount of PEP is required to keep the PTS flux running. Expressed within the conceptual framework of Michaelis–Menten kinetics, PTSf appears to have a very low Michaelis constant (Km) for PEP. If so, PTSf is essentially independent of PEP and depends almost exclusively on glucose. However, plots of PTSf against glucose for the three datasets (Fig. 3A) demonstrate that PTSf cannot be a function of glucose alone because, again, the plots would have to overlap, but do not. One should note that these inference were made directly from the data through dynamic flux estimation and without the assumption of a particular model structure. The next sections describe potential means of resolving the issue.
3.1.1.1 NAD+ may regulate the PTS flux. The results described above lead to the conclusion that PTSf depends on at least one additional variable. If we assume that PTSf depends on glucose in the form of a power-law function, it is beneficial to plot
 against each metabolite in the system, one at a time, and thus to determine if any of them can lead to overlapping trajectories. If so, it would make PTSf a true mathematical function of glucose and the candidate metabolite. We executed this analysis for different representative values of h1,1.
The scanning process pointed to only two variables in the system, namely NAD+—or alternatively the redox state of the system 
![[thin space (1/6-em)]](https://www.rsc.org/images/entities/char_2009.gif) —and 3PGA. To analyze the possibility of NAD+ or
—and 3PGA. To analyze the possibility of NAD+ or  as modulators, we smoothed the NADH trajectories, using a so-called GS-function10 which offered good representations of the available concentrations in Experiments 2 and 3, for which data are available (Fig. 3C). This rather unbiased “black-box” smoothing also naturally replaced concentration values below the detection limit with non-zero values. Under the given experimental conditions, the sum of NAD+ and NADH is essentially constant, so that NAD+ is easily inferred from NADH (Fig. 3D). We then plotted
  against
  , using the scaling factor c = 2.24 and the kinetic order h1,1 = 0.14 for glucose. h1,1 is the estimated kinetic order for the model and c is an adjustment of the rate constant that resulted from optimizing the difference between the two curves with a standard gradient method. The results are depicted in Fig. 3E. They exhibit close to overlapping trajectories, which means that the representation of PTSf becomes a true mathematical function of glucose and
  .
.
From a biological point of view, an effect of NAD+ or  on PTSf seems plausible, as the level of NAD+/NADH is directly linked to the redox state of the system. One must caution, however, that this conclusion is drawn directly from the data and without a specific mathematical model, and the potential regulatory effect is therefore a pure prediction that will require experimental validation. Nonetheless, according to the literature,11,12 NAD+ has been observed to activate the PTS system in E. coli by modulating the activity of the ATP-dependent Enzyme I-Kinase (EI-K), which reversibly phosphorylates Enzyme I at its active site histidine; thus, ATP and EI-K can replace PEP. Whether the same mechanism is active in L. lactis is not known, but the values of
  in Datasets 2 and 3 start ramping down while FBP is being depleted, and the proposed NAD+ regulation is at least numerically a valid candidate for eliminating the discrepancy in PTSf between the experimental data and the model. Since the argument is purely mathematical, any variable outside the system that is strongly correlated with NAD+ could serve as a modulator as well. Whatever the case may be, the dynamics of PTSf involves more than glucose and PEP and needs to be further investigated with experimental means.
3.1.1.2 Possible inhibition by 3PGA. The detailed analysis of the dynamics of FBP in ref. 1 led to the conclusion that glucose uptake follows a saturating function, such as a Michaelis–Menten function, with very low Km. However, such a setting is not compatible with the observed glucose uptake profiles. Specifically, we can compare the glucose dynamics in the three datasets with the glucose dynamics of an uptake function with low Km (Fig. 4A). For this comparison we select Km = 0.013 mM, as reported in ref. 9, and a Vmax that is set to the maximum flux among the three experiments and all time points; the Vmax value does not actually affect the shape of the dynamic profile. The comparison allows us to infer the dynamic trend of the posited regulator for the three experiments (Fig. 4B), which is obtained by dividing the observed dynamics by the alleged model dynamics. The candidate identified as exhibiting the correct trend is 3PGA (Fig. 3F). As in the case of
 , this analysis does not prove that 3PGA affects glucose uptake, but biology supports the conclusion, because the 3PGA molecule is structurally very similar to PEP. Moreover, 3PGA has been observed to be a potent competitive inhibitor for PTSf in E. coli and Salmonella typhimurium strains.13
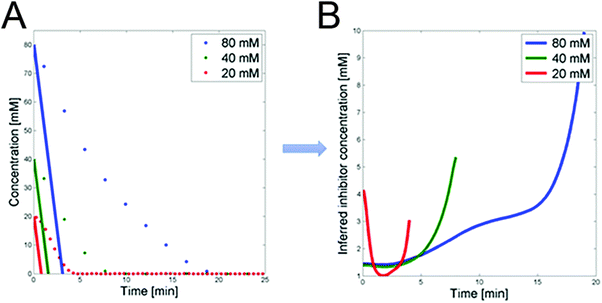 | ||
| Fig. 4 (A) Glucose concentrations for the three experiments vs. time (dots). Superimposed are glucose trends simulated with a Michaelis–Menten function with Km from the literature9 and Vmax set to the maximum flux among the three experiments and time points. (B) DFE analysis of the trends in panel A permits the prediction of the time trend of a postulated inhibitor. | ||
3.1.1.3 PTS flux and 3PGA dynamics under aerobic conditions. The mathematical analysis of the previous section suggested that 3PGA could be an inhibitor of PTSf. Specifically, it showed that the PTS flux, divided by the direct effect of glucose, which in turn was derived from the Michaelis–Menten functions with Km values from the literature,9 is loosely U-shaped over time (Fig. 4B). This shape is similar to the observed dynamics of 3PGA. Quasi as a validation of this inference, this section investigates this inhibition under aerobic conditions, using a dataset that had not been used before. After all, one would expect that such inhibitory capability would not likely depend on the environmental conditions.
To demonstrate the feasibility of 3PGA as an inhibitor, we use duplicate experimental data for 20 mM glucose input under aerobic conditions. Superimposing the plot of  vs. 3PGA concentration and the plot of a typical inhibitor function, namely “constant1/(1 + constant2·[3PGA])” vs. 3PGA concentration, demonstrates that the two have similar shapes, which indicates that 3PGA could well be an inhibitor (see Fig. 3F).
Support for the role of 3PGA as a potential inhibitor is indirectly provided by data in Table 2, which were excerpted from Table 1 of ref. 14. The data in the table imply a negative correlation between glucose consumption rate and the concentration of 3PGA at the end of the experiment, which is assumed to be similar to its concentration at time zero where PTSf is nonzero. This observation applies to different strains of L. lactis, including wild type MG1363 grown under anaerobic and aerobic conditions, as well as strains where NADH oxidase is knocked out (NOX−) or over-expressed (NOX+). The assumption of 3PGA as an inhibitor of PTSf also appears to be reasonable judging by additional data that were obtained in vitro in perchloric acid extracts during the metabolism of glucose under anaerobic conditions.7 The data were obtained from L. lactis MG5267 and cover only an initial glucose concentration of 20 mM. Similar concentrations for both 3PGA and PEP at the beginning and end of the experiment were reported. Of course, the correlation does not prove causation, but these data are at the very least consistent with our hypothesis.
| Strain | Condition | Total NADH oxidase activity (μmol min−1 mg of protein−1) | Glucose consumption rate (μmol min−1 mg of protein−1) | Concentration (mM) of 3PGA |
|---|---|---|---|---|
| MG1363 | Anaerobic | 0.07 ± 0.01 | 0.41 ± 0.01 | 8 ± 2 |
| Aerobic | 0.22 ± 0.01 | 0.25 ± 0.03 | 33 ± 3 | |
| NOX+ | Anaerobic | 16.5 ± 0.23 | 0.35 ± 0.02 | 10 ± 2 |
| Aerobic | 17.0 ± 0.50 | 0.21 ± 0.02 | 36 ± 3 | |
| NOX− | Anaerobic | 0.03 ± 0.00 | 0.37 ± 0.03 | 3 ± 0.4 |
| Aerobic | 0.03 ± 0.00 | 0.23 ± 0.04 | 25 ± 3 |
The trends in both NADH and 3PGA show strong resemblance to the predicted trend of a putative inhibitor. This becomes evident when the dynamics of the hypothesized activator and inhibitor are overlaid with the actual trends in 3PGA (Fig. 5A) and NADH (Fig. 5B). As these panels indicate, there is good consistency between the hypothesized and postulated inhibitors, and both modulators were included in the model.
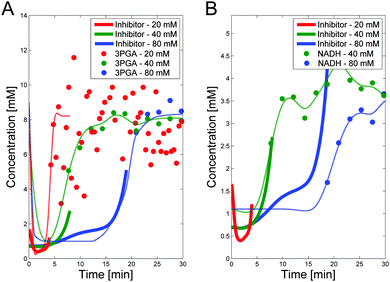 | ||
| Fig. 5 Panel A depicts the postulated inhibitor concentration trends (heavy lines; see Fig. 4) vs. time for the three experiments, superimposed on measurements of 3PGA, scaled by 1.5 to emphasize the similarity. The dashed lines show the smoothed trends for 3PGA using the fact that 3PGA is non-zero in the beginning. Panel B shows the same putative trend in inhibitor but superimposed on NADH data scaled by 5. NADH data are only available for Experiments 2 and 3. Note that PTSf is zero once glucose is depleted, so that the inhibitor trend can only be inferred for the time points where glucose concentrations are nonzero. For these important time periods, both candidates seem feasible. | ||
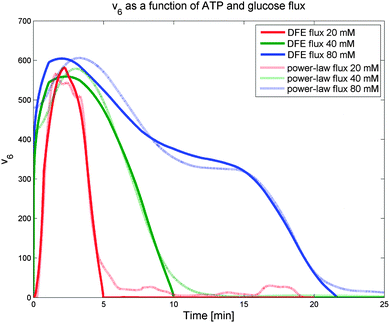
Interestingly, the results indicate that no monotonic function that depends exclusively on ATP as its substrate, including power-law and Michaelis–Menten functions, can provide a good fit to the observed dynamics. Expressed differently, the analysis strongly suggests that another variable modulates this flux and reveals the trend of this unknown modulator over time. The only variable in the model that has a time profile consistent with this trend is glucose. Of course, glucose is located outside the cell, and thus unavailable to regulate intracellular processes directly. However, it is likely that cells have glucose sensors that could allow the modulation of ATP usage. A candidate for this role is the component EIIA-P of the PTS. Since the EIIA-P concentration is dependent on the flux of glucose uptake and not on the external glucose, we included v1 as the regulator for ATP usage (v6). Fig. 6 shows how the DFE-inferred fluxes (solid lines) are fitted as a power-law function of ATP and the transport rate of glucose (dashed lines). This data-driven hypothesis, which was obtained independently from the model, is very interesting in its biological implication, as it suggests that some or all of the ATP consuming processes in the cell are regulated by glucose availability. If so, the cells appear to be able to selectively shut off some of these ATP utilizing processes when glucose is scarce. To the best of our knowledge, this type of regulation has not yet been reported and seems worthy of further experimental investigation.
In an earlier analysis of the pathway under aerobic conditions, it was decided to use FBP as the sole, representative activator, because measurements of G6P were scarce, and the activation by FBP was sufficient.20 Indeed, under aerobic conditions and a relatively low glucose supply (20 mM), FBP vanishes completely, together with G6P, and is therefore able to shut down PK effectively. In anaerobic experiments, by contrast, FBP is never completely exhausted (Fig. 2B), but retains a residual concentration, even long after glucose is depleted. Thus, one must ask whether FBP alone could be able to shut off pyruvate production.
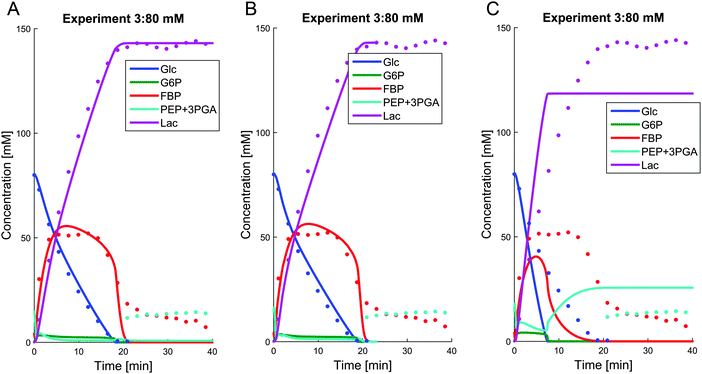
We tested this question with simulations of a pathway without regulation of PK by G6P and FBP. Fig. 7A shows the simulation results for the representative case of Experiment 3 with 80 mM of external glucose. When the PK activation by either G6P or both, G6P and FBP, is removed, PEP never accumulates; in fact, it becomes fully depleted after glucose is exhausted. Correspondingly, the FBP concentration approaches zero shortly after glucose depletion, which is contradictory to the fact that FBP retains some residual concentration under anaerobic conditions This virtual experiment elucidates the role of the activation of PK, which will be revisited later as part of the bigger picture of the finely coordinated shut-down of fluxes after glucose depletion. Because most upper glycolytic intermediates are activators of PK,7 we used the corresponding variables, FBP and G6P, both as regulators in the model.
To elucidate the limiting role of NAD+ under anaerobic conditions, we performed a virtual experiment, where we provided the cells with 10 mM additional NAD+. The result of this simulation for the 80 mM experiment shows that FBP is entirely consumed (Fig. 7B).
3.3. Comparison of aerobic and anaerobic operation of glycolysis
The model described in the companion paper1 permits us to extract from the data detailed explanations of the roles of the observed subtle differences in the dynamic profiles of the metabolites and the functionality of the pathway under aerobic vs. anaerobic conditions. The most immediate difference affects the GAPDH reaction (step 4 in the two panels of Fig. 8). Under aerobic conditions, NAD+ recycling is not limiting the GAPDH reaction, because plenty of oxygen is available for NADH oxidase to produce sufficient quantities of NAD+. As a consequence, the NAD+ concentration remains more or less constant and certainly never decreases much. Therefore, v3 is always active under aerobic conditions as long as FBP is available, and the cell continues to consume FBP until it is entirely used up. This consumption, in turn, produces more PEP and 3PGA, thus explaining the difference in their concentrations (panels C and D of Fig. 2). In addition, the stronger accumulation of PEP and 3PGA under aerobic conditions might be due to slight differences in the timing of the pathway events, which is explicitly visible in the speed of glucose uptake.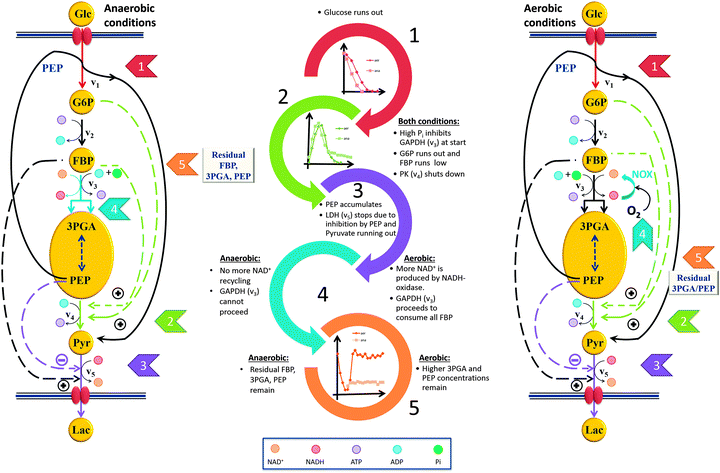 | ||
| Fig. 8 Cascades of events resulting in a well-coordinated system shut-down under anaerobic and aerobic conditions. The shut-down leads to different “ready-to-respond” states under the two conditions. The chain of events upon glucose depletion rationalizes why some residual FBP is left at the end of the experiment (see Fig. 2B), but only under anaerobic conditions. In both conditions, the cells retain some 3PGA and PEP when glucose runs out. Some fluxes, which are not directly pertinent to the shut-down process, are omitted from this figure. | ||
To confirm these conceptual explanations, we took the model for the anaerobic pathway and added two virtual NADH-oxidase-like reactions representing the two main H2O-forming and H2O2-forming NADH-oxidases which, however, do not require oxygen in our virtual experiment. Affinities for these reactions were taken from the literature,22 and the Vmax values were allowed to change to achieve metabolite concentrations close to the data under aerobic conditions. Of course, one should not expect that results from this chimeric model would be numerically consistent with measurements, since the cells had been grown under aerobic conditions and the enzyme activities are most likely different due to the likely altered gene expression in response to aeration. However, qualitative results could either confirm or refute the speculations above.
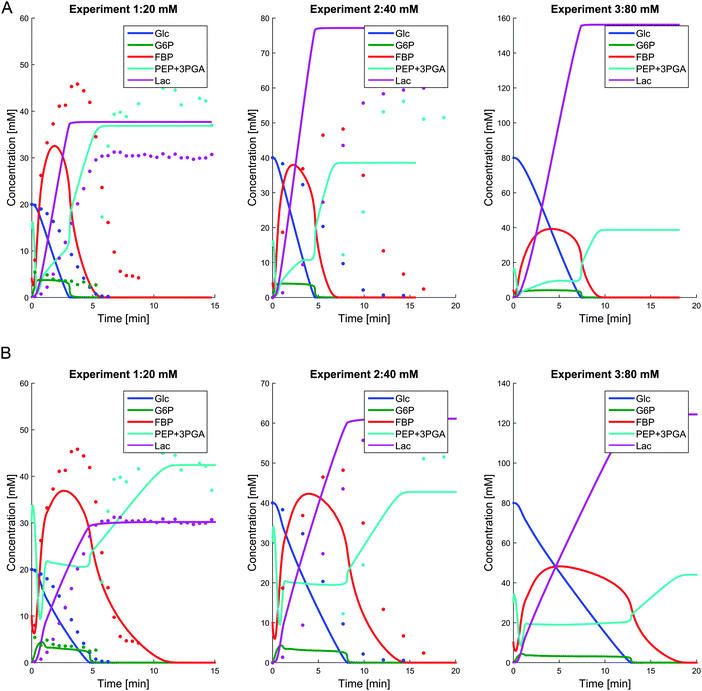
Fig. 9A depicts some results of a simulation where two NOX-like reactions were added, but all parameter values of the anaerobic model were retained. Fig. 9B shows the results after allowing the parameters to change locally in the vicinity of the parameters for the anaerobic conditions. The key differences between these results and the original results for the anaerobic model are: (1) the absence of residual FBP at the end of the experiment; and (2) the accumulation of higher amounts of PEP + 3PGA. Also, NAD+ remains more or less constant (not shown).
4 Discussion
High-throughput dynamic data contain very valuable information about the function and regulation of cellular systems in vivo. This is especially the case for time series of concentrations that can be generated with in vivo NMR techniques. Here, we analyzed such data in the context of intricate survival strategies involving the retention of intermediate pathway metabolites, with which L. lactis stops and restarts glycolysis when glucose substrate is about to run out or becomes available again.Although the accumulation of intermediate metabolites in linear pathways is generally considered disadvantageous, it is here obligatory for the cell to maintain a relatively high concentration of PEP, because only PEP allows the organism to restart glycolysis through the PTS as soon as new glucose becomes available after starvation.20 Furthermore, the accumulation of G6P and its activation of PK use PEP, which indirectly leads to the production of ATP, which in turn is needed for the conversion of G6P into FBP and prevents the premature stopping of glycolysis due to lack of ATP. The activation of PK furthermore leads to the fast production of pyruvate and then lactate, which is advantageous for the organism, as it sours the medium and prevents or at least impedes the growth of competing species.
For the first time, a single model explains several observations that were made over the past several decades. In particular, it captures the unusual and puzzling FBP accumulation dynamics across different glucose inputs1 and offers an explanation for differences in the dynamic behavior of the pathway under aerobic vs. anaerobic conditions, which had been noted before but were not always considered significant. These differences are related to the fact that the dynamics of NAD+ and NADH under anaerobic conditions is only affected by the activity of the glycolytic pathway and the lactate dehydrogenase step, which makes the control task more difficult than for aerobic conditions, where NADH is easily oxidized. The model also posits new, experimentally testable hypotheses regarding the regulation of critical steps in the pathway. Importantly, it reveals in detail the finely tuned timing of events that lead to an orderly shutdown of the pathway when glucose in the medium becomes depleted and to a metabolic resting state in which the cells are perfectly positioned to utilize new glucose as soon as it becomes available.
For this “ready-to-respond state” to be effective, the organism must assure that it has available an effective mechanism for replenishing NAD+, at least under anaerobic conditions. In wild type, this recycling is accomplished through the lactate dehydrogenase (LDH) reaction, which therefore plays a limiting role. This limitation, together with a reduced activation of PK during glucose depletion, leads to the following chain of events that ultimately stops glycolysis in a state where the organism is perfectly positioned to restart glycolysis immediately once glucose becomes available (Fig. 8).
Very shortly after glucose runs out, the G6P concentration decreases to zero. As a consequence, G6P and FBP no longer activate PK, which causes PEP to accumulate to a relatively high concentration. The persistently high concentration of PEP leads to strong inhibition of LDH. As a consequence of this inhibition, as well as the fact that pyruvate is running out, the production of NAD+ ceases, NAD+ depletes, the redox state is altered, and the GAPDH reaction (v3) can no longer proceed without the cofactor. The result is a residual amount of FBP, even after external glucose is exhausted, which is not observed under aerobic conditions. One notes that the retention of sufficient residual amounts of FBP and PEP at the end of the experiment requires well-coordinated regulation, because the v3 and PK fluxes must be shut down at just the right time.
As explained elsewhere,2 PEP is needed to provide the phosphate moiety for the phosphorylation of glucose. Also, since the experiment starts without ATP, as shown in Experiments 2 and 3, some initial amount of ATP is needed for the PFK reaction to go forward and thus to start glycolysis. Due to the initial influx through PTS, G6P and F6P start to accumulate, which leads to the activation of PK. This in turn provides the initial ATP needed for PFK to proceed. By retaining PEP, the cell is ready to take up glucose once it becomes available after starvation, both under aerobic and anaerobic conditions. However, specifically under anaerobic conditions, once glucose is depleted, some FBP is retained, due to a lack of NAD+ recycling by v5, as discussed earlier (Fig. 2B). Retaining some FBP under anaerobic conditions provides the cells with a residual amount of ATP through the phosphoglycerate kinase reaction, which could be used as a secondary mechanism to restart glycolysis. Indeed, this mechanism might explain why glucose uptake is faster under anaerobic conditions (Fig. 2A). Additionally, the lower 3PGA concentration at the beginning of the experiment, and the therefore decreased inhibition of PTSf, may contribute to the faster anaerobic metabolism of glucose.
Detailed model analysis revealed several differences in metabolic time trends between operation under aerobic and anaerobic conditions. Some of these differences are quite subtle but, surprisingly, emerged as crucial. For example, FBP is consumed more slowly under anaerobic conditions and retained at a residual concentration for a long time. This observation is not new, but was by and large ignored, as it was seen as coincidence or experimental noise.
A second set of observed differences between aerobic and anaerobic operation is a faster consumption of glucose and a faster accumulation of lactate in the latter case. Also, NAD+ dips down at about the same time when PEP and 3PGA peak, because NADH oxidase is not operational without oxygen, while it stays more or less constant under aerobic conditions. This effect is an important contributor to the control of glycolysis after starvation. In particular, the difference in NAD+ constitutes a limitation for the GAPDH reaction, which leads to the accumulation of FBP under anaerobic, but not under aerobic conditions, where FBP is quickly depleted when no more glucose is available. The result is a higher concentration of PEP and PGA.
The model provides a likely explanation for the slower glucose consumption under aerobic conditions. Namely, glucose uptake must depend on more factors than its two substrates, glucose and PEP. Detailed analysis identified 3PGA, as well as the state of the redox system, as viable candidates for regulating this step. At this point, the role of these components as inhibitors is purely speculative. Their inhibiting effect has been documented in other bacteria, but it is yet to be confirmed with laboratory experiments in L. lactis.
Taken together, the details of the dynamics of glycolysis in L. lactis portray an intriguing and finely tuned system of signals regulating the pathway. The structure of this control system emerged through a suitable representation in a mathematical model, based on time series data.
Acknowledgements
The authors are grateful to Dr Helena Santos and Dr Ana Rute Neves of the Instituto de Tecnologia Química e Biológica (ITQB) at the New University of Lisbon (Portugal) for allowing them to use the in vivo NMR data presented here. The NMR spectrometers are part of The National NMR Facility (RECI/BBB-BQB/0230/2012), supported by Fundação para a Ciência e a Tecnologia. This work was funded in part by the National Science Foundation (Projects MCB-0958172 and MCB-0946595; PI: EOV). The funding agency is not responsible for the content of this article.References
- S. Dolatshahi, L. L. Fonseca and E. O. Voit, Mol. BioSyst., 2015 10.1039/c5mb00331h.
- E. O. Voit, J. Almeida, S. Marino, R. Lall, G. Goel, A. R. Neves and H. Santos, Syst. Biol., 2006, 153, 286–298 CrossRef CAS.
- A. R. Neves, R. Ventura, N. Mansour, C. Shearman, M. J. Gasson, C. Maycock, A. Ramos and H. Santos, J. Biol. Chem., 2002, 277, 28088–28098 CrossRef CAS PubMed.
- G. Goel, I. C. Chou and E. O. Voit, Bioinformatics, 2008, 24, 2505–2511 CrossRef CAS PubMed.
- M. A. Savageau, Biomed. Biochim. Acta, 1985, 44, 875–880 CAS.
- R. Alves and M. A. Savageau, Bioinformatics, 2000, 16, 786–798 CrossRef CAS PubMed.
- A. R. Neves, PhD dissertation, Universidade Nova de Lisboa, 2001.
- A. R. Neves, A. Ramos, M. C. Nunes, M. Kleerebezem, J. Hugenholtz, W. M. de Vos, J. Almeida and H. Santos, Biotechnol. Bioeng., 1999, 64, 200–212 CrossRef CAS PubMed.
- R. Castro, A. R. Neves, L. L. Fonseca, W. A. Pool, J. Kok, O. P. Kuipers and H. Santos, Mol. Microbiol., 2009, 71, 795–806 CrossRef CAS PubMed.
- J. M. Muiño, E. O. Voit and A. Sorribas, Comput. Stat. Data Anal., 2006, 50, 2769–2798 CrossRef.
- H. K. Dannelly and S. Roseman, Proc. Natl. Acad. Sci. U. S. A., 1992, 89, 11274–11276 CrossRef CAS.
- H. K. Dannelly and S. Roseman, J. Biol. Chem., 1996, 271, 15285–15291 CrossRef CAS PubMed.
- M. H. Saier, Jr., M. R. Schmidt and P. Lin, J. Biol. Chem., 1980, 255, 8579–8584 Search PubMed.
- A. R. Neves, A. Ramos, H. Costa, S. van, II, J. Hugenholtz, M. Kleerebezem, W. de Vos and H. Santos, Appl. Environ. Microbiol., 2002, 68, 6332–6342 CrossRef CAS PubMed.
- L. B. Collins and T. D. Thomas, J. Bacteriol., 1974, 120, 52–58 CAS.
- V. L. Crow and G. G. Pritchard, Biochim. Biophys. Acta, 1976, 438, 90–101 CrossRef CAS.
- V. L. Crow and G. G. Pritchard, Biochim. Biophys. Acta, 1977, 481, 105–114 CrossRef CAS.
- V. L. Crow and G. G. Pritchard, in Methods Enzymol., ed. A. W. Willis, Academic Press, 1982, vol. 90, pp. 165–170 Search PubMed.
- T. D. Thomas, J. Bacteriol., 1976, 125, 1240–1242 CAS.
- E. O. Voit, A. R. Neves and H. Santos, Proc. Natl. Acad. Sci. U. S. A., 2006, 103, 9452–9457 CrossRef CAS PubMed.
- A. R. Neves, A. Ramos, C. Shearman, M. J. Gasson, J. S. Almeida and H. Santos, Eur. J. Biochem., 2000, 267, 3859–3868 CrossRef CAS PubMed.
- M. Higuchi, M. Shimada, Y. Yamamoto, T. Hayashi, T. Koga and Y. Kamio, J. Gen. Microbiol., 1993, 139, 2343–2351 CrossRef CAS PubMed.
| This journal is © The Royal Society of Chemistry 2016 |

