
Comparative proteomic profiling of Hodgkin lymphoma cell lines†
D.
Vergara
*ab,
P.
Simeone
c,
S.
De Matteis
d,
S.
Carloni
d,
P.
Lanuti
c,
M.
Marchisio
c,
S.
Miscia
c,
A.
Rizzello
ab,
R.
Napolitano
d,
C.
Agostinelli
e and
M.
Maffia
*ab
aDepartment of Biological and Environmental Sciences and Technologies, University of Salento, via Monteroni, 73100 Lecce, Italy. E-mail: danielevergara@libero.it; Tel: +39 0832 661915
bLaboratory of Clinical Proteomic, “Giovanni Paolo II” Hospital, ASL-Lecce, Italy. E-mail: michele.maffia@unisalento.it; Tel: +39 0832 298685
cDepartment of Medicine and Aging Science, School of Medicine and Health Science and Unit of Cytomorphology, Research Centre on Aging (Ce.S.I), University “G. d'Annunzio” of Chieti-Pescara, 66100 Chieti, Italy
dBiosciences Laboratory, Istituto Scientifico Romagnolo per lo Studio e la Cura dei Tumori (IRST) IRCCS, 47014 Meldola, Italy
eDepartment of Experimental, Hematopathology and Hematology Sections, Diagnostic and Specialty Medicine, S. Orsola-Malpighi Hospital, University of Bologna, Bologna, Italy
First published on 12th November 2015
Abstract
Classical Hodgkin lymphoma (cHL) is a malignancy with complex pathogenesis. The hallmark of the disease is the presence of large mononucleated Hodgkin and bi- or multinucleated Reed/Sternberg (H/RS) cells. The origin of HRS cells in cHL is controversial as these cells show the coexpression of markers of several lineages. Using a proteomic approach, we compared the protein expression profile of cHL models of T- and B-cell derivation to find proteins differentially expressed in these cell lines. A total of 67 proteins were found differentially expressed between the two cell lines including metabolic proteins and proteins involved in the regulation of the cytoskeleton and/or cell migration, which were further validated by western blotting. Additionally, the expression of selected B- and T-cell antigens was also assessed by flow cytometry to reveal significant differences in the expression of different surface markers. Bioinformatics analysis was then applied to our dataset to find enriched pathways and networks, and to identify possible key regulators. In the present study, a proteomic approach was used to compare the protein expression profiles of two cHL cell lines. The identified proteins and/or networks, many of which not previously related to cHL, may be important to better define the pathogenesis of the disease, to identify novel diagnostic markers, and to design new therapeutic strategies.
1. Introduction
Classical Hodgkin's lymphoma (cHL) is a lymphoid tumor with high incidence and complex pathogenesis.1 More than 90% of cases belong to the classical form of the disease, while the remaining represent nodular lymphocyte predominant HL (NLPHL).1 The diagnostic lesion of Hodgkin's disease is characterised by the disruption of the normal lymph node structure and the presence of a minority of malignant Hodgkin's and Reed–Sternberg (H/RS) cells localised in a mixed cellular background of non-neoplastic cell populations that comprise T and B cells, eosinophils, neutrophils, plasma cells, histiocytes, fibroblasts, and stromal cells.2The pattern of somatic mutations observed in the rearranged immunoglobulin (Ig) loci suggests that H/RS cells derive from germinal center B cells.3 Nevertheless, the lack of common B cell surface markers and of Ig gene transcripts leads to the conclusions that H/RS cells are dedifferentiated B cells with decreased mRNA levels for nearly all established B-lineage-specific genes.4,5 This specific transcriptional program is a consequence of the over-expression of a network of transcriptional factors including the helix-loop-helix proteins ABF-1 and Id2, which together with the transmembrane receptor Notch1, antagonizes the function of the B cell-transcription factors E2A and EBF.6,7 Although most studies support a B-cell derivation of H/RS cells, other studies that associate cHL with a T-cell genotype were reported.8–10 These phenotypic examinations revealed that H/RS cells express different B- and T-cell markers supporting their B or T cell origin.
To date, these differences have been limited to classical surface markers, for this reason we applied a proteomic and a flow cytometry approach to identify a set of proteins differentially expressed between two Hodgkin's lymphoma cell models of the B- and T-cell origin. A protein list was then defined that integrated experimental data from proteomics and flow cytometry and subjected to bioinformatics analysis to determine pathways and networks over-represented in our dataset. Results pointed out to a modulation of proteasome, cytoskeletal signaling, metabolism, and haematological functions.
2. Experimental
2.1 Cell culture and chemicals
Classical HL cell lines were purchased from German Collection of Microorganisms and Cell Cultures (Braunschweig, Germany). L-1236 and L-428 cell lines were cultured in RPMI-1640 medium supplemented with 10% fetal bovine serum (FBS), 100 U mL−1 penicillin and 100 μg mL−1 streptomycin. HDLM-2 cell line was maintained in RPMI-1640 complete medium supplemented with 20% FBS. Both cell lines were grown at 37 °C in an atmosphere of 5% CO2.The following reagents were obtained from GE Healthcare: IPGs pH 3–10 NL, IPG buffer 3–10, dry strip cover fluid and Hybond ECL membrane and ECL western blotting detection reagents. Primary antibodies used in this work are listed in Table S1 (ESI†). All other reagents were from standard commercial sources and were of the highest grade available.
2.2 Flow cytometry analysis
For surface marker staining, 106 cells were first incubated with monoclonal antibodies in phosphate-buffered saline (PBS) containing 1% bovine serum albumin and 0.1% sodium azide for 30 minutes at 4 °C. The cells were then washed twice with PBS and analyzed on a FACSCanto Flow Cytometer (BD Biosciences, San Jose, CA) equipped with 488 nm (blue) and 633 (red) lasers. The antibodies used in this study are given in Table S1 (ESI†).Appropriate isotype control was used for each sample to assess background fluorescence intensity.11 30![[thin space (1/6-em)]](https://www.rsc.org/images/entities/char_2009.gif) 000 events were recorded for each sample. The acquisition and analysis gates were based on forward (FSC) and side scatter (SSC) properties of cells. FSC and SSC were set in a linear scale. Flow cytometry data were analyzed using FACSDiva Software v 6.1.3 (BD Biosciences, San Jose, CA) and FlowJo software v10.0.7 (TreeStar, Ashland, OR). Fluorescence data were evaluated in terms of mean fluorescence intensity (MFI) related to isotype control.
000 events were recorded for each sample. The acquisition and analysis gates were based on forward (FSC) and side scatter (SSC) properties of cells. FSC and SSC were set in a linear scale. Flow cytometry data were analyzed using FACSDiva Software v 6.1.3 (BD Biosciences, San Jose, CA) and FlowJo software v10.0.7 (TreeStar, Ashland, OR). Fluorescence data were evaluated in terms of mean fluorescence intensity (MFI) related to isotype control.
2.3 2-DE and image analysis
Cell pellets were resuspended in lysis buffer containing 7 M Urea, 2 M thiourea, 4% CHAPS, protease inhibitor cocktail, 1 mM sodium orthovanadate, 10 mM sodium fluoride and sonicated in ice for three rounds of 10 s, and processed as previously described.12 Briefly, protein samples (80 μg) were diluted up to 250 μL with rehydration buffer (7 M urea, 2 thiourea, 4% CHAPS, 65 mM DTT and 0.5% v/v IPG buffer) and applied to IPG strips (13 cm, pH 3–10 NL). IEF in the second dimension was performed using IPGphor IEF and Hoefer SE 600 Ruby electrophoresis (GE Healthcare). The IPG-strips were loaded and run on a 12% SDS-PAGE gel at a constant current of 20 mA per gel. Gels were fixed overnight in a fixing solution and stained according to the protocol of Chevallet and collaborators.13 Gels were scanned using an Image Master scanner at 300 dpi and analysed using Image Master software 5.0. Spot detection and matching were carried out by the software tools and corrected manually when necessary. The analysis was performed by comparing the volume% (vol%) of each spot, expressed as the percentage of the spot volume over the total volume of all spots in the gel. Significant differences in protein levels were determined by Student's t-test with a set value of p < 0.05. Experiments were performed three times independently.2.4 Mass spectrometry analysis
000 m/z per s.
MS data were exported by the software BioTools (version 3.2, Bruker Daltonics) and subjected to database search by using Matrix Science (http://www.matrixscience.com). Peptide masses were compared with those present in the SwissProt human protein database (release 2014_03 of 19-Mar-2014 of UniProtKB/TrEMBL, 54247468 sequence entries). The searching parameters were set as follows: peptide tolerance, 0.05 Da; fragment mass tolerance, 0.25 Da, enzyme, trypsin; missed cleavage, one; instrument, MALDI-TOF/TOF. Peptide tolerance was set to ±1.2 Da, the MS/MS tolerance was set to 0.6 Da, and searching peptide charge of 1+, 2+ and 3+ for ESI-Trap data. Moreover, carbamidomethyl (C) and oxidation (M) were chosen as fixed and variable modifications, respectively.
2.5 Data analysis and bioinformatics
Data were analysed using the statistical software GraphPad (version 4.0). The two-tailed t-test was used to test statistical significance. Differences were considered statistically significant for p-values < 0.05.The bioinformatics interpretation of experimental data was performed based on two main groups of tools: enrichment analysis and protein–protein interaction analysis. The signaling hubs and connectivity networks were obtained using Ingenuity Pathway analysis (IPA, Ingenuity Systems, http://www.ingenuity.com) considering direct and indirect relationships. IPA determines biologically enriched pathways and networks based on direct and indirect relationships derived from the published literature. IPA was also used to identify upstream regulators that are activated or inhibited in our dataset. The p-value is calculated using Fisher's exact test. Pathway analysis was performed using the Database for Annotation, Visualization and Integrated Discovery (DAVID) software (http://david.abcc.ncifcrf.gov/) using the Kyoto Encyclopedia of Genes and Genomes (KEGG) bioinformatics resource. Protein–protein interaction analysis was performed using the software NetworkAnalyst (http://www.networkanalyst.ca/NetworkAnalyst/), using the InnateDB database as described.15
2.6 Western blot analysis
Proteins were extracted in radioimmunoprecipitation assay (RIPA) buffer (Cell Signaling) and quantified by the Bradford protein assay (BIORAD). Samples were separated by 10% SDS-PAGE and transferred to the Hybond ECL nitrocellulose membrane. The membranes were blocked overnight in Blotto A (Santa Cruz) at 4 °C, and subsequently probed by the appropriately diluted primary antibodies for 2 h at room temperature as described.123. Results and discussion
In this paper, we performed a 2-DE MS/MS analysis of whole proteins isolated from two Hodgkin's cell lines L-1236 (B-cell lineage) and HDLM-2 (T-cell lineage), in an attempt to characterize significant proteomic differences.The experimental workflow is reported in Fig. S1 (ESI†). Whole proteins were separated by 2-DE and analysed for the identification of differentially expressed proteins, which were identified by MS/MS and validated by western blot. Moreover, a set of B-cell, plasma cell, T-cell, monocytes, myeloid and hematopoietic stem cell surface markers was analysed by flow cytometry to determine the expression of typical as well as unique antigens in these cells. These results were combined with those of 2-DE and analysed by bioinformatics tools.
As shown in Fig. 1, seven markers showed statistically significant differences between the two cell lines. L-1236 showed a higher expression of the B cell marker CD32, of the lymphocyte homing receptor CD44 and its variant isoform CD44v6, of the marker CD99, and of CD58, which is involved in the interaction with the immune system. Conversely, the expression of T cell markers CD25 and CD123, associated with the generation of the RS phenotype, T-cell activation and proliferation, and cHL diagnosis, was found to be higher in HDLM-2.16–18
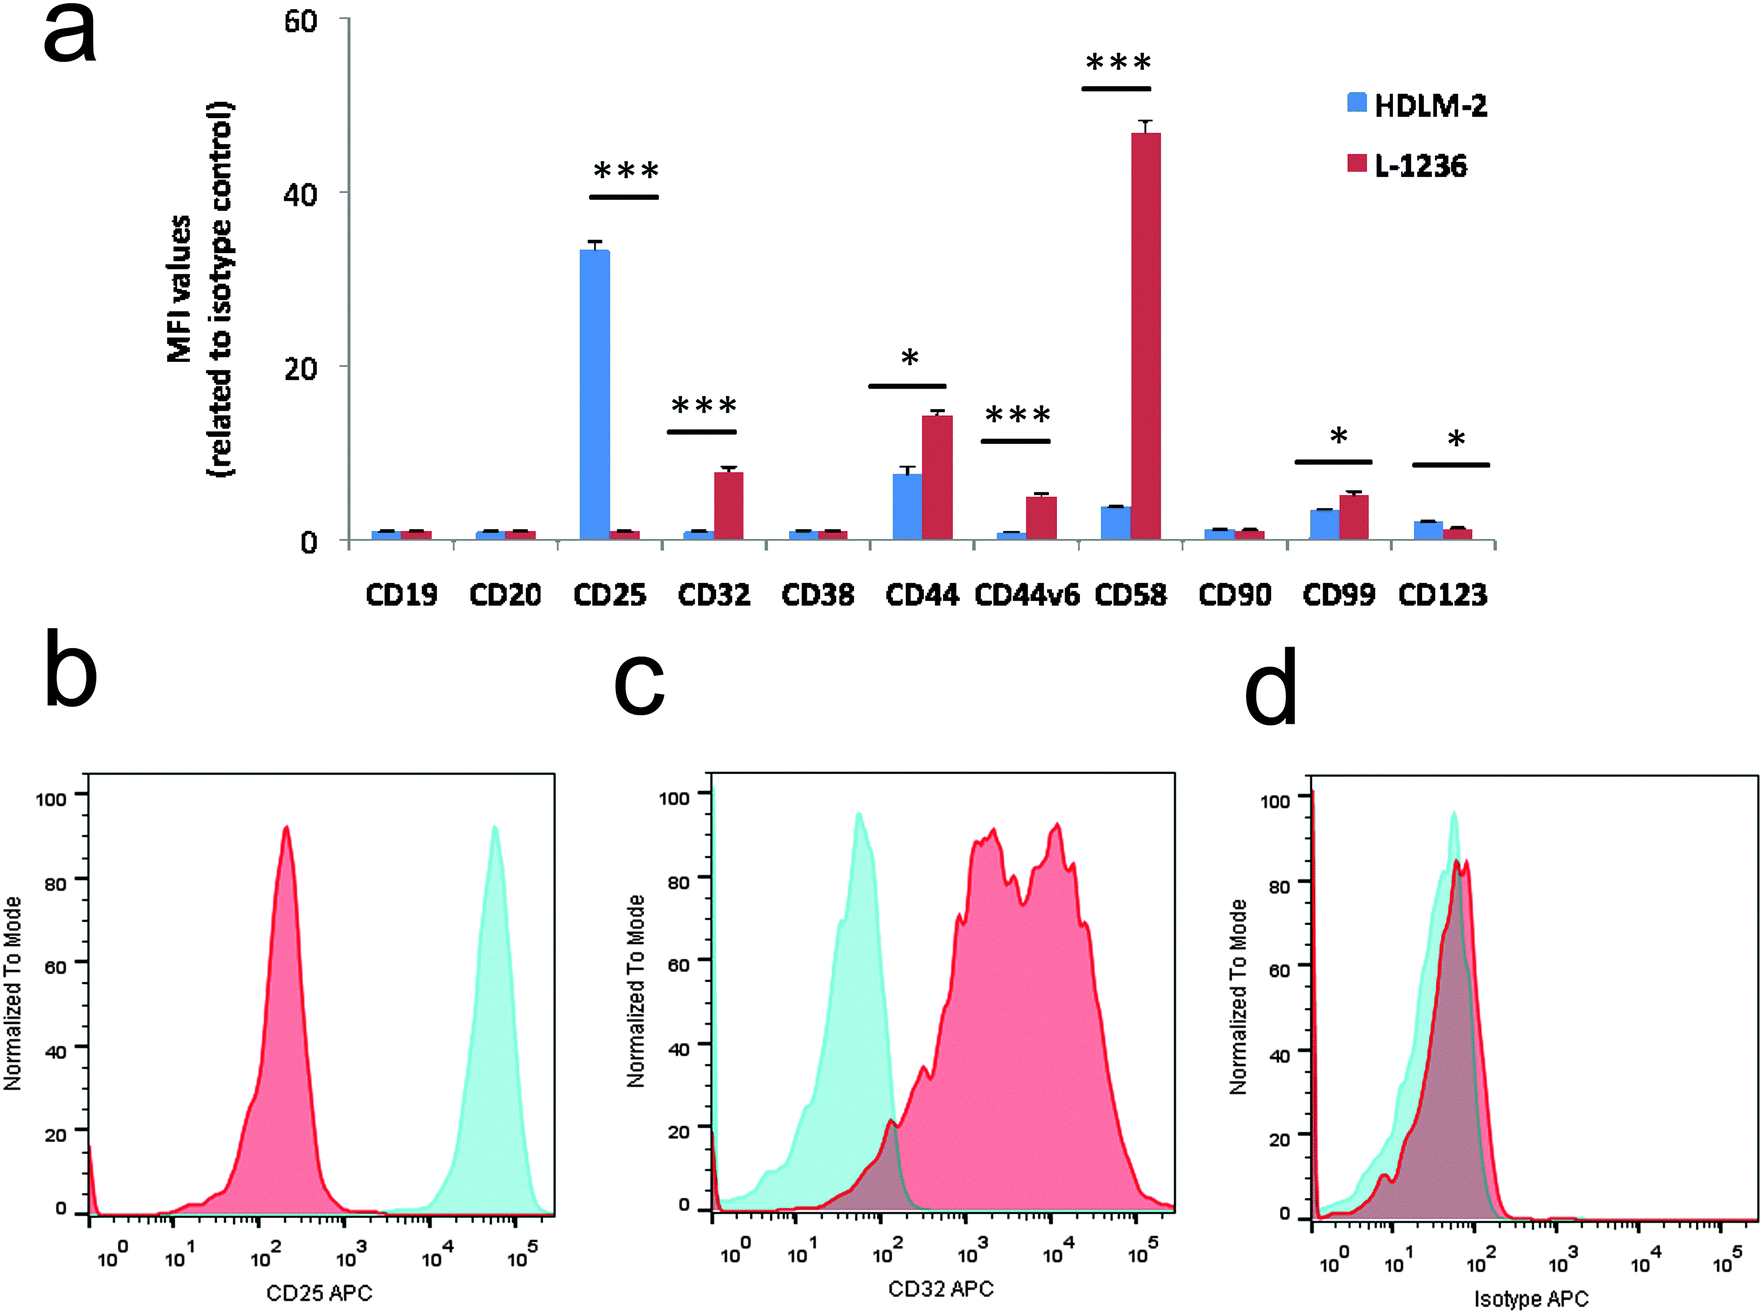 | ||
| Fig. 1 Flow cytometry analysis of cell-surface markers in cHL cell lines. (a) The bar charts show the expression in terms of mean fluorescence intensity (MFI) ± SD related to isotype control. Significant differences in unpaired t tests are indicated (*p < 0.05, **p < 0.005, ***p < 0.0005). (b and c) Representative histograms showing the expression of CD25 and CD32 antigens in HDLM-2 (light blue histogram plot) and L-1236 (red histogram plot). (d) Background signal was assessed by staining with a matched-isotype control in HDLM-2 (light blue histogram plot) and L-1236 (red histogram plot). | ||
In Fig. 2, representative 2-DE gels of HDLM-2 and L-1236 cells are shown. After 2-DE software analysis, 85 spots were shown to be differentially expressed proteins and 67 of them were identified by MS/MS. The list of these proteins is reported in Table 1. Several proteins previously reported to be expressed or up-regulated in H/RS cells were identified, including fascin, which were found to be up-regulated in L-1236 cells. Fascin is an actin cross-linking protein, involved in cell motility in several cell types.19 The protein was found to be up-regulated in L-1236 cells with respect to germinal center (GC) B cells, and proposed as a marker to distinguish cHL from non-Hodgkin lymphoma.20,21
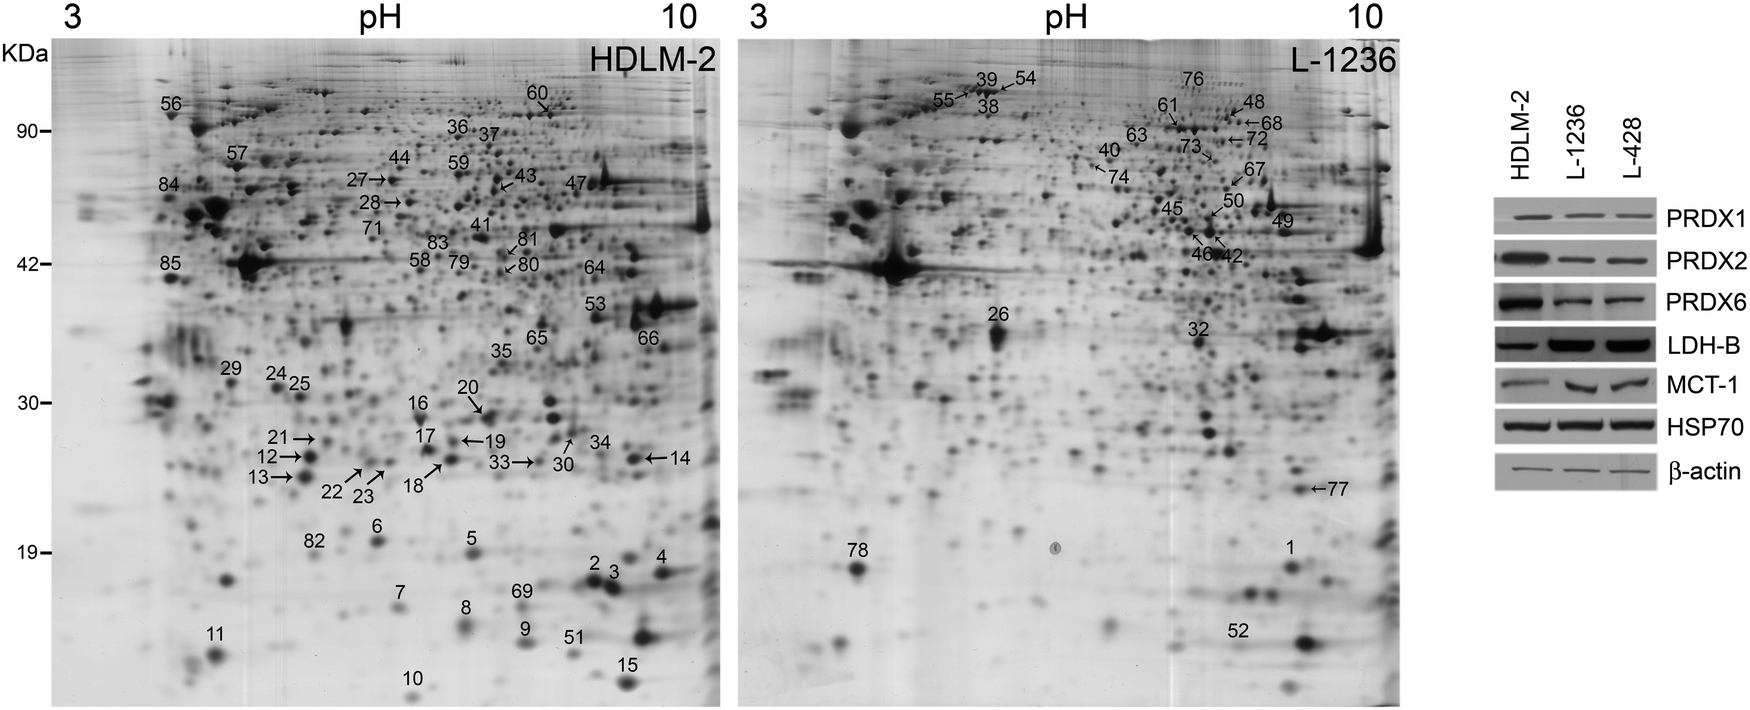 | ||
| Fig. 2 Proteomic analysis of Hodgkin's lymphoma cell lines. (left) Representative 2-DE gel map of HDLM-2 and L-1236 cell proteins. A total of 80 μg of proteins were separated by 2-DE using a 13 cm IPG strip pH 3–10 NL and 12% SDS-PAGE. Proteins were visualized by silver staining. Spot numbers indicate differentially expressed proteins. (right) Western blotting analysis was performed with peroredoxin-1, -2, -6 (PRDX1, PRDX2, PRDX6), lactate dehydrogenase-B (LDH-B), and monocarboxylate transporter 1 (MCT-1) antibodies on 25 μg of total proteins from HDLM-2, L-1236, and L-428 cells. Heat shock protein 70 (HSP70) and β-actin were used as loading control. | ||
| Spot number | Swiss Prot accession no. | Protein name | Gene name | Mascot score | Sequence coverage MS | Sequence coverage MS/MS | Peptides | Fold change HDLM-2/L-1236 | p-Value | Instrument | |
|---|---|---|---|---|---|---|---|---|---|---|---|
| PMF | MS/MS | ||||||||||
| Spot numbers match those reported in the representative 2-DE images shown in Fig. 1 (panel A and B). Accession number in Swiss-Prot/UniprotKB (http://www.uniprot.org/). Fold change (HDLM-2 cells vs. L-1236) was calculated by dividing the average of %VHDLM-2 by the average of %VL-1248 cells of three independent experiments. n.a., not applicable, expressed only in L-1236 cells. p-value: **<0.01; ***<0.001. | |||||||||||
| 1 | P23528 | Cofilin (COF1) | CFL1 | 89 | 122 | 42% | 15% |
K.AVLFCLSEDKK.N
K.HELQANCYEEVKDR.C |
−1.5 | ** | MALDI-TOF/TOF |
| 2 | P62937 | Peptidyl-prolyl cis–trans isomerase A (PPIA) | PPIA | 64 | 107 | 40% | 13% |
R.VSFELFADK.V
R.IIPGFMCQGGDFTR.H R.IIPGFMCQGGDFTR.H + oxidation (M) |
2.1 | *** | MALDI-TOF/TOF |
| 3 | P23284 | Peptidyl-prolyl cis–trans isomerase B (PPIB) | PPIB | — | 82 | — | 48% |
K.FEDENFILK.H
K.KITIADCGQLE.- K.EGMNIVEA K.EG K.VKEG R.IIPGF K.SIYGEKFEDENFILK.H M.VNPTVFFDIAVDGEPLGR.V M.VNPTVFFDIAVDGEPLGR.V |
2.9 | *** | ESI-Trap |
| 4 | P22392 | Nucleoside diphosphate kinase B (NDKB) | NME2 | 60 | 216 | 31% | 31% |
R.GFDCIQVGR.N
K.DRPFFPGLVK.Y R.TFIAIKPGVR.G R.VMLGETNPADSKPGTIR.G + oxidation (M) |
3.3 | *** | MALDI-TOF/TOF |
| 6 | P15531 | Nucleoside diphosphate kinase A (NDKA) | NME1 | 97 | 119 | 42% | 14% |
K.DRPFFAGLVK.Y
R.TFIAIKPDGVQR.G |
3.2 | *** | MALDI-TOF/TOF |
| 7 | P61088 | Ubiquitin-conjugating enzyme E2 N (UBE2N) | UBE2N | 57 | 143 | 34% | 19% |
K.WSPALQIR.T
K.DKWSPALQIR.T R.YFHVVIAPQDSPFEGGTFK.L |
2 | *** | MALDI-TOF/TOF |
| 8 | Q01469 | Fatty acid-binding protein, epidermal (FABP5) | FABP5 | 79 | 184 | 53% | 32% |
K.ELGVGIALR.K
K.TQTVCNFTDGALVQHQEWDGK.E K.LVVECV |
1.9 | *** | MALDI-TOF/TOF |
| 10 | P31949 | Protein S100-A11 (S10AB) | S100A11 | 63 | 29 | 34% | 12% | K.YAGKDGYNTLSK.T | 7.2 | *** | MALDI-TOF/TOF |
| 11 | P09382 | Galectin-1 (LEG1) | LGALS1 | 73 | 263 | 51% | 30% |
K.DSNNLCLHFNPR.F
R.FNAHGDANTIVCNSK.D R.LNLEAINY |
2.1 | *** | MALDI-TOF/TOF |
| 12 | P32119 | Peroredoxin-2 (PRDX2) | PRDX2 | 69 | 51 | 23% | 5% | R.QITVNDLPVGR.S | 5.4 | *** | MALDI-TOF/TOF |
| 13 | P07741 | Adenine phosphoribosyltransferase (APT) | APRT | 60 | 147 | 28% | 21% |
R.IDYIAGLDSR.G
R.SFPDFPTPGVVFR.D K.AELEIQKDALEPGQR.V |
7.5 | *** | MALDI-TOF/TOF |
| 14 | Q06830 | Peroxiredoxin-1 (PRDX1) | PRDX1 | — | 47 | — | 29% |
R.TIAQDYGVLK.A
K.ATAV R.LVQAFQFTDK.H R.QITVNDLPVGR.S |
2.6 | *** | MALDI-TOF/TOF |
| 16 | P30041 | Peroxiredoxin-6 (PRDX6) | PRDX6 | 76 | 113 | 20% | 12% |
R.NFDEILR.V
R.VVFVFGPDK.K K.LSILYPATTGR.N |
11.1 | *** | MALDI-TOF/TOF |
| 17 | P61106 | Ras-related protein Rab-14 (RAB14) | RAB14 | 59 | 107 | 31% | 13% | K.IYQNIQDGSLDLNAAESGVQHKPSAPQGGR.L | 2.3 | *** | MALDI-TOF/TOF |
| 18 | Q99497 | Protein DJ-1 (PARK7) | PARK7 | 63 | 42 | 37% | 7% |
K.GAEE![[M with combining low line]](https://www.rsc.org/images/entities/char_004d_0332.gif) ETVIPVDVR.R + 2 oxidation (M) ETVIPVDVR.R + 2 oxidation (M)
|
2.7 | *** | MALDI-TOF/TOF |
| 19 | P49720 | Proteasome subunit beta type-3 (PSB3) | PSMB3 | 61 | 130 | 22 | 14.6 |
R.FGPYYTEPVIAGLDPK.T
R.FGIQAQ |
1.8 | ** | MALDI-TOF/TOF |
| 20 | P30041 | Peroxiredoxin-6 (PRDX6) | PRDX6 | 75 | 115 | 23% | 13% |
K.LPFPIIDDR.N
R.VVFVFGPDKK.L K.LSILYPATTGR.N |
2.1 | *** | MALDI-TOF/TOF |
| 21 | P09211 | Glutathione S-transferase P (GSTP1) | GSTP1 | 136 | 214 | 57% | 20% |
M.PPYTVVYFPVR.G
K.EEVVTVETWQEGSLK.A K.FQDGDLTLYQSNTILR.H |
2.2 | *** | MALDI-TOF/TOF |
| 24 | Q9UL46 | Proteasome activator complex subunit 2 (PSME2) | PSME2 | 107 | 138 | 39% | 14% |
R.KQVEVFR.Q
K.TKVEAFQTTISK.Y R.ALVHERDEAAYGELR.A |
1.5 | ** | MALDI-TOF/TOF |
| 25 | P35232 | Prohibitin (PHB) | PHB | 75 | 153 | 30% | 12% |
K.DLQNVNITLR.I
R.ILFRPVVASQLPR.I R.IFTSIGEDYDER.V |
1.5 | ** | MALDI-TOF/TOF |
| 26 | P07195 | L-Lactate dehydrogenase B chain (LDH-B) | LDHB | 125 | 127 | 33% | 11% |
K.IVVVTAGVR.G
R.VIGSGCNLDSAR.F K.GEM |
−1.4 | ** | MALDI-TOF/TOF |
| 27 | P17987 | T-complex protein 1 subunit alpha (TCPA) | TCP1 | 96 | 214 | 22% | 6% |
K.YFVEAGAMAVR.R
K.IHPTSVISGYR.L R.YINENLIVNTDELGR.D |
1.5 | *** | MALDI-TOF/TOF |
| 28 | Q16222 | UDP-N-acetylhexosamine pyrophosphorylase (UAP1) | UAP1 | 90 | 112 | 13% | 4% |
K.TLFQIQAER.I
R.KTLFQIQAER.I K.VAVLLLAGGQGTR.L |
2.8 | *** | MALDI-TOF/TOF |
| 29 | O00299 | Chloride intracellular channel protein 1 (CLIC1) | CLIC1 | 149 | 276 | 52% | 18% |
K.IEEFLEAVLCPPR.Y
R.GFTIPEAFR.G R.EEFASTCPDDEEIELAYEQVAK.A |
1.7 | ** | MALDI-TOF/TOF |
| 30 | P62826 | GTP-binding nuclear protein Ran (RAN) | RAN | 74 | 99 | 25% | 8% |
K.YVATLGVEVHPLVFHTNR.G
K.KYVATLGVEVHPLVFHTNR.G |
−1.8 | *** | MALDI-TOF/TOF |
| 31 | P04083 | Annexin A1 (ANXA1) | ANXA1 | 109 | 399 | 41% | 15% |
K.GTDVNVFNTILTTR.S
K.QAWFIENEEQEYVQTVK.S K.GGPGSAVSPYPTFNPSSDVAALHK.A |
2.5 | *** | MALDI-TOF/TOF |
| 32 | P40925 | Malate dehydrogenase, cytoplasmic (MDHC) | MDH1 | 58 | 173 | 18% | 6% |
K.GEFVTTVQQR.G
K.FVEGLPINDFSR.E |
−1.7 | ** | MALDI-TOF/TOF |
| 33 | P49721 | Proteasome subunit beta type 2 (PSB2) | PSMB2 | 59 | 212 | 26% | 17% |
R.YYTPTISR.E
K.NGIHDLDNISFPK.Q R.NGYELSPTAAANFTR.R |
1.8 | *** | MALDI-TOF/TOF |
| 34 | P28062 | Proteasome subunit beta type-8 (PSB8) | PSMB8 | 66 | 42 | 18% | 9% |
K.FQHGVIAAVDSR.A
K.KGPGLYYVDEHGTR.L |
2.5 | *** | MALDI-TOF/TOF |
| 36 | P15311 | Ezrin (EZRI) | EZR | 111 | 134 | 25% | 4% |
K.IGFPWSEIR.N
R.IQVWHAEHR.G K.KAPDFVFYAPR.L |
1.9 | *** | MALDI-TOF/TOF |
| 37 | P26038 | Moesin (MOES) | MSN | — | 166 | — | 10% |
K.ESPLLFK.F
K.APDFVFYAPR.L R.EVWFFGLQYQDTK.G K.KTQEQLALEMAELTAR.I + oxidation (M) K.IAQDLEMYGVNYFSIK.N + oxidation (M) |
2.4 | *** | ESI-Trap |
| 38 | P43246 | DNA mismatch repair protein Msh2 (MSH2) | MSH2 | 67 | 194 | 11% | 4% |
K.LDSSAQFGYYFR.V
R.FFQG R.GDFYTAHGEDALLAAR.E |
−2.5 | *** | MALDI-TOF/TOF |
| 39 | P42704 | Leucine-rich PPR motif-containing protein, mitochondrial (LPPRC) | LRPPRC | 109 | 37 | 15% | 1% |
K.SNTLPISLQSIR.S
K.VIEPQYFGLAYLFR.K |
−1.9 | ** | MALDI-TOF/TOF |
| 40 | P26038 | Moesin (MOES) | MSN | 139 | 42 | 21% | 4% |
K.IGFPWSEIR.N
K.APDFVFYAPR.L R.IQVWHEEHR.G |
−3.9 | *** | MALDI-TOF/TOF |
| 41 | P26641 | Elongation factor 1-gamma (EF1G) | EEF1G | 166 | 166 | 25 | 8% |
K.ALIAAQYSGAQVR.V
K.DGWSLWYSEYR.F R.VLSAPPHFHFGQTNR.T |
1.5 | ** | MALDI-TOF/TOF |
| 42 | Q16658 | Fascin (FSCN1) | FSCN1 | 220 | 249 | 41% | 7% |
R.FLIVAHDDGR.W
K.NASCYFDIEWR.D R.LVARPEPATGYTLEFR.S |
−8.9 | *** | MALDI-TOF/TOF |
| 44 | P09960 | Leukotriene A-4 hydrolase (LKHA4) | LTA4H | 66 | 42 | 17% | 5% |
R.TLTGTAALTVQSQEDNLR.S
R.MQEVYNFAINNSEIR.F + oxidation (M) |
3.1 | *** | MALDI-TOF/TOF |
| 45 | Q9Y230 | RuvB-like 2 (RUVB2) | RUVBL2 | 83 | 67 | 21% | 7% |
R.GTSYQSPHGIPIDLLDR.L
K.EVVHTVSLHEIDVINSR.T |
−3.7 | *** | MALDI-TOF/TOF |
| 46 | Q16658 | Fascin (FSCN1) | FSCN1 | 86 | 99 | 33% | 8% |
R.FLIVAHDDGR.W
K.LINRPIIVFR.G K.KNGQLAASVETAGDSELFL |
−9 | *** | MALDI-TOF/TOF |
| 48 | Q7KZF4 | Staphylococcal nucleare domain- containing protein (SND1) | SND1 | 110 | 202 | 18% | 3% |
K.FVDGEWYR.A
K.DTPDEPWAFPAR.E R.NDIASHPPVEGSYAPR.R |
−2.1 | *** | MALDI-TOF/TOF |
| 49 | P34897 | Serine hydroxymethyltransferase, mitochondrial (GLYM) | SHMT2 | 61 | 142 | 27% | 9% |
R.LIIAGTSAYAR.L
K.TGLIDYNQLALTAR.L R.GYSLVSGGTDNHLVLVDLRPK.G |
−2.5 | *** | MALDI-TOF/TOF |
| 50 | Q16658 | Fascin (FSCN1) | FSCN1 | 150 | 171 | 42% | 6% |
R.FLIVAHDDGR.W
K.LINRPIIVFR.G K.NASCYFDIEWR.D |
−1.8 | ** | MALDI-TOF/TOF |
| 51 | P02775 | Platelet basic protein (CXCL7) | PPBP | 86 | 239 | 38% | 29% |
K.ICLDPDAPR.I
K.GTHCNQVEVIATLK.D K.GKEESLDSDLYAELR.C |
2.9 | *** | MALDI-TOF/TOF |
| 53 | P07355 | Annexin A2 (ANXA2) | ANXA2 | 67 | 82 | 21% | 7% |
K.WISITER.S + oxidation (M)
K.AYTNFDAER.D R.QDIAFAYQR.R |
7.8 | *** | MALDI-TOF/TOF |
| 55 | O15067 | Phosphoribosylformylglycinamide synthetase (PUR4) | PFAS | 109 | 45 | 15% | 2% |
K.FGEPVLAGFAR.S
R.SLGLQLPDGQR.R K.GWAAAVTFHPR.A |
−3.4 | *** | MALDI-TOF/TOF |
| 56 | P14625 | Endoplasmin (ENPL) | HSP90B1 | 78 | 80 | 14% | 3% |
K.IYFMAGSSR.K
K.FAFQAEVNR.M K.SILFVPTSAPR.G |
1.5 | ** | MALDI-TOF/TOF |
| 57 | P13796 | Plastin-2 (PLSL) | LCP1 | 100 | 81 | 18% | 2% | R.WANYHLENAGCNK.I | 1.7 | ** | MALDI-TOF/TOF |
| 58 | P30740 | Leukocyte elastase inhibitor | SERPINB1 | 115 | 48 | 27% | 6% |
R.HNSSGSILFLGR.F
K.TFHFNTVEEVHSR.F |
1.7 | ** | MALDI-TOF/TOF |
| 59 | P49368 | T-complex protein 1 subunit gamma (TCPG) | CCT3 | 87 | 145 | 12% | 6% |
R.NLQDAMQVCR.N
R.TLIQNCGASTIR.L K.A |
1.4 | ** | MALDI-TOF/TOF |
| 60 | P13639 | Elongation factor 2 (EF2) | EEF2 | 160 | 109 | 25% | 3% |
M.VNFTVDQIR.A
K.YEWDVAEAR.K K.TGTITTFEHAHNMR.V |
1.4 | ** | MALDI-TOF/TOF |
| 61 | P13639 | Elongation factor 2 (EF2) | EEF2 | 93 | 58 | 18% | 2% |
M.VNFTVDQIR.A
K.YEWDVAEAR.K |
−4.8 | *** | MALDI-TOF/TOF |
| 62 | P19338 | Nucleolin (NUCL) | NCL | 61 | 97 | 13% | 2% | K.GLSEDTTEETLKESFDGSVR.A | n.a | n.a | MALDI-TOF/TOF |
| 63 | P33993 | DNA replication licensing factor MCM7 (MCM7) | MCM7 | 106 | 118 | 20% | 2% |
R.FELYFQGPSSNKPR.V
R.RFELYFQGPSSNKPR.V |
−1.5 | ** | MALDI-TOF/TOF |
| 67 | P14866 | Heterogeneus nuclear ribonucleoprotein L (HNRNPL) | HNRNPL | 92 | 86 | 11% | 5% |
R.RMGPPVGGHR.R
R.YYGGGSEGGRAPK.R R.NNRFSTPEQAAK.N |
−1.7 | ** | MALDI-TOF/TOF |
| 68 | P11586 | C-1-tetrahydrofolate synthase, cytoplasmic (C1TC) | MTHFD1 | 105 | 71 | 17% | 2% |
K.VVGDVAYDEAKER.A
R.LDIDPETITWQR.V |
−1.9 | ** | MALDI-TOF/TOF |
| 71 | P35998 | 26S proteasome regulatory subunit 7 (PRS7) | PSMC2 | 61 | 67 | 20% | 9% |
R.KIEFSLPDLEGR.T
K.QTLQSEQPLVAR.C K.ACLIFFDEIDAIGGAR.F |
1.7 | ** | MALDI-TOF/TOF |
| 72 | Q92499 | ATP-dependent RNA helicase DDX1 (DDX1) | DDX1 | 150 | 98 | 28% | 5% |
K.MDQAIIFCR.T
K.HYYEVSCHDQGLCR.V R.DQLSVLENGVDIVVGTPGR.L |
−2.1 | *** | MALDI-TOF/TOF |
| 74 | P26038 | Moesin (MOES) | MSN | 140 | 176 | 28% | 7% |
R.IQVWHEEHR.G
K.TQEQLALEMAELTAR.I K.FYPEDVSEELIQDITQR.L |
−1.9 | ** | MALDI-TOF/TOF |
| 76 | P11498 | Pyruvate carboxylase, mitochondrial (PYC) | PC | 139 | 128 | 17% | 3% |
R.FIGPSPEVVR.K
K.VVEIAPAAHLDPQLR.T R.VVHSYEELEENYTR.A |
−2.4 | *** | MALDI-TOF/TOF |
| 78 | P63241 | Eukaryotic translation initiation factor 5A-1 (IF5A1) | EIF5A | 62 | 45 | 35% | 7% | R.EDLRLPEGDLGK.E | −2 | *** | MALDI-TOF/TOF |
| 79 | Q8WVY7 | Ubiquitin-like domain-containing CTD phosphatase 1 (UBCP1) | UBLCP1 | 63 | 29 | 18% | 4% | K.LLVLDVDYTLFDHR | 2.6 | *** | MALDI-TOF/TOF |
| 80 | P61160 | Actin-related protein 2 (ARP2) | ACTR2 | 61 | 151 | 20% | 10% |
K.HLWDYTFGPEK.L
R.GYAFNHSADFETVR.M K.HIVLSGGSTMYPGLPSR.L + oxidation (M) |
1.6 | ** | MALDI-TOF/TOF |
| 81 | P55263 | Adenosine kinase (ADK) | ADK | 135 | 146 | 29% | 9% |
R.IVIFTQGR.D
K.VAQWMIQQPHK.A + oxidation (M) K.FKVEYHAGGSTQNSIK.V |
2.1 | *** | MALDI-TOF/TOF |
| 82 | Q9BV57 | 1,2-Dihydroxy-3-keto-5-methylthiopentene dioxygenase (MTND) | ADI1 | 75 | 124 | 38% | 13% |
R.YILDGSGYFDVR.D
K.GD |
2.1 | *** | MALDI-TOF/TOF |
| 83 | P23526 | Adenosylhomocysteinase (SAHH) | AHCY | — | 84 | — | 10% |
K.VPAINVNDSVTK.S
K.ALDIAENE K.ALDIAENE R.ATDV |
1.8 | ** | ESI-Trap |
| 84 | P07237 | Protein disulfide-isomerase (PDIA1) | P4HB | 130 | 142 | 27% | 7% |
K.FFPASADR.T
K.VDATEESDLAQQYGVR.G K.ILFIFIDSDHTDNQR.I |
1.6 | ** | MALDI-TOF/TOF |
| 85 | P08865 | 40S ribosomal protein SA (RSSA) | RPSA | 149 | 207 | 53% | 14% |
K.FAAATGATPIAGR.F
R.AIVAIENPADVSVISSR.N R.EHPWEVMPDLYFYR.D |
2.9 | *** | MALDI-TOF/TOF |
2-DE analysis of cHL cells also revealed a significant difference in the expression of three members of peroxiredoxins (PRDXs) family. This is a group of proteins (PRDX1-6) that catalyse the reduction of molecules causing oxidative stress such as reactive oxygen species. Schneider and collaborators demonstrated that an elevated PRDX2 methylation was present in cHL cell lines L-428, KMH2, L-1236, and UHO1, but not HDLM-2.22 This is consistent with our data that showed an up-regulation of PRDX2 in HDLM-2. Moreover, our results extend these differences to other members of PRDX family, PRDX1 and PRDX6, which are differentially expressed in cHL cell lines (Table 1 and Fig. 2). As shown in Fig. 2, western blot analysis confirmed that all B-cell lineage cells (L-1236, and L-428) exhibited lower protein levels compared to HDLM-2.
Altered metabolism is a hallmark of cancer. High glycolytic activity was observed in cHL cells, and increased glycolysis and lactate export occur in cancer-associated stroma.23 Stroma cells can then metabolize lactate and shuttle this energy source to cancer cells. As demonstrated by 2-DE and validated by western blot, cHL cells L-1236 showed a higher expression of lactate dehydrogenase-B (LDH-B), an enzyme that mediates the metabolism of lactate through the conversion of pyruvate into lactate. Moreover, a significant increase in the levels of the lactate transporter MCT1 was observed in L-1236 and L-428 compared to HDLM-2 (Fig. 2) further supporting the role of lactate in cHL cells of B-cell lineage.
The data obtained from proteomics and flow cytometry were then combined and analysed in silico using different bioinformatics tools. To identify the KEGG pathway statistically over-represented in our dataset, a pathway analysis was performed using the software DAVID. After p-value and Benjamini correction, two pathways were identified as the most significantly enriched, including the proteasome pathway (p-value < 4.6 × 10⁻⁴; Benjamini 2.3 × 10⁻²), which includes five members (Fig. S2, ESI†) whose expression is increased in HDLM-2, and the hematopoietic cell lineage pathway (p-value 5.1 × 10⁻⁴; Benjamini 1.3 × 10⁻²), which includes six members (Fig. S3, ESI†) some of these differentially expressed as described (Fig. 1).
The proteasome system plays an important role in regulating several biological processes including cell cycle, and antigen presentation.24 Proteasome targeting emerged as a therapeutic option for the treatment of different tumor types including relapsed or refractory mantle cell lymphoma.25
Experimental data were analyzed using IPA. We first examined the most relevant canonical pathways; this analysis confirms the role of proteasome in addition to pathways related to metabolism and Rho signalling that were enriched in our dataset (Table 2). Top pathways were related to protein ubiquitination (7.52 × 10⁻⁵), folate polyglutamylation (1.80 × 10⁻⁴), RhoGDI signaling (5.00 × 10⁻⁴), folate transformations I (6.40 × 10⁻⁴), and RhoA signaling (1.18 × 10⁻³).
| Name | p-Value | Overlap |
|---|---|---|
| NOTE: Fisher's test was used to calculate a p-value determining the statistical association between genes in the dataset and those in the canonical pathway (p<0.05). Overlap, a ratio of the number of genes in our dataset that maps to the pathway divided by the total number of genes in that pathway. | ||
| Protein ubiquitination pathway | 7.52 × 10⁻⁵ | 7/241 (0.029) |
| Folate polyglutamylation | 1.80 × 10⁻⁴ | 2/5 (0.4) |
| RhoGDI signaling | 5.00 × 10⁻⁴ | 5/153 (0.033) |
| Folate transformations I | 6.40 × 10⁻⁴ | 2/9 (0.222) |
| RhoA signaling | 1.18 × 10⁻³ | 4/108 (0.037) |
A total of three significant networks were identified by IPA (Fig. 3 and Table 3): (i) cellular growth and proliferation, cellular development, hematological system development and function, (ii) cellular development, cellular growth and proliferation, hematological system development and function, and (iii) hematological system development and function, tissue morphology, and cellular development. These results reveal the role of input proteins in a particular biological context and help to identify functional interactions with additional molecules in an enriched network. For example, in the cellular representation of the cellular growth and proliferation, cellular development, hematological system development and function, IPA identified interactions between our input proteins (shown in green and red) and other molecules participating in possible functional interactions, and highlights the role of IL2RA (CD25) as the main hub of this network (Fig. 3). As described in Table 3, two networks were enriched for the same biological functions related to cellular development, cellular growth and proliferation, hematological system development and function. However, as described in Table 3 and as shown in Fig. 3, proteins associated with these two networks are different. This means that in our models this network can be modulated by the action of a different set of proteins. In fact, as shown in Fig. 3, main hubs are represented by IL2RA and IFNG, for the first network and CD28, IL15, and LCK for the second one.
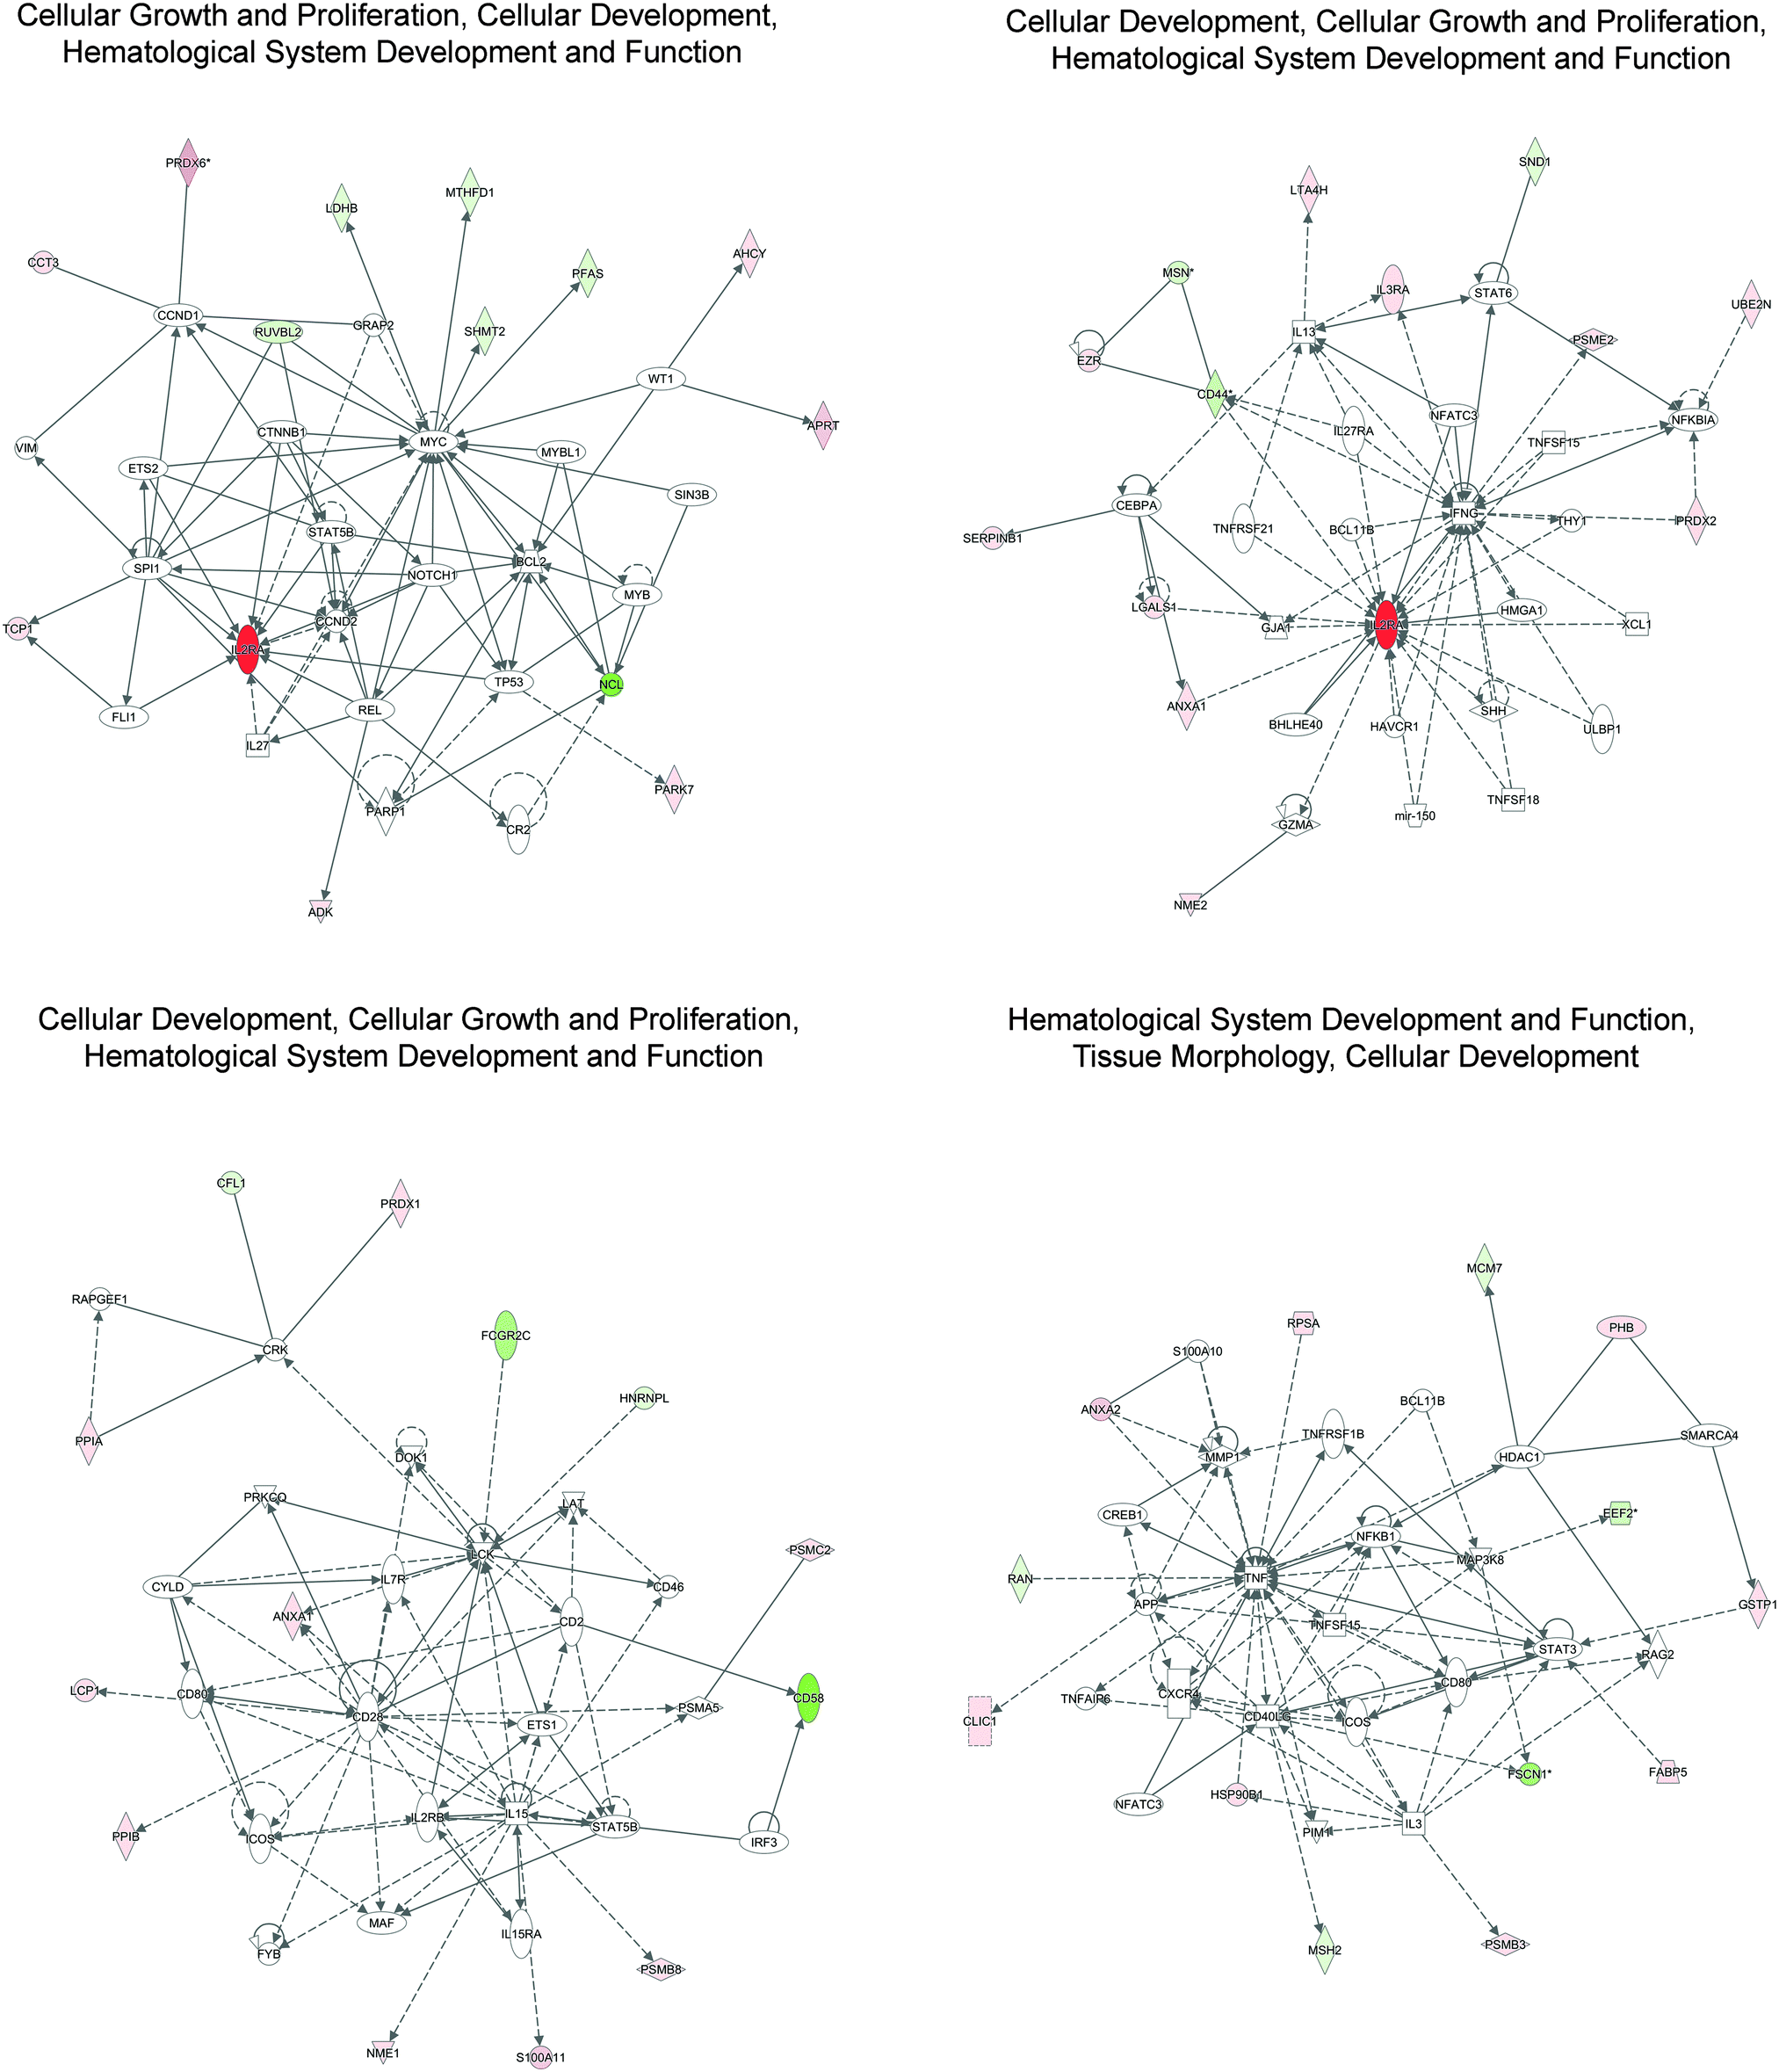 | ||
| Fig. 3 Graphical representation of the top score networks identified by IPA. The network is displayed graphically as nodes and edges. The node color intensity indicates the expression of genes: red up-regulated, green down-regulated in HDLM2 vs. L-1236. Lines indicate the interactions between proteins, in which solid lines show the direct interaction and broken lines show indirect interaction. Lines with arrows represent direct interactions between proteins, while no-arrow lines represent binding only. | ||
| Top diseases and functions | Score | Molecules in network |
|---|---|---|
| NOTE: The score is a numerical value used to rank networks according to how relevant they are to the genes in the input dataset. This score may not be an indication of the quality or significance of the network. Score network represents −log10 of the p-value that is calculated by Fisher's exact test right-tailed. | ||
| Cellular growth and proliferation, cellular development, hematological system development and function | 19 | ADK, AHCY, APRT, BCL2, CCND1, CCND2, CCT3, CR2,CTNNB1, ETS2, FLI1, GRAP2, IL27, IL2RA, LDHB, MTHFD1, MYB, MYBL1, MYC, NCL, NOTCH1, PARK7, PARP1, PFAS, PRDX6, REL, RUVBL2, SHMT2, SIN3B, SPI1, STAT5B, TCP1, TP53, VIM, WT1 |
| Cellular development, cellular growth and proliferation, hematological system development and function | 19 | ANXA1, BCL11B, BHLHE40, CD44, CEBPA, EZR, GJA1, GZMA, HAVCR1, HMGA1, IFNG, IL13, IL27RA, IL2RA, IL3RA, LGALS1, LTA4H, mir150, MSN, NFATC3, NFKBIA, NME2, PRDX2, PSME2, SERPINB1, SHH, SND1, STAT6, THY1, TNFRSF21, TNFSF15, TNFSF18, UBE2N, ULBP1, XCL1 |
| Cellular development, cellular growth and proliferation, hematological system development and function | 18 | ANXA1, CD2, CD28, CD46, CD58, CD80, CFL1, CRK, CYLD, DOK1, ETS1, FCGR2C, FYB, HNRNPL, ICOS, IL15, IL15RA, IL2RB, IL7R, IRF3, LAT, LCK, LCP1, MAF, NME1, PPIA, PPIB, PRDX1, PRKCQ, PSMA5, PSMB8, PSMC2, RAPGEF1, S100A11, STAT5B |
| Hematological system development and function, tissue morphology, cellular development | 18 | ANXA2, APP, BCL11B, CD80, CD40LG, CLIC1, CREB1, CXCR4, EEF2, FABP5, FSCN1, GSTP1, HDAC1, HSP90B1, ICOS, IL3, MAP3K8, MCM7, MMP1, MSH2, NFATC3, NFKB1, PHB, PIM1, PSMB3, RAG2, RAN, RPSA, S100A10, SMARCA4, STAT3, TNF, TNFAIP6, TNFRSF1B, TNFSF15 |
In all these networks, central hubs with high connectivity were identified including NF-κB, STAT, Bcl-2, IFNG, NOTCH1, and Myc, which are important regulators of cHL growth and survival.26–28 A constitutive activation of phospho-STAT3 Tyr705 was detected in cHL cell lines, with high levels in HDLM-2 compared to L-1236 and L-428, and H/RS cells from 27 of 31 (87%) classical cHL cases.27 A functional role for canonical and non-canonical NF-κB signaling was also described in cHL.28
The molecular mechanisms behind the regulation of our entire dataset can be under control of a group of potential regulators. We used IPA to define a possible list of molecules with the role of regulation. Results are shown in Fig. 4 and Table 4. Among the identified proteins, IL1B has the most significant z-score. This cytokine may be involved in the regulation of cancer invasion and B-cell activation but its role in cHL needs to be further evaluated.
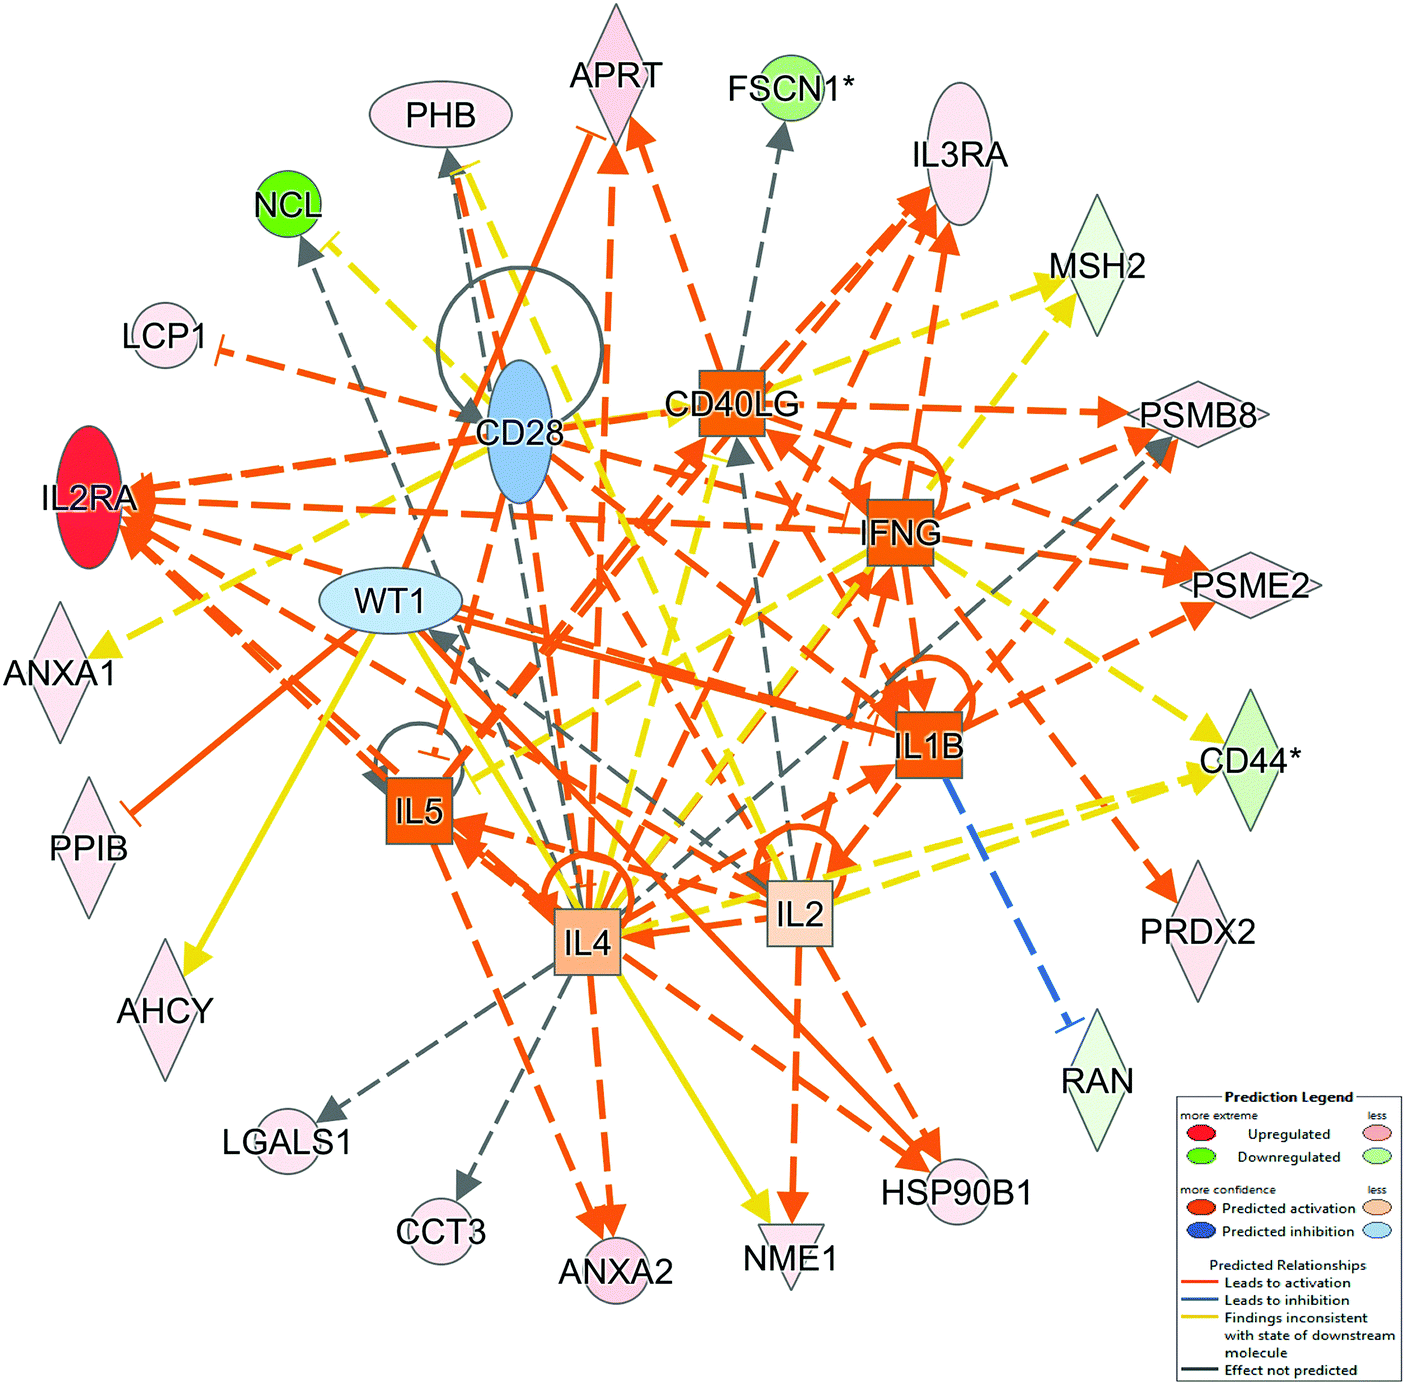 | ||
| Fig. 4 IPA top upstream regulators. Upstream regulator analysis identifies the cascade of upstream transcriptional regulators that can explain the observed gene expression changes in our dataset. | ||
| Upstream regulator | Activation z-score | p-Value of overlap | Molecule | Target molecules in dataset |
|---|---|---|---|---|
| NOTE: IPA upstream regulator analysis was used to identify upstream transcriptional regulators that can explain the observed protein expression changes in the lymphoma dataset. For each potential transcriptional regulator two statistical measures were calculated: p-value overlap and an activation z-score. The p-value overlap identifies likely upstream regulators based on significant overlap between dataset genes and known targets regulated by a regulator. The activation z-score is used to predict probable activation states of upstream regulators based on comparison with a model that assigns random regulation directions. In the table are reported upstream regulators with a calculated z score. IL1B has a statistical significant z score (z score ≥2 or ≤2). | ||||
| IL1B | 2.000 | 2.56 × 10⁻³ | Cytokine | IL2RA, PSMB8, PSME2, RAN |
| IL5 | 1.953 | 1.52 × 10⁻² | Cytokine | ANXA2, HSP90B1, IL2RA, IL3RA |
| IFNG | 1.814 | 2.23 × 10⁻² | Cytokine | CD44, IL2RA, IL3RA, PRDX2, PSMB8, PSME2 |
| CD40LG | 1.664 | 3.03 × 10⁻⁴ | Cytokine | APRT, FSCN1, IL2RA, IL3RA, MSH2, PSMB8, PSME2 |
| IL4 | 0.640 | 1.06 × 10⁻⁵ | Cytokine | ANXA2, APRT, CCT3, CD44, IL2RA, IL3RA, LGALS1, MSH2, NCL, PHB, PSMB8 |
| IL2 | 0.362 | 2.23 × 10⁻² | Cytokine | CD44, HSP90B1, IL2RA, NME1, PHB |
| WT1 | −0.391 | 2.06 × 10⁻⁵ | Transcription regulator | AHCY, APRT, HSP90B1, NME1, PPIB |
| CD28 | −0.692 | 6.10 × 10⁻³ | Transmembrane receptor | ANXA1, IL2RA, LCP1, NCL, PHB |
To elucidate the possible interactome of our dataset, a network of protein–protein interaction (PPI) was generated using the software NetworkAnalyst. Fig. S4 (ESI†) shows the network constructed from our dataset, six important nodes were identified and are listed in Table S2 (ESI†). This list includes: Nucleolin, Ezrin, 40S Ribosomal protein SA, 14-3-3 protein zeta/delta, Protein disulfide-isomerase, and Elongation factor 2. Previous studies already described the role of some of these proteins in the regulation of cellular processes involved in cancer progression29 and their up-regulation in cHL and lymphoma models.30,31 If we consider the main hubs identified by NetworkAnalyst, we can observe the presence of Ezrin, which further underscores the relevance of proteins involved in cytoskeletal organization/signaling to differentiate the two cell models. Ezrin together with the members of the Rho pathway, which was identified by IPA as the enriched canonical pathway of our dataset, bridge the plasma membrane with the actin cytoskeleton to regulate actin polymerization, cell motility, and gene expression (Fig. 5). Fig. 5 shows a graphical representation of this pathway, which includes members of Ezrin–Moesin–Radixin (ERM) protein family, several transmembrane proteins, members of the cofilin pathway, and other signalling molecules. Up-regulation of Cofilin, Rock, and Ezrin was observed in HDLM-2 cells, while a higher expression level of Src was observed in L-1236 and L-428 (Fig. 5 inbox).
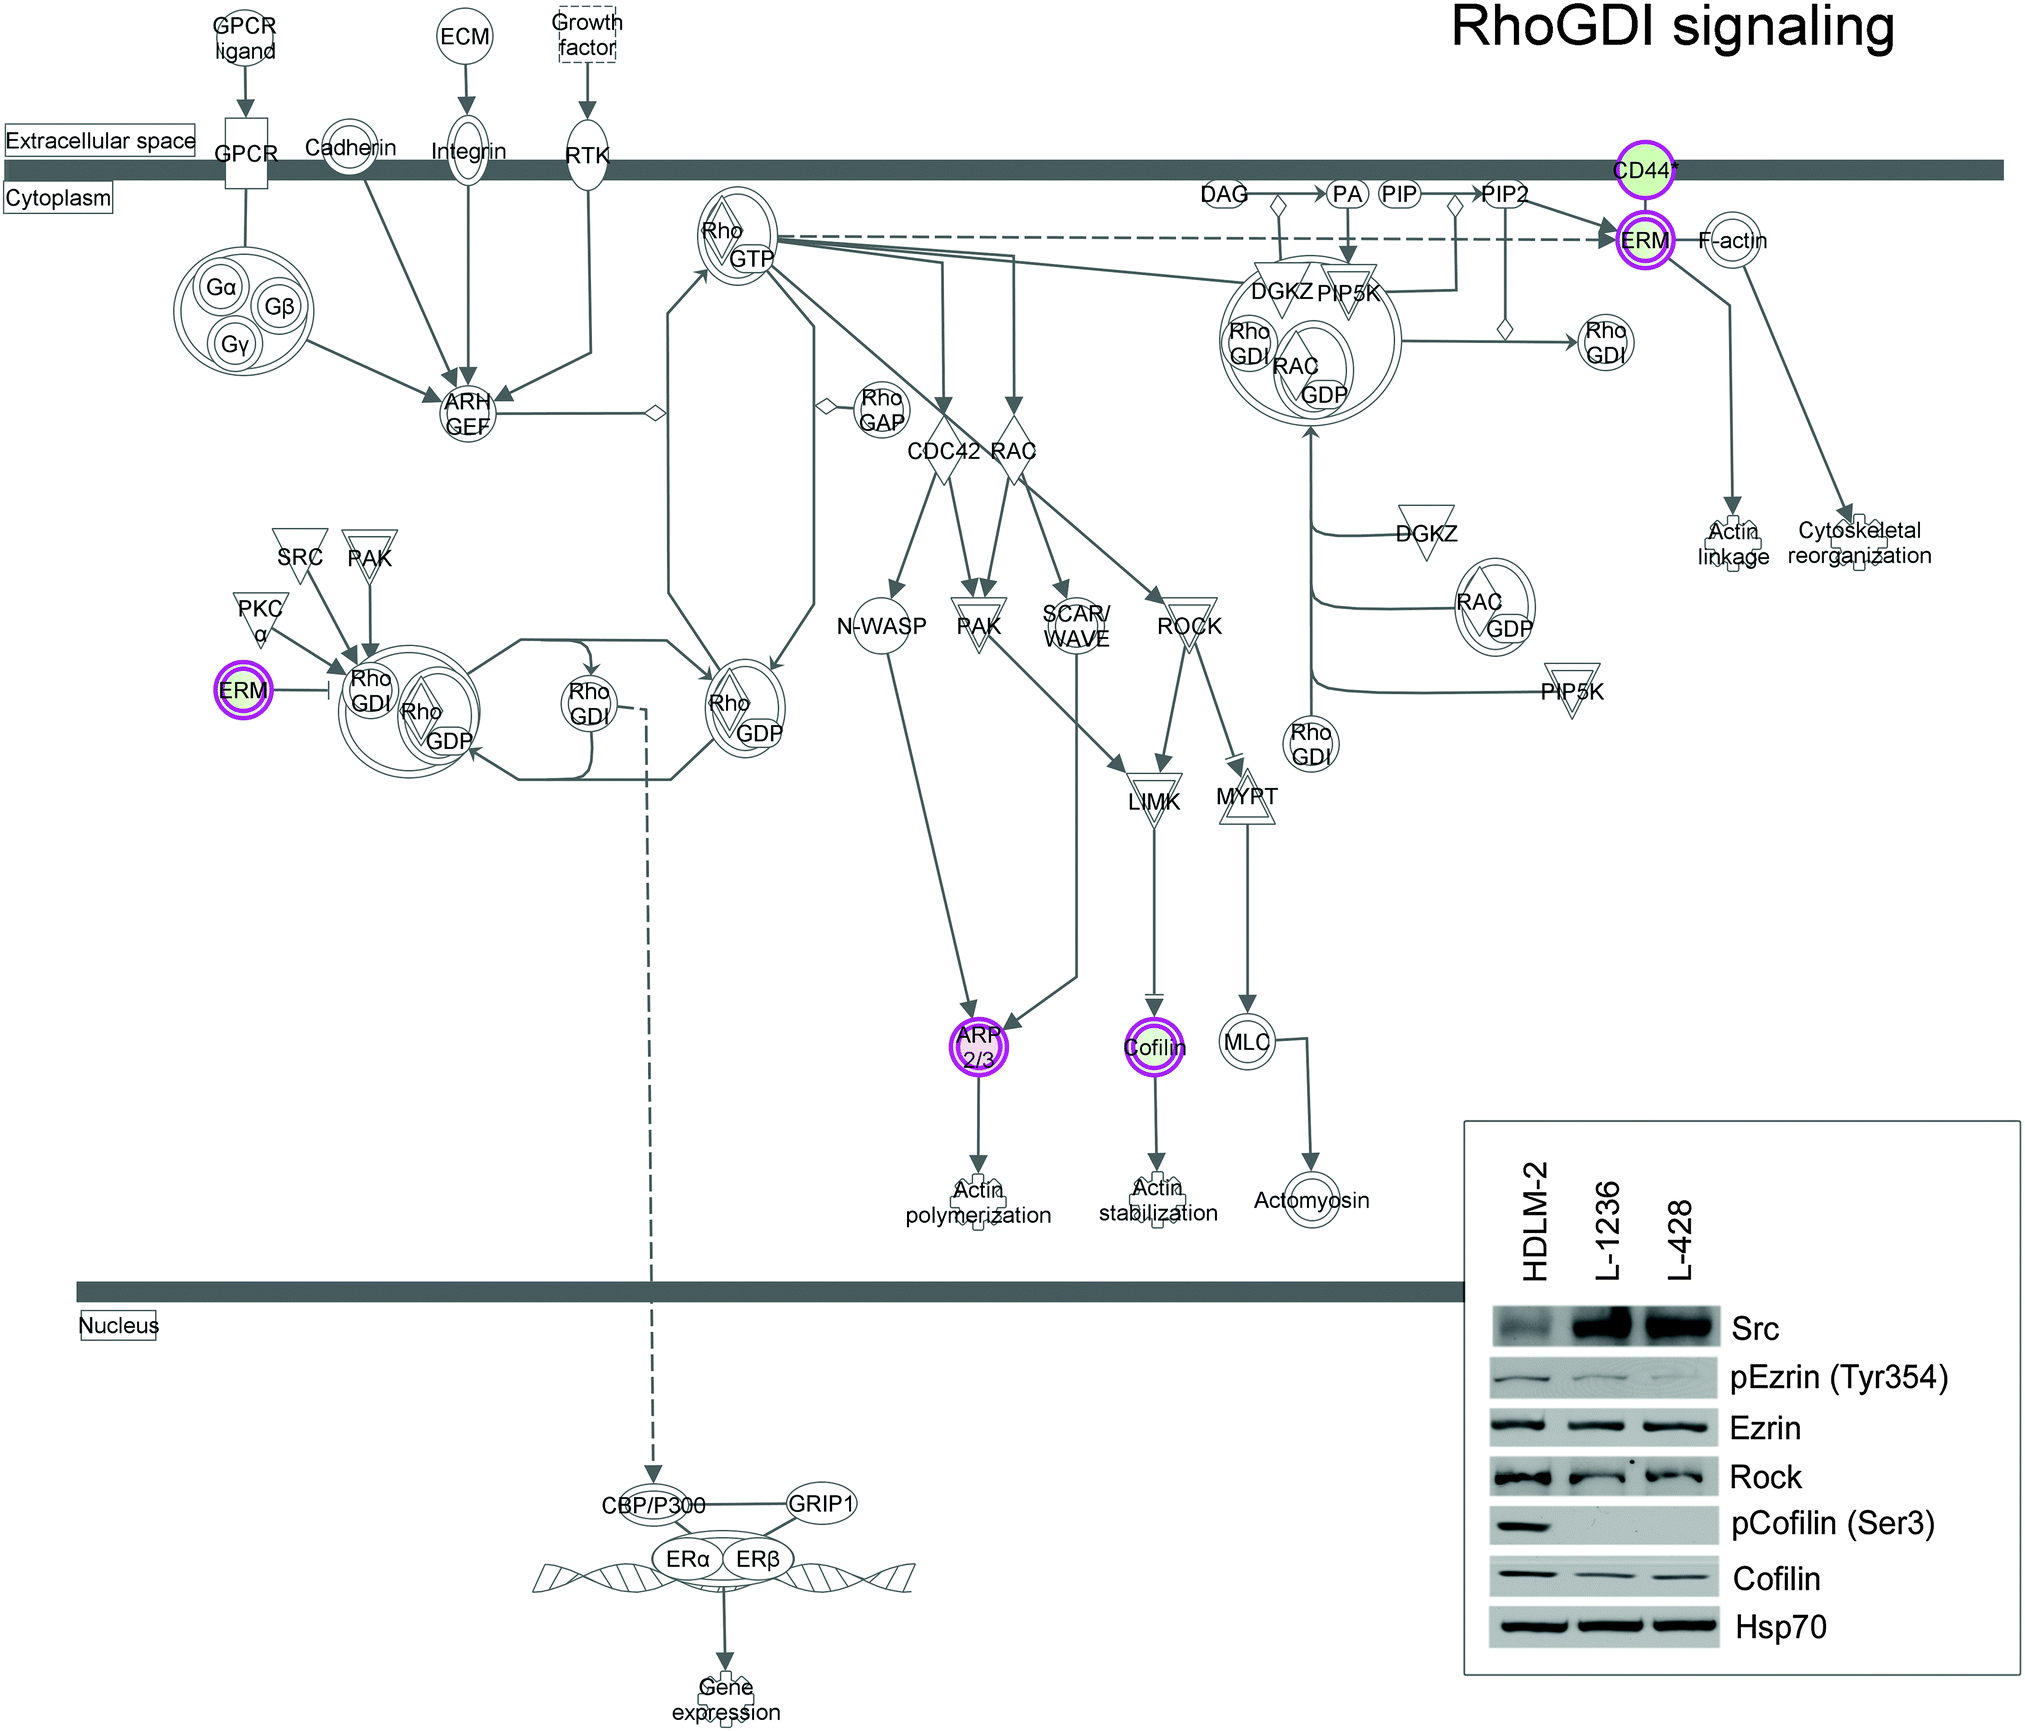 | ||
| Fig. 5 IPA graphic representation of the RhoGDI pathway. Colored spots represent proteins of our dataset, white symbols depict neighbouring genes in this analysis. Box highlights proteins that were further evaluated by western blot analysis. Expression was normalized to HSP70 and used as internal control. | ||
4. Conclusion
The ability to discriminate H/RS cells of B- and T-cell origin may represent an important requirement for the diagnosis and therapy of cHL. Although gene expression profiling analysis seems to support a common H/RS gene signature for B and T derived cHL cells,30 results of proteomics and flow cytometry analysis revealed that Hodgkin's cell lines are characterised by a different protein expression signature. MS-based proteomic approaches have been used in recent years in the search for potential cHL markers.32,33 Ma and colleagues analysed by LC-MS/MS the secretome of H/RS cells to identify a set of markers elevated in the plasma of cHL patients compared to healthy controls.32 Wallentine and collaborators compared the subcellular proteome of two cHL cell lines to identify possible candidates for the diagnosis and monitoring of the disease.33In the present work, our dataset confirms known proteins previously discovered by other studies, supporting the reliability of our approach, and describes novel ones. In particular, we highlight the possible role of proteasome, peroxiredoxins, and metabolism related proteins to differentiate cHL models. Moreover, the combination of flow cytometry limited one of the main problems associated with 2-DE analysis that is the isolation and the characterization of surface proteins. This uncovered the expression of membrane markers differentially expressed in HDLM-2 and L-1236 cells. Network analysis revealed how these markers are interconnected with the proteomic dataset and which molecules are potential regulators of these proteins, including hubs involved in transcriptional regulation or cytokine-mediated immune response.
In conclusion, the present work suggests that B- and T-cell derived H/RS cells have a different proteomic profile. The latter point could be considered as the basis for large screening in cHL samples.
Conflict of interest
The authors declare that there are no conflicts of interest.Author contributions
D. Vergara, P. Simeone, S. De Matteis, and S. Carloni performed the biochemical and flow cytometry assays; P. Simeone and D. Vergara performed the bioinformatics analysis; P. Lanuti, M. Marchisio, and R. Napolitano analysed and interpreted the flow cytometry data; D. Vergara and T. Rizzello performed 2D-PAGE and MS/MS assays; D. Vergara, P. Simeone, and S. De Matteis planned the study and co-wrote the paper; M. Maffia, S. Miscia, and C. Agostinelli directed the research activities and supervised the writing of the manuscript. All authors took part in discussion of the findings obtained and in the approval of the final version of the manuscript.Acknowledgements
We acknowledge Dr Antonio Danieli for technical assistance. We are grateful to the managers of ASL_LE, Dr Giovanni Gorgoni, Dr Antonio Sanguedolce, and Dr Vito Gigante for their support to the Lab of Clinical Proteomics. This work was supported by the PON project 254/Ric. “Implementation of human and environment health research center” cod. PONa3_00334, PONa3_00334 “Research Center for Environment and Human health”, PRIN 2010FPTBSH “NANO Molecular tEchnologies for Drug delivery – NANOMED”.References
- R. Küppers, A. Engert and M. Hansmann, J. Clin. Invest., 2012, 122, 3439–3447 CrossRef PubMed.
- K. J. Flavell and P. G. Murray, Mol. Pathol., 2000, 53, 262–269 CrossRef CAS PubMed.
- J. I. Martín-Subero, W. Klapper, A. Sotnikova, E. Callet-Bauchu, L. Harder, C. Bastard, R. Schmitz, S. Grohmann, J. Höppner, J. Riemke, T. F. Barth, F. Berger, H. W. Bernd, A. Claviez, S. Gesk, G. A. Frank, I. B. Kaplanskaya, P. Möller, R. M. Parwaresch, T. Rüdiger, H. Stein, R. Küppers, M. L. Hansmann and R. Siebert, Deutsche Krebshilfe Network Project Molecular Mechanisms in Malignant Lymphomas, Cancer Res., 2006, 66, 10332–10338 CrossRef PubMed.
- C. B. Hertel, X. G. Zhou, S. J. Hamilton-Dutoit and S. Junker, Oncogene, 2002, 21, 4908–4920 CrossRef CAS PubMed.
- I. Schwering, A. Bräuninger, U. Klein, B. Jungnickel, M. Tinguely, V. Diehl, M. L. Hansmann, R. Dalla-Favera, K. Rajewsky and R. Küppers, Blood, 2003, 101, 1505–1512 CrossRef CAS PubMed.
- S. Mathas, M. Janz, F. Hummel, M. Hummel, B. Wollert-Wulf, S. Lusatis, I. Anagnostopoulos, A. Lietz, M. Sigvardsson, F. Jundt, K. Jöhrens, K. Bommert, H. Stein and B. Dörken, Nat. Immunol., 2006, 7, 207–215 CrossRef CAS PubMed.
- F. Jundt, O. Acikgöz, S. H. Kwon, R. Schwarzer, I. Anagnostopoulos, B. Wiesner, S. Mathas, M. Hummel, H. Stein, H. M. Reichardt and B. Dörken, Leukemia, 2008, 22, 1587–1594 CrossRef CAS PubMed.
- J. J. Oudejans, J. A. Kummer, M. Jiwa, P. van der Valk, G. J. Ossenkoppele, P. M. Kluin, J. C. Kluin-Nelemans and C. J. Meijer, Am. J. Pathol., 1996, 148, 233–240 CAS.
- M. Müschen, K. Rajewsky, A. Bräuninger, A. S. Baur, J. J. Oudejans, A. Roers, M. L. Hansmann and R. Küppers, J. Exp. Med., 2000, 191, 387–394 CrossRef.
- G. Venkataraman, J. Y. Song, A. Tzankov, S. Dirnhofer, G. Heinze, M. Kohl, A. Traverse-Glehen, F. C. Eberle, J. C. Hanson, M. A. Raffeld, S. Pittaluga and E. S. Jaffe, Blood, 2013, 121, 1795–1804 CrossRef CAS PubMed.
- P. Lanuti, G. Rotta, C. Almici, G. Avvisati, A. Budillon, P. Doretto, N. Malara, M. Marini, A. Neva, P. Simeone, E. Di Gennaro, A. Leone, A. Falda, R. Tozzoli, C. Gregorj, M. Di Cerbo, V. Trunzo, V. Mollace, M. Marchisio and S. Miscia, Cytometry, Part A, 2015 DOI:10.1002/cyto.a.22730.
- D. Vergara, P. Simeone, D. Latorre, F. Cascione, S. Leporatti, M. Trerotola, A. M. Giudetti, L. Capobianco, P. Lunetti, A. Rizzello, R. Rinaldi, S. Alberti and M. Maffia, J. Biotechnol., 2015, 202, 3–11 CrossRef CAS PubMed.
- C. Lelong, M. Chevallet, S. Luche and T. Rabilloud, Methods Mol. Biol., 2009, 519, 339–350 CAS.
- D. Vergara, P. Simeone, P. del Boccio, C. Toto, D. Pieragostino, A. Tinelli, R. Acierno, S. Alberti, M. Salzet, G. Giannelli, P. Sacchetta and M. Maffia, Mol. BioSyst., 2013, 9, 1127–1138 RSC.
- J. Xia, E. E. Gill and R. E. Hancock, Nat. Protoc., 2015, 10, 823–844 CrossRef CAS PubMed.
- T. A. Rege and J. S. Hagood, Biochim. Biophys. Acta, 2006, 1763, 991–999 CrossRef CAS PubMed.
- W. Jian, L. Zhong, J. Wen, Y. Tang, B. Qiu, Z. Wu, J. Yan, X. Zhou and T. Zhao, PLoS One, 2015, 10, e0127568 Search PubMed.
- J. R. Fromm, Cytometry, Part B, 2011, 80, 91–99 CrossRef PubMed.
- S. R. Gross, Cell Adh. Migr., 2013, 7, 199–213 CrossRef PubMed.
- I. Schwering, A. Bräuninger, V. Distler, J. Jesdinsky, V. Diehl, M. L. Hansmann, K. Rajewsky and R. Küppers, Mol. Med., 2003, 9, 85–95 CAS.
- N. A. Bakshi, W. G. Finn, B. Schnitzer, R. Valdez and C. W. Ross, Arch. Pathol. Lab. Med., 2007, 131, 742–747 Search PubMed.
- M. Schneider, M. Szaumkessel, J. Richter, O. Ammerpohl, M. L. Hansmann, R. Küppers, R. Siebert and M. Giefing, Blood, 2014, 123, 3672–3674 CrossRef CAS PubMed.
- J. D. Spandrio Jr, E. A. Florea and U. Martinez-Outschoorn, Blood, 2013, 122, 2993 Search PubMed.
- K. S. Suh, T. Tanaka, S. Sarojini, G. Nightingale, R. Gharbaran, A. Pecora and A. Goy, Crit. Rev. Oncol. Hematol., 2013, 87, 306–322 CrossRef PubMed.
- A. R. Mato, T. Feldman and A. Goy, Oncologist, 2012, 17, 694–707 CrossRef CAS PubMed.
- U. Holtick, M. Vockerodt, D. Pinkert, N. Schoof, B. Stürzenhofecker, N. Kussebi, K. Lauber, S. Wesselborg, D. Löffler, F. Horn, L. Trümper and D. Kube, Leukemia, 2005, 19, 936–944 CrossRef CAS PubMed.
- B. F. Skinnider, A. J. Elia, R. D. Gascoyne, B. Patterson, L. Trumper, U. Kapp and T. W. Mak, Blood, 2002, 99, 618–626 CrossRef CAS PubMed.
- P. J. Jost and J. Ruland, Blood, 2007, 109, 2700–2707 CAS.
- P. Simeone, M. Trerotola, A. Urbanella, R. Lattanzio, D. Ciavardelli, F. Di Giuseppe, E. Eleuterio, M. Sulpizio, V. Eusebi, A. Pession, M. Piantelli and S. Alberti, PLoS One, 2014, 9, e103030 Search PubMed.
- R. Küppers, U. Klein, I. Schwering, V. Distler, A. Bräuninger, G. Cattoretti, Y. Tu, G. A. Stolovitzky, A. Califano, M. L. Hansmann and R. Dalla-Favera, J. Clin. Invest., 2003, 111, 529–537 Search PubMed.
- Y. Oji, N. Tatsumi, M. Fukuda, S. Nakatsuka, S. Aoyagi, E. Hirata, I. Nanchi, F. Fujiki, H. Nakajima, Y. Yamamoto, S. Shibata, M. Nakamura, K. Hasegawa, S. Takagi, I. Fukuda, T. Hoshikawa, Y. Murakami, M. Mori, M. Inoue, T. Naka, T. Tomonaga, Y. Shimizu, M. Nakagawa, J. Hasegawa, R. Nezu, H. Inohara, S. Izumoto, N. Nonomura, T. Yoshimine, M. Okumura, E. Morii, H. Maeda, S. Nishida, N. Hosen, A. Tsuboi, Y. Oka and H. Sugiyama, Int. J. Oncol., 2014, 44, 1461–1469 CAS.
- Y. Ma, L. Visser, H. Roelofsen, M. de Vries, A. Diepstra, G. van Imhoff, T. van der Wal, M. Luinge, G. Alvarez-Llamas, H. Vos, S. Poppema, R. Vonk and A. van den Berg, Blood, 2008, 111, 2339–2346 CrossRef CAS PubMed.
- J. C. Wallentine, K. K. Kim, C. E. Seiler 3rd, C. P. Vaughn, D. K. Crockett, S. R. Tripp, K. S. Elenitoba-Johnson and M. S. Lim, Lab. Invest., 2007, 87, 1113–1124 CrossRef CAS PubMed.
Footnote |
| † Electronic supplementary information (ESI) available. See DOI: 10.1039/c5mb00654f |
| This journal is © The Royal Society of Chemistry 2016 |