
Molecular simulation studies on the binding selectivity of 2-anilino-4-(thiazol-5-yl)-pyrimidines in complexes with CDK2 and CDK7†
Tahir Ali
Chohan
,
Hai-Yan
Qian
,
You-Lu
Pan
and
Jian-Zhong
Chen
*
College of Pharmaceutical Sciences, Zhejiang University, Hangzhou, Zhejiang 310058, China. E-mail: chjz@zju.edu.cn; Tel: +86-571-88208659
First published on 30th October 2015
Abstract
Cyclin dependent kinase 2 (CDK2) was regarded as a potentially therapeutic target for cancer therapy. Since the CDK family includes couples of high homology members, designing CDK2-selective inhibitors would provide valuable opportunities for the development of anticancer drugs with optimal efficacy. In this study, three thiazo-5-yl-pyrimidines as CDK2 inhibitors with different selectivity over cyclin dependent kinase 7 (CDK7) were examined to study the selectivity mechanism using a combined approach of computational techniques of flexible docking, EasyMIFs, molecular electrostatic potential (MESP), natural bond orbital (NBO), molecular dynamics (MD) simulations, and binding free energy calculations. Molecular simulations elicited new chemical insights into steric and electronic complementarities of these molecules to the binding sites of CDK2 and CDK7. The computed binding free energies were consistent with the ranking of their experimental binding affinities on CDK2 and CDK7. We also conducted in silico mutations of three key amino acids (CDK2: Gln85, Lys89, Asp145) to examine their impact on ligand binding with MD simulations and binding free energy calculations. The results indicated that these residues exhibited a strong tendency to mediate ligand–protein interactions through the H-bond and vdW interaction with CDK2-selective inhibitor. The present work may provide a better structural understanding of the molecular mechanism of CDK2 selective inhibition. The new computational insights presented in this study are expected to be valuable for the guidelines and development of new potent CDK2 inhibitors.
Introduction
Kinases have emerged as one of the most widely studied classes of drug targets because of their pivotal roles in governing various critical cellular events.1 Cyclin-dependent kinases (CDKs) have been identified as a family of heterodimeric serine-threonine protein kinases.2,3 Based on their functionalities, CDKs are further divided into two non-overlapping groups, cell-cycle CDKs and transcriptional CDKs.4 Because of its significant roles in regulating cell-cycle transition and progression,2,3,5 even a minor misregulation of a CDK may directly lead to cancer.6CDK2 is one of the most extensively studied members of the CDK family.7,8 It is dedicated to cell-division control. CDK2 is along with its regulatory partner cyclin E/A to facilitate the transition of the cell-cycle from G1 to S and G2 phases by sequentially inducing the phosphorylation of pRB (retinoblastoma protein).5,6 Inappropriate expression of CDK2 may cause abnormal regulation of the cell-cycle, which has been found in various malignancies, like lung carcinoma, melanoma, osteosarcoma, ovarian carcinoma, pancreatic carcinoma, and sarcomas.6,9 Therefore, development of CDK2-selective inhibitors would be valuable in achieving meaningful therapeutic effects without serious adverse effects. On the other hand, it is typically a challenging task to develop selective ligands for a given CDK since the CDK family includes highly homology cyclin-dependent kinases.10
CDK7 is a unique member of CDK family due to its dual functions in cell-division control and transcription.10 It takes part in cell-cycle control to regulate the activation of other CDKs by phosphorylating the T-loop within the activation segment, and it also assists in the regulation of transcription as a component of the general transcription factor II H (TFIIH) complex. The inhibition of CDK7 may induce to block transcription and cell cycle progression. As a member of CDK family, CDK7 shares high structural homology with CDK2. Thus, a deep understanding of molecular mechanism of ligand-specific recognitions towards CDK2 and CDK7, respectively, and kinetics of ligand–receptor interactions may be implicated as an important knowledge in the rational design of isoform selective inhibitors.
To date, several inhibitors have been identified with optimal selectivity for CDK2 relative to CDK4/6.11–15 However, CDK7 inhibition tracks closely with that of CDK2 due to high similarity in their ligand-binding pockets, and only a few inhibitors have achieved selectivity beyond 30-fold for CDK2 against CDK7. Recently, 2-anilino-4-(thiazol-5-yl)-pyrimidines were developed to be highly potent inhibitors with more than 100 folds selectivity for CDK2 relative to CDK7.16 This unique selectivity pattern of inhibitors may provide us an opportunity to uncover the molecular mechanism of ligand selectivity for CDK2 versus CDK7.
It has been previously attempted to explore the possible mechanism of ligand selectivity in CDKs by applying empirical scoring functions, structure-based molecular modeling and knowledge-based graphical analyses approaches.17–19 A comprehensive structure based pharmacophore model enclosing seven pharmacophore features was reported for CDK2.20 As reported, Leu83 of CDK2 was ranked as the most frequently occurring hydrogen bond acceptor feature (91.94–75.00% probability), while residues Ile10, Phe82 and Gln85 were suggested to compose a critical hydrophobic region for ligand binding. It has also been proposed that a H-bond interaction network formed among residues Lys89, Asp86, and Ile10 would efficiently contribute in determining selectivity of CDK2 inhibitors.21 In addition, it was suggested that a good binding free energy for CDK2 selective inhibitor against CDK1 would be favored by a H-bond interaction with the backbone atom of Leu83.22 By comparing ATP binding sites of CDK2 and CDK7, the residue Lys89 of CDK2 was found to be aligned with Val100 of CDK7.10 Such a variation in the binding sites of CDK2 and CDK7 may provide a means for designing CDK2 selective inhibitors against CDK7. Besides, the hydrophobic pocket constituted by Thr96 (Gln85 in CDK2) and Pro310 of CDK7 may offer an opportunity for designing CDK7 selective inhibitors. However, inadequate knowledge of structural basis of energetic interactions upon ligand binding receptor is a barrier in the development of isoform specific ligand.
The present study was undertaken to explore the molecular mechanism of the selective binding of inhibitors on CDK2 and CDK7. Three 2-anilino-4-(thiazol-5-yl)-pyrimidines, CP1, CP2, and CP3 (Fig. 1), were scrutinized based on their selectivity for CDK2 against CDK7.16 CP1 and CP2 are highly (900-fold) and moderately (70-fold) selective inhibitors, respectively, for CDK2 over CDK7. Whereas, CP3 demonstrates completely opposite CDK-binding preferences to have 65-fold more selectivity for CDK7 against CDK2, while it differs from CP1 only by the replacement of sulfonamide group with a piperazine ring. Such results motivated us to investigate the molecular basis of selectivity of 2-anilino-4-(thiazol-5-yl)-pyrimidines binding to CDK2 and CDK7 with high homology structures using computational techniques. Moreover, a comparative analysis of wild-type versus three mutants with in silico mutations at positions of Gln85, Lys89, and Asp145, respectively, of CDK2 was performed through MD simulations to get deeper insight into the molecular mechanism for CDK2 inhibition.
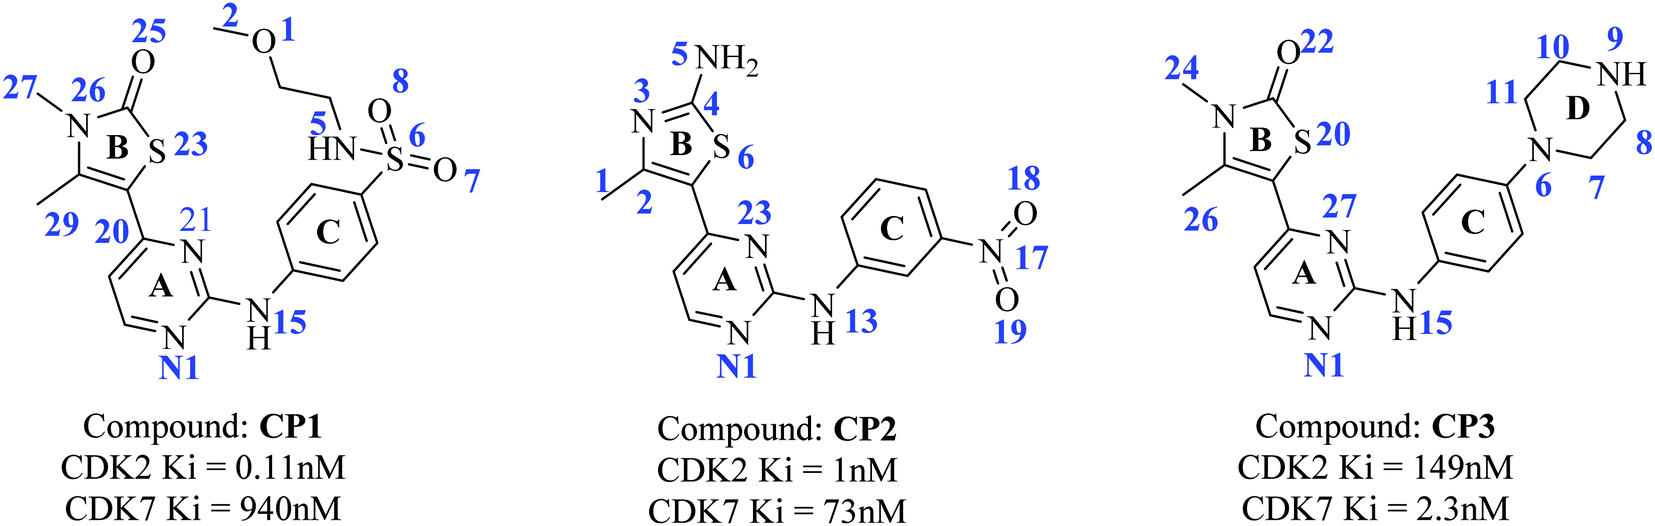 | ||
| Fig. 1 Structures of 2-anilino-4-(thiazol-5-yl)-pyrimidine based CDK2 and CDK7 inhibitors, CP1, CP2, and CP3. | ||
Molecular docking is a simple, fast, and effective molecular modeling method to predict the active conformation of a ligand in the active site of its target protein and to estimate the binding affinity between the ligand and protein with docking score. However, docking scores are not accurate enough to distinguish ligands on the basis of their selectivity. Therefore, docking results have always been post processed by more reliable methods like molecular dynamics (MD) simulations approach, which treats ligand–receptor complex flexibly and firmly, to describe the dynamical behavior of the complex at atomic-level. In addition, it calculates binding free energies using implicit MMGB(PB)SA model to provides an accurate ranking of potential ligands binding to the target protein. In this study, we used a unique combination of computational techniques such as, molecular docking, EasyMIFS, structure based pharmacophore modeling, ligand based MESP maps, and MD simulations, to elucidate the basis for achieving selectivity through interpretation of ligand-by-residue interactions which give rise to different binding affinities of inhibitors for CDK2 and CDK7.
Computational details
Initial processing of protein structure
The co-crystallized structures of CDK2 with each of ligands CP1, CP2, and CP3 (PDB ID: 2XMY, 2XNB12,16 and 1PXO,16 respectively) and CDK7 bound with ATP (PDB ID: 1UA210) were downloaded from RCSB Protein Data Bank (PDB) to be regarded as starting points for molecular simulations. Each of three ligands CP1, CP2, and CP3 was extracted from co-crystal structure of the respective complex with CDK2 to get an initial conformation of each ligand. All complexes were analyzed to authenticate the chemical accuracy using structure preparation tools in biopolymer module of SYBYL-X 1.3.23 Missing hydrogen atoms were computationally added. Atom types were assigned appropriately and atomic charges were applied according to AMBER 7 FF99 force field. Finally, the energy of each complex was minimized to avoid steric clashes using the Powell algorithm with a convergence gradient of 0.5 kcal (mol Å)−1 for 1000 cycles, while keeping backbone atoms fixed. In addition, three different in silico mutants of CDK2, named as Q85T, K89L, and D145A, were generated by replacing Gln85, Lys89, and Asp145, respectively, with a desired amino acid based on the co-crystal structure of the complex CP1–CDK2 using Biopolymer module of SYBYL-X 1.3.23 The treated structures of these three CDK2 mutants were further optimized following the procedure described above.The initial structural models of complexes CP1–CDK7, CP2–CDK7, and CP3–CDK7 were generated based on the crystal structure of CDK7 using SYBYL-X 1.3.23 By taking advantage of highly conserved residues around binding sites of CDK2 and CDK7, the crystal structure of CDK7 was first superimposed over the co-crystal structure of CDK2 bound with either CP1, CP2, or CP3 by aligning the coordinates of backbone atoms of conserved residues, like Val18 (Val26), Ala31 (Ala39), Lys33 (Lys41), Phe80 (Phe94), Phe82 (Phe93), Asp86 (Asp97), Leu134 (Leu144) and Asp145 (Asp155), around binding pockets of CDK2 and CDK7. Each inhibitor was then extracted from its complex with CDK2 and merged into CDK7 to produce an initial structural model of the complex CP1–CDK7, CP2–CDK7, or CP3–CDK7.
In order to predict more possible interaction modes of each inhibitor binding to CDK7, flexible docking simulations were performed based on each of above-generated structural models of CP1–CDK7, CP2–CDK7, and CP3–CDK7 by using the Surflex-Dock module of SybylX-1.3.23 For such a purpose, the resulting primary conformation of each inhibitor in CDK7 was used as a starting position for the protomol generation (an idealized active site) to define the potential binding pocket which can be used as a target to produce several putative poses of ligand. These putative poses of ligand were ranked using the Hammerhead scoring function.24,25 Parameters determining the extent of protomol were kept at default (threshold = 0.50 and bloat = 0). CScore (Consensus Score) calculations were enabled on all Surflex-docking runs and all other parameters were kept at default settings. Either CP1, CP2, or CP3 was then docked in the idealized active site of CDK7 with “whole” molecular alignment algorism,26 and twenty best docked poses were finally saved for each inhibitor. To examine the effects of the above-mentioned single mutation of CDK2 on receptor–ligand interaction mode, flexible docking simulations were also carried out for CP1 in the binding site of each CDK2 mutant (Q85T, K89L, or D145A) using the same protocol.
Binding site comparisons
To distinguish the interaction mode differences of an inhibitor binding to homologous CDK isoforms with apparently similar binding sites would be a valuable knowledge of understanding the selective mechanism underlying the ligand binding to different CDKs. In order to categorize the ligand binding pocket into sub-regions characterized by their properties, preliminary binding site analyses were performed on co-crystal structures of CDK2–ATP and CDK7–ATP (PDB ID: 1JST and 1UA210) on a web server SiteComp.27 SiteComp uses molecular interaction fields (MIFs) calculated by EasyMIF28 to dissect the ligand binding pocket of target protein into a collection of potential small molecule binding volumes. The MIF calculations were carried out for binding site comparison and characterization using methyl carbon (CMET) probes, which are parameterized to mimic the drug-like molecules.29 Since CDKs were known to possess an elongated ligand binding site the single-linkage clustering algorithm28 was applied to yield the better coverage of the binding site in CDK2 or CDK7. The residues surrounding the binding pocket were mapped using a three-dimensional orthogonal grid. The region that binds a largest cluster of CMET probe would be identified as a favorable region for drug-like molecules.Molecular electrostatic potential (MESP) analysis
The binding conformations of all three ligands CP1, CP2, and CP3, extracted from the co-crystal structures of their complexes with CDK2, were applied for density functional theory (DFT) calculations using Gaussian 0930 program package. Complete geometries of ligands were optimized by applying B3LYP method with a 6-31g(d,p) basis set.31,32 In order to mimic physiological environmental conditions, all calculations were performed in an aqueous environment with the CPCM model.33,34 Furthermore, HOMO–LUMO analyses and dipole moment and natural bonding orbital (NBO) calculations were also performed using the Gaussian 09 package at aforementioned level of theory.35 The MESP iso-energy surface maps were generated by superimposing a color coded iso-potential surface on the iso-electron density surface (0.0004 e au−3). These color-coded iso-surfaces provided a measure of the overall molecular size and positive or negative electrostatic potential distribution. Different colors at the molecular surface represented different values of electrostatic potential, i.e. deep-red color characterizing the most negative electrostatic potential region with highest electron density and deep-blue color embodying the most positive electrostatic potential domain with lowest electron density. The areas with moderate range of reactivity (Fig. 3A–L) are shown in intermediate shades with colors of cyan, yellow, and green.Molecular dynamics simulations
Each of the above generated structures of the complexes CP1–CDK2, CP2–CDK2, CP3–CDK2, CP1–Q85T, CP1–K89L, CP1–D145A, CP1–CDK7, CP2–CDK7, and CP3–CDK7 was subjected to MD simulations for further stabilization and refinement. All MD simulations were performed for each complex in a solvation system using SANDER module in AMBER12 software package.36 The missing hydrogens of protein were first added using LEaP program from AMBER12.37 Each complex was solvated in a periodic truncated octahedron box of TIP3P38 water molecules with a margin distance of 10 Å. The produced solvation system was then neutralized by replacing some of water molecules with Cl− or Na+ counterions by LEaP protocol. The force field parameters for each protein–ligand complex were assigned using the AMBER ff99SB force field39 for the protein and general AMBER force field40 (GAFF together with RESP charges) for the ligand. Each system was relaxed by executing three consecutive steps of energy minimization prior to MD simulations in order to prevent any steric conflict that might occur during system setup. At first, all counterions (Cl− or Na+) and water molecules were optimized, while both protein and ligand were kept frozen. During second step of minimization, side chains of residues were relaxed while backbone heavy atoms were restrained with a constraint force of 5.0 kcal (mol Å2)−1. Finally, unconstrained structural optimizations were performed on the whole system during third stage. In each step, energy was minimized using 2500 steps of the steepest descent followed by 5000 steps of conjugate gradient method. After relaxation, the system temperature was gradually increased in an NVT ensemble from 0 to 300 K for 100 ps and maintained at this point. The Langevin dynamics41 was applied on the system with a collision frequency of 1 ps−1 and the force constant was set to 10 kcal (mol Å2)−1. By keeping in view of the system stability, eight additional steps of MD equilibrations were performed for each system in a time of 100 ps per step and temperature maintained at 300 K along with gradually descending restraint weights: 10, 8, 5, 3, 2, 1, 0.5, and 0.1 kcal (mol Å2)−1. Lastly, the system was subjected to run MD simulations for 40 ns using NPT ensemble with the constant temperature of 300 K and pressure of 1 atm. The 2 fs time integration step along with SHAKE algorithm42 was used to constrain all bonds containing hydrogen atoms. Electrostatic interactions were calculated by using particle-mesh-Ewald (PME)43 method and the cutoff was set as 10 Å to treat non-bonded interactions. Coordinates of MD simulation trajectories were stored at every 1 ps during equilibration runs and 2 ps during MD production runs. All analyses of MD simulations were performed using the CARNAL, ANAL, and PTRAJ modules of AMBER12 software package.Free energy calculations
Molecular mechanics (MM) based scoring methods MM/PB(GB)SA,36,44 implemented in AMBER 12, were used to calculate binding free energies (ΔGbind) of 2-anilino-4-(thiazol-5-yl)-pyrimidines binding to CDK2 (wild or mutants) and CDK7. The computations were performed based on a total of 1000 snapshots for each complex, taken from the last 2 ns stable MD trajectory at 2 ps intervals. At first, the representative sets of equilibrium confirmations for each complex, target protein, and bounded ligand were separately prepared, and the binding free energy was calculated as a difference between the total free energy (ΔGcom) of ligand–receptor complex and the sum of free energy of individual receptor (ΔGpro) and ligand (ΔGlig) using the equation described below:| ΔGbind = ΔH − TΔS = ΔGcom − (ΔGpro + ΔGlig) | (1) |
| ΔG = ΔEMM + ΔGsol − TΔS | (2) |
| ΔEMM = ΔEint + ΔEvdW + ΔEele | (3) |
| ΔGsol = ΔGele,sol PB(GB) + ΔGnonpol,sol | (4) |
| ΔGnonpol,sol = γSASA + b | (5) |
The analyses of entropy contributions were carried out on forty snapshots, extracted from the last 2 ns of MD trajectories. It can be determined from the equation mention below:
| TΔS = T (ΔStrans + ΔSrot + ΔSvib). | (6) |
![[thin space (1/6-em)]](https://www.rsc.org/images/entities/char_2009.gif) 000 steps) with a distance-dependent dielectric constant, ε = 4r, and convergence tolerance tighter than RMS = 1.0 × 10⁻⁴ kcal (mol Å)−1. Entropic contributions TΔS (translation, rotation, and vibration) to a ligand binding to its receptor were then calculated by using the Nmode module of AMBER12.50 Based on reported Ki values, the experimental binding free energy51 was calculated using the following equation,
000 steps) with a distance-dependent dielectric constant, ε = 4r, and convergence tolerance tighter than RMS = 1.0 × 10⁻⁴ kcal (mol Å)−1. Entropic contributions TΔS (translation, rotation, and vibration) to a ligand binding to its receptor were then calculated by using the Nmode module of AMBER12.50 Based on reported Ki values, the experimental binding free energy51 was calculated using the following equation,| ΔGexp ≈ −RTlnKi | (7) |
Per-residue free energy decomposition analysis
MM/GBSA free energy decomposition program in AMBER1236,44 was applied to get meaningful insight towards contributions of key residues responsible for ligand protein binding. The ligand–receptor interaction term can be further described into insightful components, vdW (ΔGvdW), electrostatic (ΔGele), polar (ΔGele,sol), and non-polar (ΔGnonpol,sol) contributions,| ΔGinhibitor_residue = ΔGvdW + ΔGele + ΔGele,sol + ΔGnonpol,sol | (8) |
Results and discussion
Molecular docking
In order to validate our flexible docking approach, docking simulations were first carried out for CP1 in the binding site of CDK2 using Sybyl X1.3/Surflex Dock method. By superimposing the docking-simulated model and the co-crystal structure of CP1–CDK2 (Fig. S1A in the ESI†), it was found that the docked pose of CP1 in CDK2 was almost overlapped to its crystallographic pose with a root-mean-square deviation (RMSD) value less than 0.63 Å (Fig. S1D in the ESI†).Furthermore, it was also shown that both CP1 and CP3 acquire similar conformations in CDK2 binding site by comparing the docking-simulated binding mode of CP1 in CDK2 with the experimental binding mode of CP3 in CDK2 (Fig. S1B in the ESI†). Therefore, our docking procedure was verified to be reliable. On the other hand, the superior inhibitory activity of CP1 was contributed by an additional hydrogen bond formed between sulfonamide group of CP1 and Lys89 of CDK2. In addition, the interaction of ligand with the hinge region of CDK2 is highly conserved among all co-crystal structures of CP1, CP2, and CP3 binding to CDK2. All three inhibitors may precisely accept a H-bond interaction from the backbone amide of Leu83 and donate H-bond hydrogen to the backbone carbonyl of this residue. Besides, the C-ring (Fig. 1) of three inhibitors is nested in a small hydrophobic cavity composed of residues Lys33, Phe80, Ala144, and Asp145 of CDK2.
Since no co-crystal structures of the complexes CP1–CDK7, CP2–CDK7, and CP3–CK7 were reported, flexible docking simulations of either CP1, CP2, or CP3 binding to CDK7 were first carried out to get initially structural model of corresponding complex for exploration of ligand–protein interactions with SYBYL/Surflex Dock method.25 The top ranked poses of each ligand binding to CDK7 were selected based on CScore values, which were graphically visualized using MOLCAD of SYBYL-X to analyze ligand–protein interactions and to inspect whether the docked ligands are in correct orientation. The docking results suggested that each compound binding to CDK7 attained a geometrical conformation similar to its experimentally determined conformation in the corresponding co-crystal structure with CDK2. These docking results were expected because of high sequence identity of the active sites between CDK2 and CDK7. Superimpositions of docking-simulated models (Fig. S1C in the ESI†) showed that all three 2-anilino-4-(thiazol-5-yl)-pyrimidines were able to establish H-bond interactions with the backbone NH and CO groups of Met94, located at a so-called hinge segment of CDK7. The substituted B-ring (Fig. 1) of these compounds lies in a shallow cavity composed of residues Lys41, Phe91, Asp155, and Phe156 of CDK7, and their pyrimidine core overlapping at the center of the binding site makes hydrophobic contacts with top and bottom residues, i.e. Leu18, Gly19, Val26, Ala39, and Leu144 of CDK7. The C-ring of each ligand approaches to a solvent exposed area of the binding site which is predominantly surrounded by residues Glu20, Thr96, Asp97, Glu99, Val100, Lys139, Pro140, and Asn141 of CDK7. The most CDK7-active inhibitor CP3 exhibits its bulky piperazine moiety (D ring) to have vdW and hydrophobic contacts with residues Thr96, Asp97, and Val100 of CDK7.
In addition, it was observed that both CP1 and CP2 might have H-bond interactions with Lys89 in CDK2 but not with the aligned residue Val100 in CDK7 by superimposing the docking-simulated structural model of CP1–CDK7 or CP2–CDK7 with the co-crystal structure of CP1–CDK2 or CP2–CDK2. In fact, it was found that other CDKs, like CDK1, CDK3, and CDK4, which belong to the same subfamily of CDK2, also have hydrophilic residue Lys (CDK1 and CDK3) or Thr (CDK4) in the same position of CDK2 Lys89 by multiple sequence alignments (Fig. S2 in the ESI†). Therefore, the hydrophilic residue in the position of CDK2 Lys89 may also be a key residue to design selective ligands for CDK1, CDK3, or CDK4 against CDK7.
Binding site comparison
Selectivity of an inhibitor may be determined by a minor spatial variation in residues enclosing binding sites of homology proteins. Based on the results from our docking simulations, there are quite similar binding pockets between CDK2 and CDK7. It would be necessary to compare the binding sites of CDK2 and CDK7 based on their crystal structures. Binding site comparisons of CDK2 and CDK7 were performed with molecular interaction fields implemented in SiteComp. Previous research has suggested that vdW and non-polar interactions would play dominant roles in the binding of CDK2-selective inhibitor.22 Thus, SiteComp was applied to map the ligand binding surface of both CDKs using CMET probes. CMET probe is hydrophobic in nature and it has been previously validated to identify ligand recognition regions with the highest total hydrophobic and vdW interaction energy.28 The highly favorable regions for drug-like molecules within the active sites of CDK2 and CDK7 are depicted in Fig. 2. The top three ranking clusters of methyl (CMET) probes along with total energies and binding site volumes are tabulated in Table S2 in the ESI.†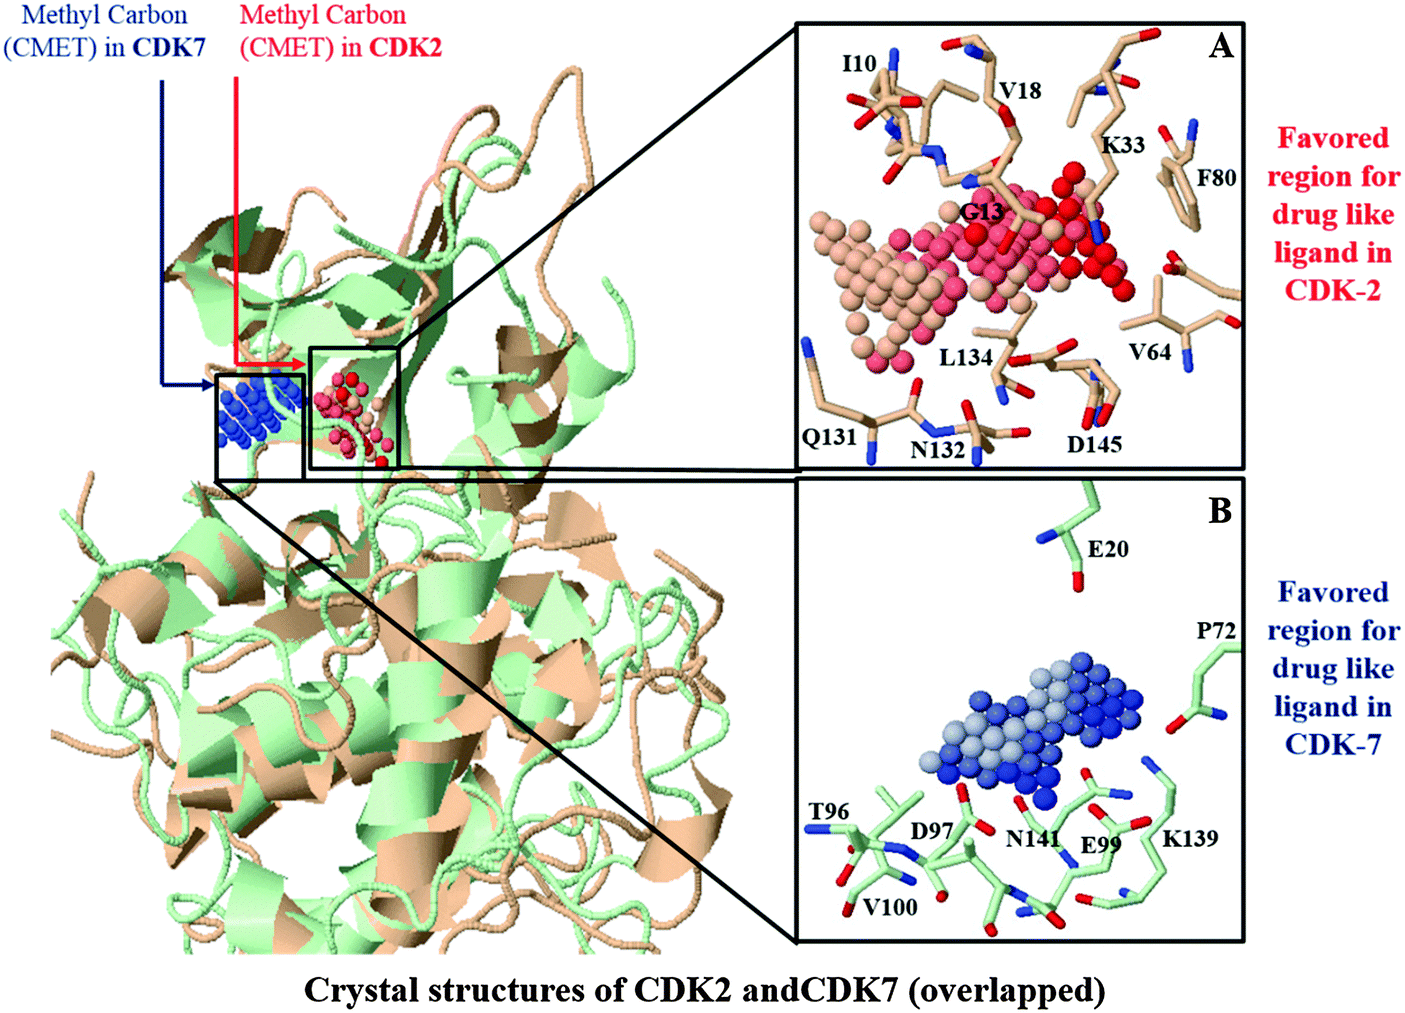 | ||
| Fig. 2 Comparison of the ligand binding site in X-ray structures of CDK2 (red) and CDK7 (blue). Dark color of probe indicates the strong interaction with corresponding residue: (A) top cluster of methyl (CMET) probe of SiteComp are shown as red spheres accumulated in a shallow hydrophobic pocket of CDK2. The residues constituting the binding site are shown as sticks, (B) top cluster of methyl (CMET) probe accumulated in a binding pocket of CDK7 are shown as blue spheres and the residues constituting the binding site are shown as sticks. | ||
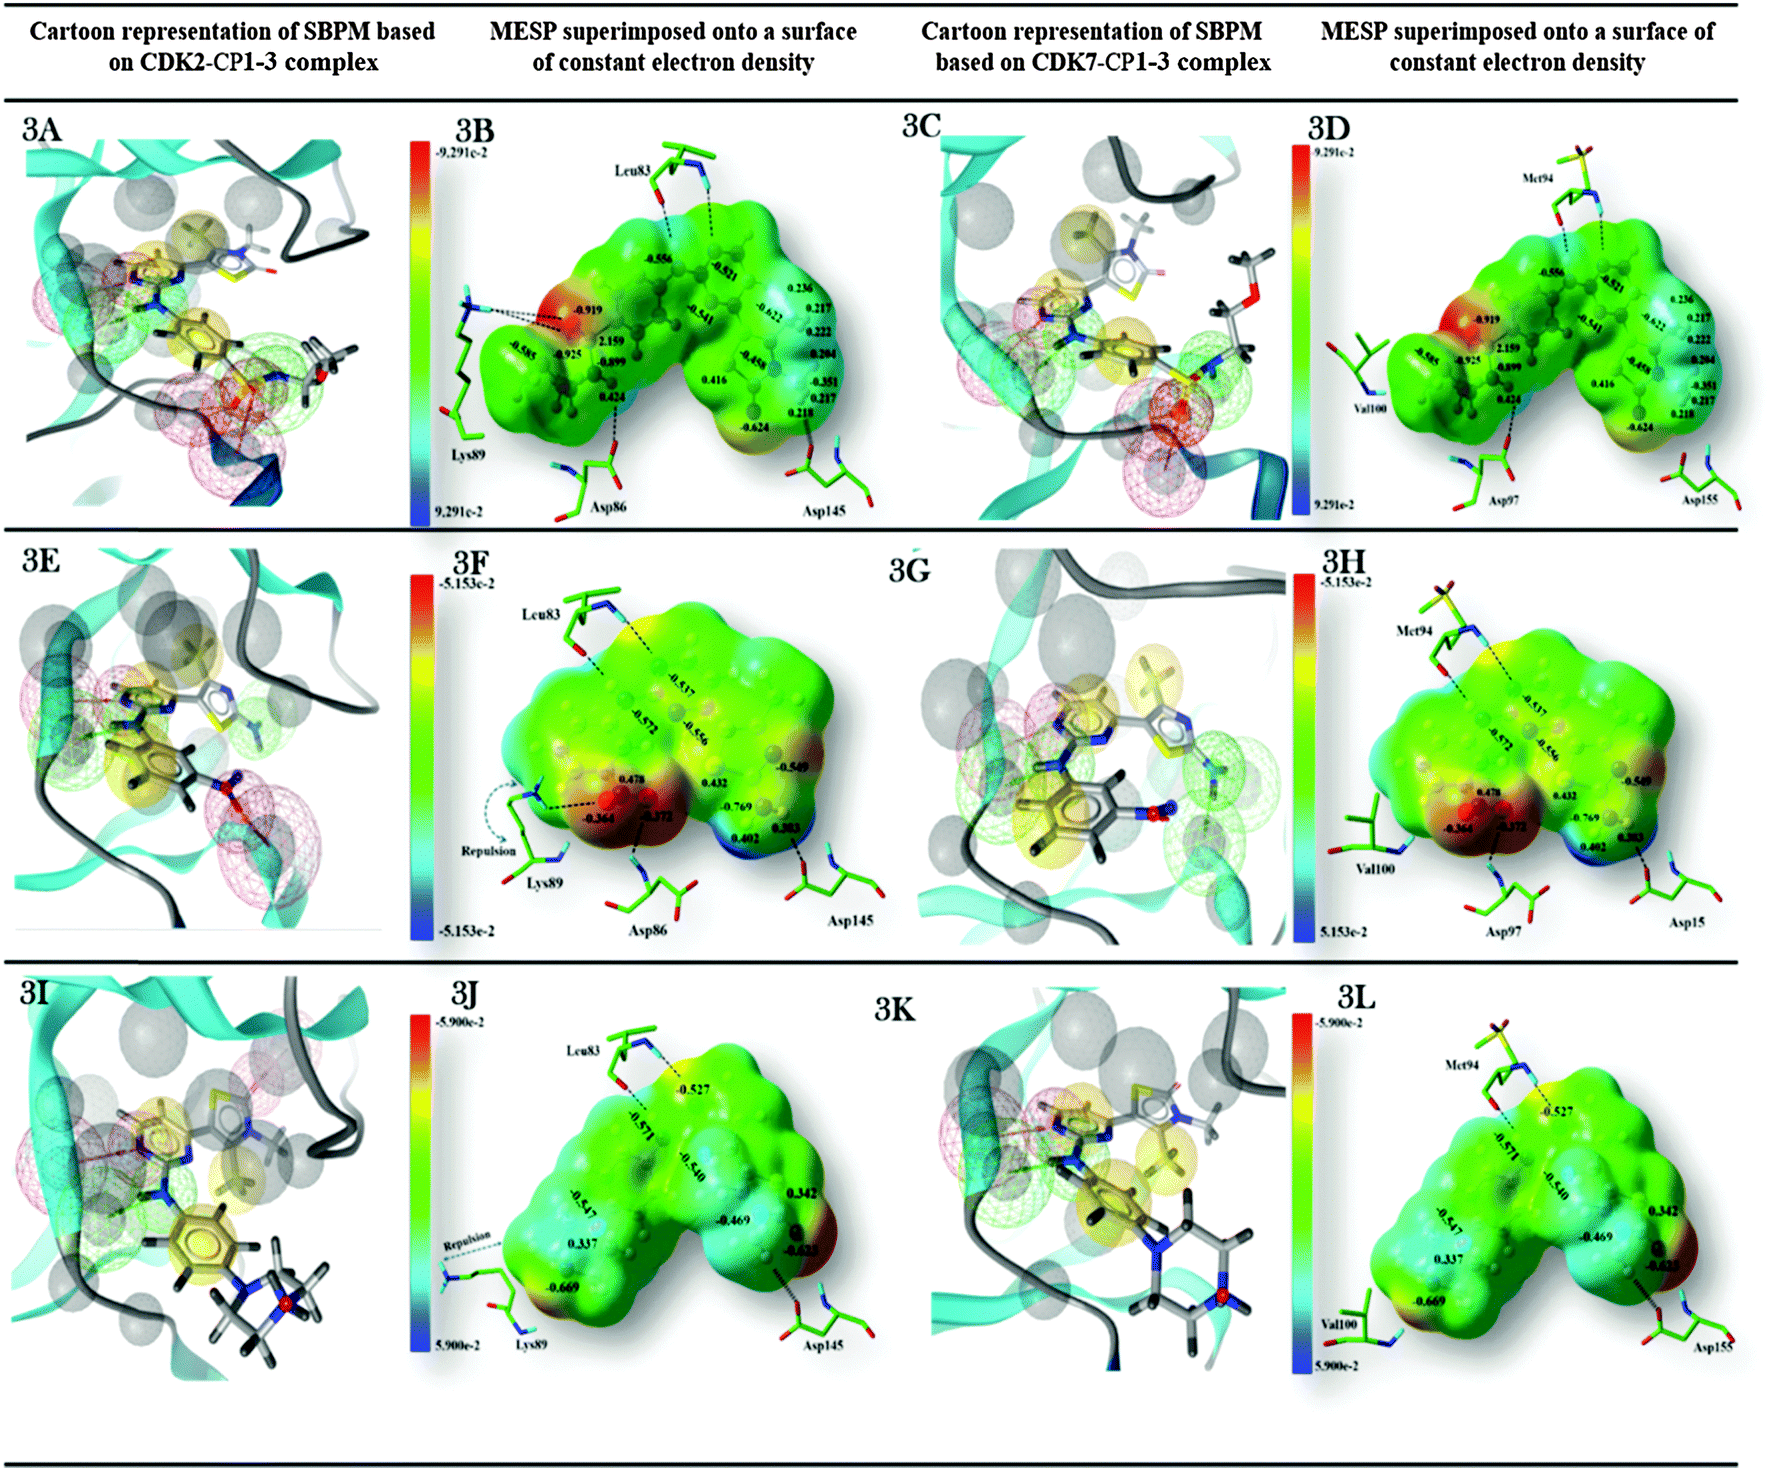 | ||
| Fig. 3 Comparison of the physicochemical properties of protein with electrostatic potential of ligands for CDK2 and CDK7 (A–D) CP1, (E–H) CP2, (I–L) CP3. Dark red color represents strongest electronegative region, dark blue color indicates the strongest electropositive region whereas the regions with green color indicates the potential halfway between the two strongly electropositive and negative regions and has zero potential. | ||
Fig. 2A shows that the most favorable region for accommodating methyl-like ligands is predominantly surrounded by residues Ile10, Gly11, Gly13, Val18, Lys33, Val64, Phe80, Gln131, Asn132, Ala44, and Asp145 of CDK2 with a total interaction energy of −1622.967 kcal mol−1. These residues actually surround a so-called Phe80-pocket, which has been known for CDK2 to have good vdW and non-polar interactions with an active ligand.22 The region containing largest cluster of CMET-probes in CDK7 (Fig. 2B) is mainly composed of residues Glu20, Thr96, Asp97, Glu99, Val100, Lys139, Pro140, and Asn141 of CDK7 to represent the favorable region for methyl-like ligands with a total interaction energy of −955.828 kcal mol−1. By superimposing binding sites of CDK2 and CDK7, it was revealed that the hydrophobic residue Val100 of CDK7 was aligned with the hydrophilic residue Lys89 of CDK2. Such a difference along with other changes in the region, like Thr96 of CDK7 in place of Gln85 of CDK2 and an additional residue Pro310 of CDK7, makes a pocket with superior hydrophobic character in CDK7 than CDK2. This may rationalize the favorable accumulation of CMET cluster in the corresponding region. Encouragingly, available experimental data10,20 also provided evidence for remarkable participation of these residues in mediation of strong interactions with CDK2 or CDK7 selective inhibitors.
MESP, NBO and structure based pharmacophore analyses
Molecular electrostatic potential mapping is a widely used method for characterization of pharmacologically active molecules based on their physicochemical properties and chemical reactivity patterns. The comparison of ligands' steric and electronic properties with essential pharmacophoric features in the binding sites of different isoform proteins would be useful to understand the binding affinity and selectivity of a ligand. In the current work, the keen attention has been paid to explore the effects of variation in distribution of electrostatic potentials throughout the molecular surface of three 2-anilino-4-(thiazol-5-yl)-pyrimidines on ligand–receptor binding selectivity for CDK2 against CDK7. Additionally, we have also developed structure-based pharmacophore models based on the co-crystal structures of all ligands CP1, CP2, and CP3 complexed with CDK2 or the MD-simulated structure models, which will be discussed later, of their complexes with CDK7 to reveal contributions of these pharmacophoric features in the ligand–receptor complex formation. Fig. 3 represents the physicochemical properties of CDK2 and CDK7 and electrostatic potentials of CP1, CP2, and CP3. The chemical features described by pharmacophore model reveal that the sulfonyl oxygen atom of the most CDK2-active compound CP1 form a hydrogen bond interaction with the side chain amine group of Lys89 in CDK2 (Fig. 3A), and a corresponding H-bond was not observed in the co-crystal structure of CP3 binding to CDK2 (Fig. 3I) or neither of inhibitor binding to CDK7 (Fig. 3C, G, and K). Hence, it could be considered of the H-bond donor provided by the side chain amine group of Lys89 at the bottom of ATP binding pocket of CDK2 as an important chemical feature to identify the potent and selective CDK2 inhibitor against CDK7.The MESP mappings show that CDK2-selective inhibitor CP1 shares unique electronic properties (Fig. 3B), which are different from CDK7-selective inhibitor CP3 (Fig. 3J). The most electronegative potential region (deep red color), which is favorable for electrophilic attack, is located on sulfonyl oxygen atoms of CP1. In fact, Mulliken population analysis was performed to get more detailed insight at electronic level. As shown in Fig. 3B, the sulfonyl oxygen atoms of CP1 bear an average Mulliken charge of −1.383, representing the most negatively charged region around the molecule. Another relatively less prominent localized negative charged region in CP1 was found to be located over the oxygen atom of its 3H-thiazol-2-one moiety with a Mulliken charge of −0.624. Whereas, the hydrogen atom linked to nitrogen atom of CP1 represents a nucleophilic center (cyan color) with the Mulliken charge of 0.424. In addition, most of positive potentials were seen near the protons of C27 and C29 in the 4,5-dimethylthiazol-2-yl ring of CP1. Generally, the distribution of both electronegative and electropositive potentials throughout the molecular surface illustrates those regions that may act as a hydrogen bond acceptor or donor to have hydrophilic interactions with corresponding residues around the active site of kinase. Appearance of highly electronegative regions at the sulfonyl group is consistent with the experimentally determined binding affinity data.16 By analyzing structure based chemical features described by pharmacophore model (Fig. 3A), it was also indicated that these areas would be directly involved in making interactions with the key residues Leu83, Asp86, and Lys89 in the active site of CDK2 or the corresponding residues Met94 and Asp97 of CDK7. On the other hand, CDK7 has a hydrophobic residue Val100 to align the hydrophilic residue Lys89 of CDK2, so it cannot make favorable interactions with inhibitors CP1 and CP2 (Fig. 3A and C).
In addition, MESP mappings of CP3 (Fig. 3J and L) indicate a slightly positive potential spread over the bulky piperazine ring at the para position of aniline, which is unfavorable for the positively charged side chain of Lys89 of CDK2 (Fig. 3J). Consequently, the side chain of Lys89 is pushed away into an unfavorable conformation observed in the co-crystal structure of CP3–CDK2, which is different from that detected in the crystal structures of apo-CDK2 and CP1–CDK2 complexes. Meanwhile, CP3 showed good bioactivity towards CDK7 due to a hydrophobic residue Val100 in CDK7, in the corresponding site of Lys89 of CDK2, to accommodate the piperazine ring of CP3 (Fig. 3J and L).
Finally, MESP was plotted for the moderately CDK2-selective inhibitor CP2. As shown in Fig. 3F and H, the most electronegative region lies near the oxygen atoms of m-NO2 substituted on its aniline ring. However, establishment of stronger interactions would be hampered due to lack of direct contact between m-NO2 of CP2 and Lys89 of CDK2. Meanwhile, the strongest electropositive potential was noticed over a pair of hydrogen atoms (average Mulliken charge: 0.593) bonded to nitrogen atoms of thiazole C4-amino group interacting strongly with Asp145 of CDK2 (Fig. 3F). The results indicated that the negative potentials near the sulfonyl group of CP1 and the strong positive potentials at position 2 of thiazole ring of CP2 would be descriptors for their selectivity for CDK2. The structure based pharmacophore models derived from co-crystal structures of three compounds with CDK2 or MD-simulated structural models of their complexes with CDK7 also signify the participation of these areas in the imperative interactions with the key residues such as Lys33, Leu83, Asp86, Lys89, and Asp145 of CDK2 or the corresponding residues Lys43, Met92, and Asp95 of CDK7. Thus, the electrostatic potential features are consistent with the structure based pharmacophore model generated by Ligand Scout.52
Highest occupied and lowest unoccupied molecular orbitals (LUMOs and HOMOs)
The frontier orbitals HOMO and LUMO, which are quantum chemical descriptors, were calculated for all three inhibitors CP1, CP2, and CP3. Both HOMO and LUMO energies are correlated with several chemical and pharmacological processes. HOMO and LUMO frontier orbitals were plotted onto the molecular surface along with HOMO and LUMO energy gap (HLG) of CP1, CP2, and CP3, shown in Fig. S3 in the ESI.† The frontier orbital LUMO value would determine the electron acceptor ability of an inhibitor molecule in receptor–ligand complex formation, whereas, the electron donating ability of the inhibitor is directly associated with HOMO value. The computed quantum chemical descriptors HOMO and LUMO values of CP1, CP2, and CP3 in both gas and solvation (water) phases are summarized in Table S3 in the ESI.† CP1 has higher HOMO value than CP2 and CP3, indicating the greater ease of donating electrons to CDK2. The higher LUMO value of moderately active compound CP2 shows the greater electron acceptor ability in contrast to CP1 and CP3. The results indicate that both CP1 and CP2 are more reactive than CP3 due to their rapid electron transfer ability. Additionally, dipole moments of CP1, CP2, and CP3 were also computed in both gas and solvation (water) phase, ranging from 6.8 to 15.7 Debye (Table S3 in the ESI†). In particular, the most active compound CP1 shows the higher dipole moment (water = 15.7 D, gas = 11.52 D) than another two inhibitors.Comprehensive analysis of structural flexibility and stability
MD simulations have been successfully performed for the duration of 40 ns in explicit aqueous solution for each of nine complexes, including three CDK2 complexes CP1–CDK2, CP2–CDK2, and CP3–CDK2, three CDK2 mutant complexes CP1–Q85T, CP1–K89L, and CP1–D145A, and three CDK7 complexes CP1–CDK7, CP2–CDK7, and CP3–CDK7. To inspect the dynamic stability of each complex and to validate rationality of the MD simulated results, the root-mean-square deviation (RMSD) fluctuations of backbone atoms were monitored over 40 ns of MD trajectories. Fig. 4 shows the RMSD curves for whole protein, binding pocket, and ligand of each complex for entire snapshots saved during MD simulations in comparison with the starting structures of each corresponding system. As illustrated, each system achieved equilibrium rapidly after some initial fluctuations. Hence, it was logical to further calculate the binding free energies and the contribution of individual residue to ligand binding (energy decomposition) using the conformations extracted from last 20 ns MD simulations. Among all nine complexes (Fig. 4A–I) CP1–CDK7 complex (Fig. 4B) showed highest fluctuations with the biggest RMSD values of ∼1.7 Å and ∼2.5 Å for protein and ligand, respectively, among all nine complexes, indicating that CP1 would have an unstable binding mode with CDK7 (Fig. 4B).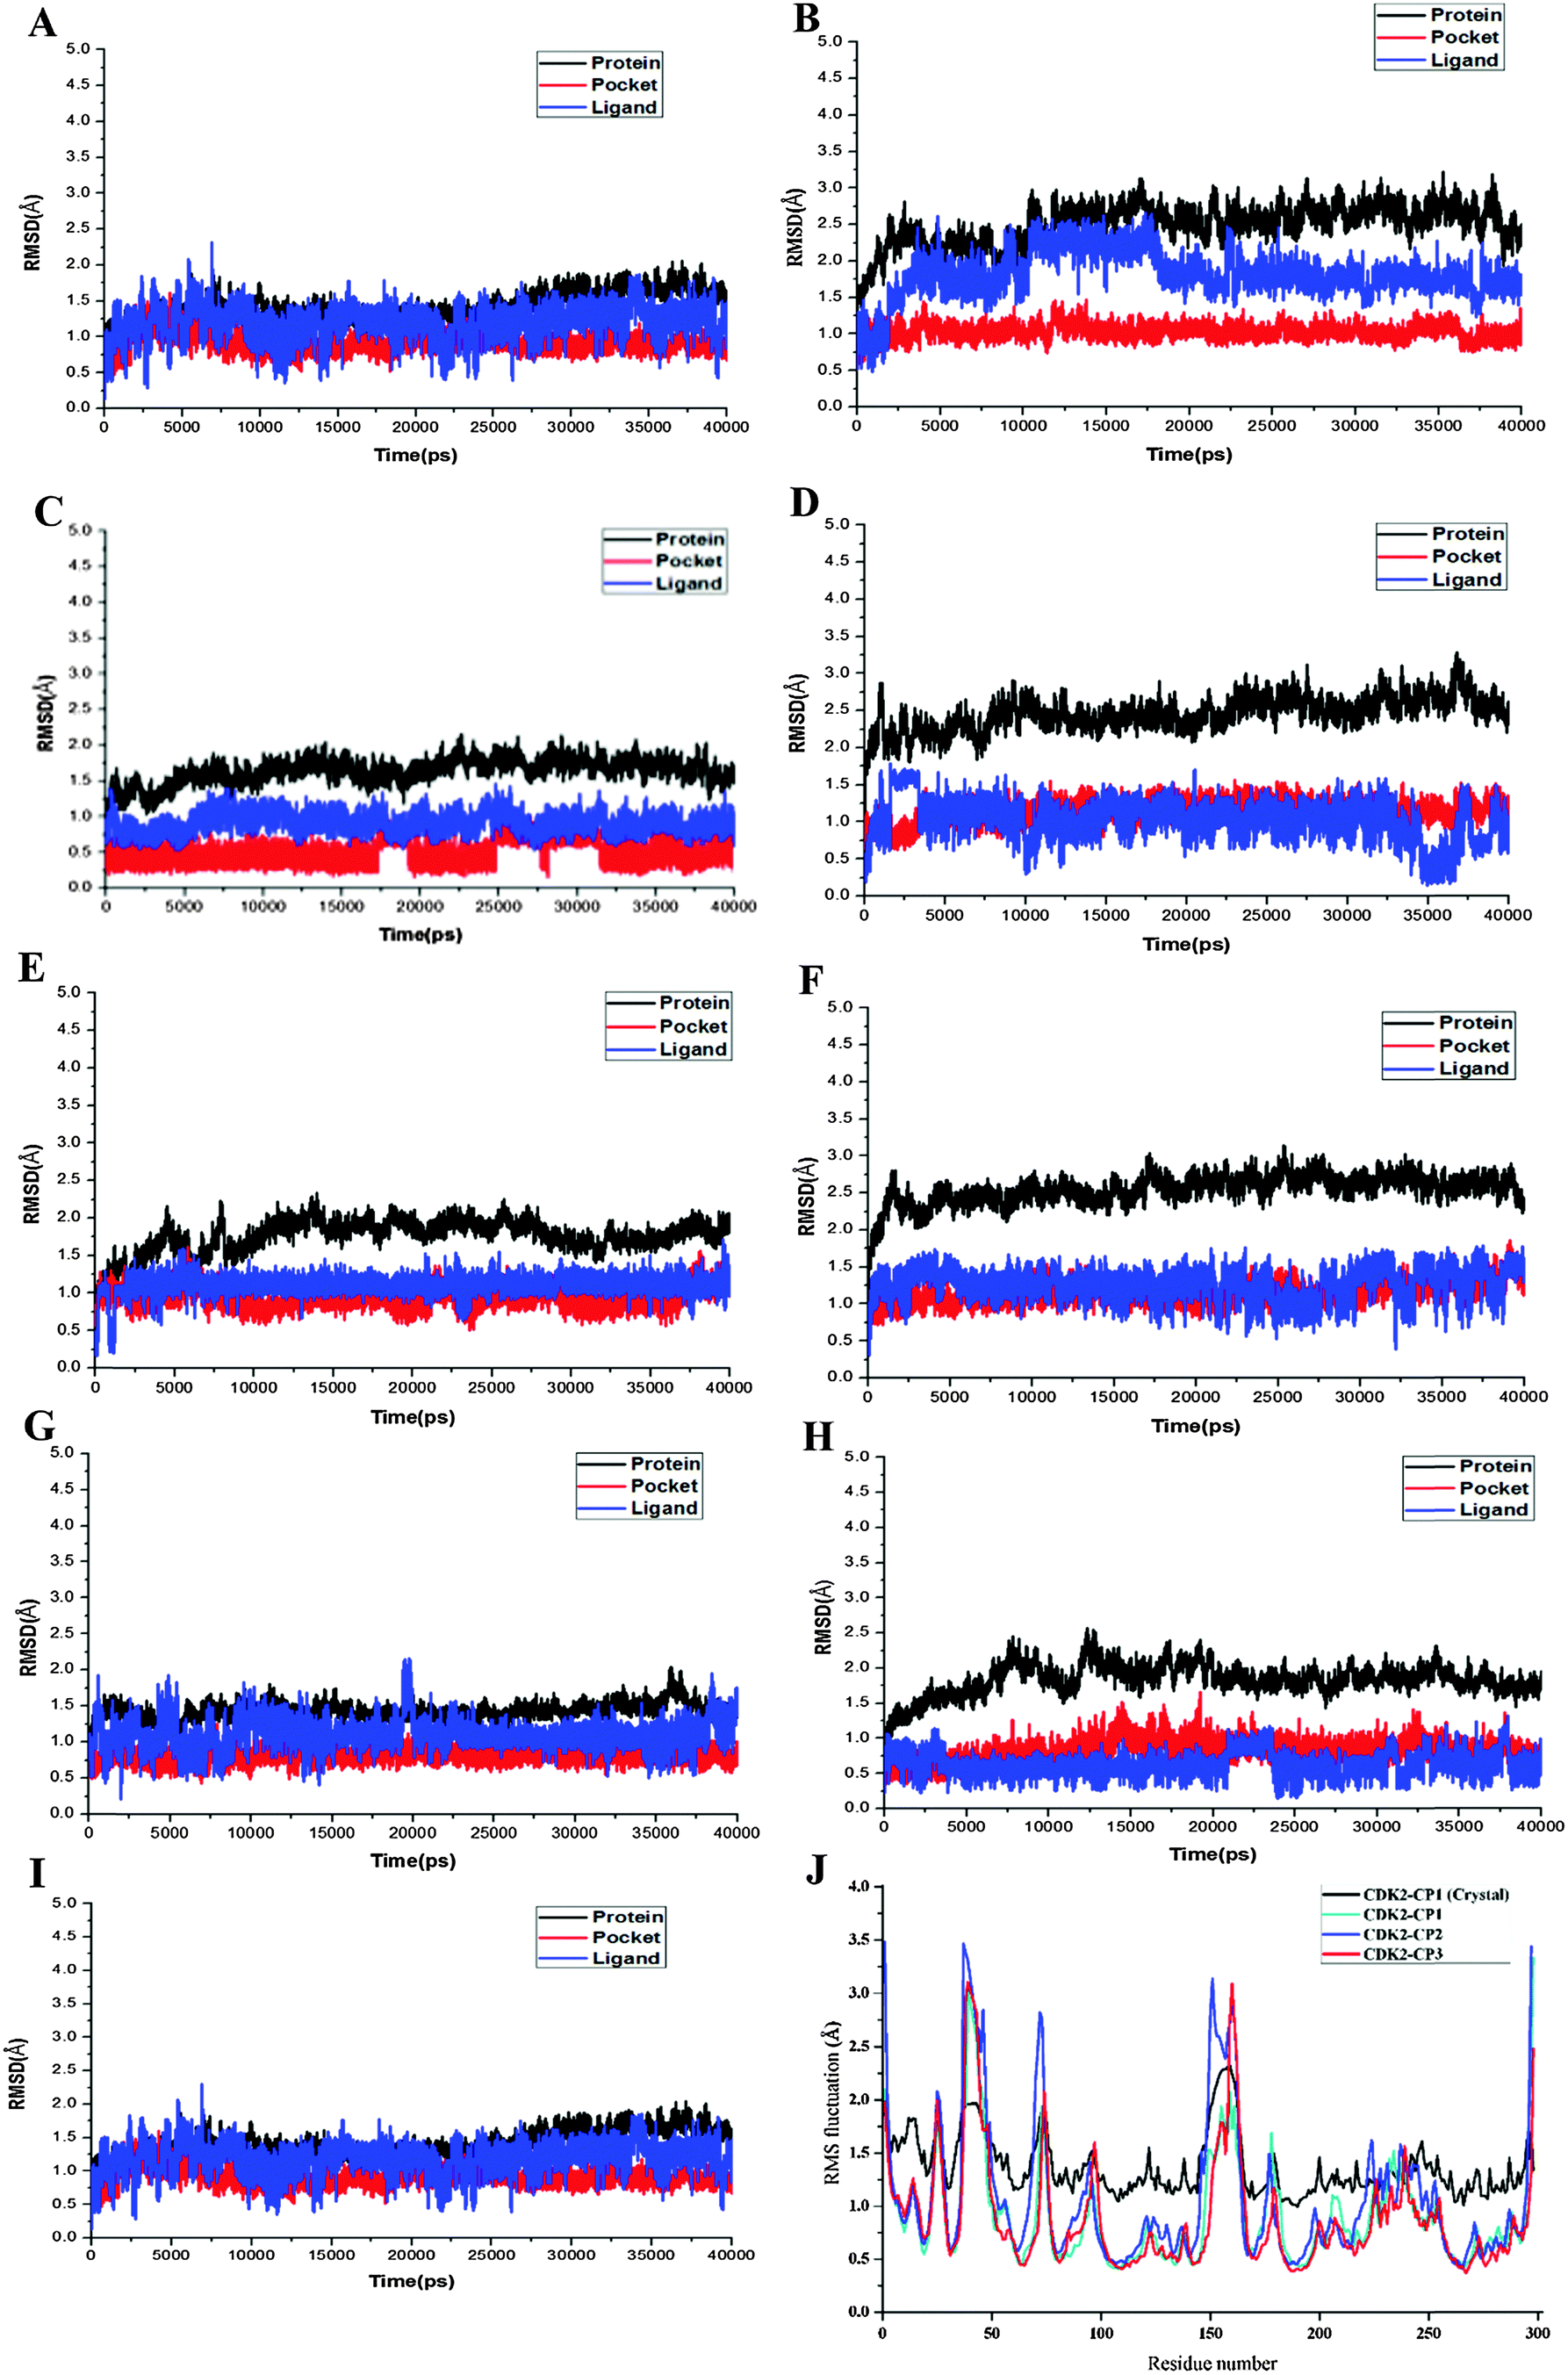
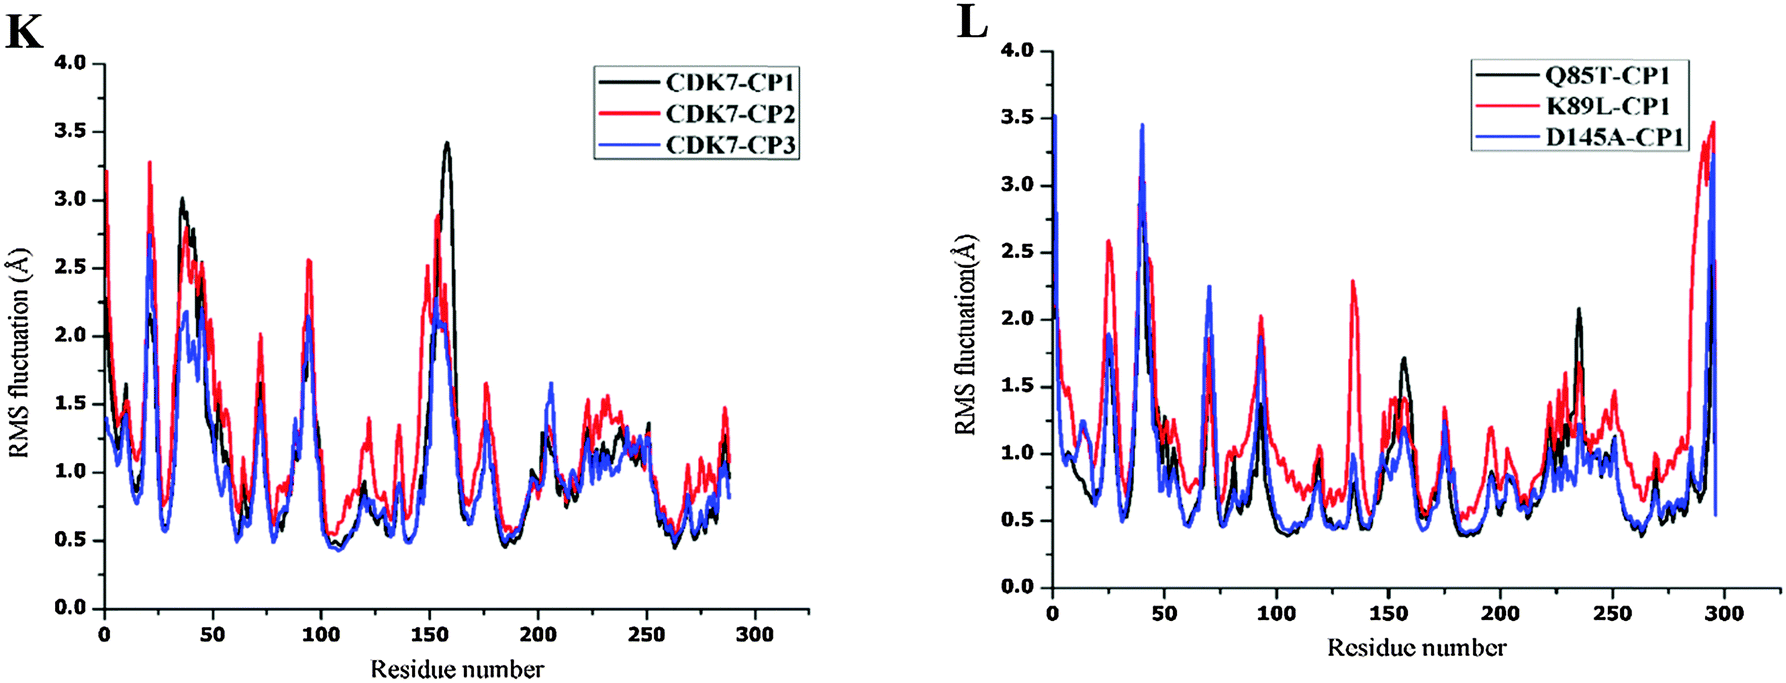 | ||
| Fig. 4 RMSDs of Cα atoms of the protein, backbone atoms of binding pocket (within 6.5 Å), and the heavy atoms in the ligand for: (A) CDK2–CP1, (B) CDK7–CP1, (C) CDK2–CP2, (D) CDK7–CP2, (E) CDK2–CP3, (F) CDK7–CP3, (G) Q85T–CP1, (H) K89L–CP1, (I) D145–CP1, (J) RMSF of each residue of the protein for the complex obtained from the crystal structure and all three CDK2 complexes obtained from 40 ns MD simulation, (K) RMSF of each residue of the protein for all three CDK7 complexes obtained from 40 ns MD simulation, (L) RMSF of each residue of the protein for all three mutants obtained from 40 ns MD simulation. | ||
Moreover, the root-mean-square fluctuation (RMSF) was also calculated for each MD-simulated complex. Fig. 4J–L show similar RMSF distributions for all protein systems (CDK2, CDK2-mutants and CDK7), which indicates that all inhibitors have similar binding modes with CDK2 (Fig. 4J), CDK7 (Fig. 4K) and CDK2 mutants (Fig. 4L). Fig. 4J illustrates that RMSFs of CDK2-inhibitors from MD trajectories are in good agreement with the results derived from experimental crystallographic data. Interestingly, the residues in the flexible loop region (G-loop) within both crystal CDK2–ligand and MD-simulated CDK2–ligand complexes also show the similar fluctuation patterns (Fig. 4J). All these data validate the reliability of the MD simulated results. Among all nine complexes, highest RMSF fluctuations (Fig. 4L) of CDK2 mutant D145A active site signify that CP1 has unstable binding with CDK2 mutant D145A, indicating Asp145 plays a critical role in CP1 binding to CDK2. In fact, Asp145 was found to have vdW interaction with C27 atom of CP1 in the co-crystal structure of CDK2–CP1.
Binding free energy analysis
In order to compare the binding affinities of three inhibitors towards CDK2, CDK2 mutants, and CDK7, MM/PBSA and MM/GBSA methodologies were applied to calculate binding free energies in terms of gas phase energy, solvation energy, and entropic contributions over 1000 snapshots extracted from last 2 ns of MD trajectories for each protein–ligand system. Table 1 summarizes computed binding free energies along with their respective enthalpic and entropic contributions for nine systems and experimental binding free energies derived from Ki values of three inhibitors on CDK2 and CDK7. Results showed that the ranking of predicted binding free energy values (ΔGpred(GB)) of CP1 (−48.35 kcal mol−1), CP2 (−44.51 kcal mol−1), and CP3 (−38.43 kcal mol−1) binding to CDK2 are in accordance with their experimental binding affinities16 (CDK2: CP1, Ki = 0.1 nM; CP2, Ki = 1 nM; CP3, Ki = 128 nM), although the predicted binding free energies are moderately higher than ΔGexps determined by Ki values. The ΔGpred(GB) values of inhibitors CP1 (−36.79 kcal mol−1), CP2 (−37.56 kcal mol−1), and CP3 (−43.65 kcal mol−1) binding to CDK7 are also in agreement with their experimental ΔGexp values (Table 1). In addition, the CDK2-selective inhibitor CP1 possesses higher predicted binding energies for CDK2 (ΔGpre, MMGBSA: −48.35 kcal mol−1; MMPBSA: −41.66 kcal mol−1) than CDK7 (ΔGpre, MMGBSA: −36.79 kcal mol−1 MMPBSA: −30.90 kcal mol−1) and shows more significant difference in ΔGpred(GB/PB) values for CDK2 versus CDK7 than CP2 and CP3. These high differences in binding free energies reflect the fact that CP1 is the most CDK2-selective inhibitor among all three inhibitors. Furthermore, ΔGpred(GB/PB) value of CP1 binding to CDK2 is also more negative than that of its binding to other simulated CDK2 mutant Q85T, K89L, or D145A (Table 1). The results indicate that CP1 binds more tightly to the wild-type CDK2 than its mutants, indicating that the residues Gln85, Lys89, and Asp145 of CDK2 are directly involved in augmenting the binding affinity of CP1 on CDK2. Therefore, it could be hypothesized that these three residues may play critical roles in the binding of CP1 on CDK2.| Complex system | CDK2–CP1 | CDK7–CP1 | CDK2–CP2 | CDK7–CP2 | CDK2–CP3 | CDK7–CP3 | Q85T–CP1 | K89L–CP1 | D145A–CP1 |
|---|---|---|---|---|---|---|---|---|---|
|
a All energies are in kcal mol−1.
b
TΔS: the entropy changes.
c ΔGpred: the calculated binding free energy by MMPB(GB)SA method.
d
K
i values of CP1, CP2, and CP3 were taken from ref. 16.
e ΔGexp: the experimental binding free energy was calculated according to the experimental binding affinity Ki by ΔGexp ≈ −RTlnKi.
|
|||||||||
| ΔEvdW | −53.70 | −42.58 | −43.03 | −46.73 | −44.19 | −47.20 | −50.28 | −49.99 | −49.82 |
| ΔEele | −41.34 | −47.76 | −41.56 | −27.27 | −30.40 | −28.84 | −14.41 | −27.69 | −25.14 |
| ΔGnonpol,sol | −6.82 | −5.29 | −5.52 | −5.66 | −5.43 | −5.31 | −6.35 | −6.62 | −6.14 |
| ΔGele,sol(PB) | 59.30 | 64.45 | 49.66 | 51.58 | 50.23 | 43.67 | 46.17 | 47.72 | 45.50 |
| ΔGele,sol(GB) | 53.52 | 58.84 | 45.62 | 42.10 | 41.60 | 37.69 | 39.78 | 44.80 | 42.68 |
| ΔEvdW + ΔGnonpol,sol | −60.52 | −47.87 | −48.55 | −52.39 | −49.62 | −52.51 | −56.63 | −56.61 | −55.96 |
| ΔEele + ΔGele,sol(PB) | 17.96 | 16.69 | 6.63 | 24.31 | 19.83 | 14.83 | 31.76 | 20.03 | 20.36 |
| ΔEele + ΔGele,sol(GB) | 12.18 | 11.08 | 8.10 | 14.83 | 11.2 | 8.85 | 25.37 | 17.11 | 17.54 |
| TΔSb | −25.36 | −27.10 | 4.06 | −22.53 | −20.98 | −21.92 | −22.14 | −22.14 | −28.18 |
| ΔGpred(PB)c | −41.66 | −30.91 | −39.42 | −26.91 | −29.54 | −37.50 | −24.30 | −35.82 | −35.04 |
| ΔGpred(GB)c | −48.35 | −36.79 | −44.51 | −37.56 | −38.43 | −43.65 | −31.27 | −39.50 | −38.42 |
| K i (nM) | 0.11 | 940 | 1 | 73 | 149 | 2.3 | NA | NA | NA |
| ΔGexpe | −13.66 | −8.26 | −12.34 | −9.79 | −9.36 | −11.85 | NA | NA | NA |
In order to get insights into driving forces for selective bindings of three ligands on different kinases, total binding free energy was further decomposed into independent binding free energy components (Fig. 5A–D or Table 2) with MMGB(PB)SA methods. The calculated values of individual binding free energy components for nine complex systems reveal that the favorable Coulomb interactions between protein and ligand are opposed by the unfavorable electrostatics of desolvation contribution, indicating that the sum of the electrostatic interaction contributions in vacuum (ΔGele) and solvent (ΔGele,sol) disfavors the ligand–protein binding. Whereas, the sum of vdW energy (ΔEvdW) and nonpolar solvation energy (ΔGnonpol,sol) is a favorable contribution to each inhibitor binding to CDK2 or CDK7. The difference of vdW energy components between CP1–CDK2 and CP1–CDK7 (11.12 kcal mol−1) is much higher than that between CP3–CDK2 and CP3–CDK7 (3.01 kcal mol−1). On the other hand, the moderately CDK2-selective inhibitor CP2 shows lower vdW energy value than electrostatic energy value (Fig. 5B). The total vdW contribution for CP2–CDK2 complex is 3.70 kcal mol−1 less than the corresponding vdW contribution for CP2–CDK7 complex. The decrease of vdW contribution may be responsible for decrease in CP2 selectivity for CDK2 over CDK7. Similarly, variations in electrostatic interactions also make noticeable differences in the absolute binding free energy of CP1 binding to CDK2 mutant Q85T, K89L, or D145A (Fig. 5D). Interestingly, CP1 has highest selectivity for CDK2 against CDK7 despite of lower electrostatic energy contribution in CP1 binding to CDK2 as compared to CDK7. Instead, the moderately CDK2-selective inhibitor CP2 shows a decrease in vdW energy in comparison with corresponding value in CDK7 (Fig. 5B), compensated by an increase in electrostatic interaction energy. Therefore, the electrostatic interaction significantly contribute to the binding affinity of an inhibitor,53 and the vdW interactions are the main driving forces for selectivity of inhibitors CP1, CP2, and CP3 for CDK2 against CDK7.
| Residues around the binding site of CDK2b | CP1 | CP2 | CP3 | Residues around the binding site of CDK7b | |||
|---|---|---|---|---|---|---|---|
| ΔGvc | ΔGed | ΔGvc | ΔGed | ΔGvc | ΔGed | ||
| a All values are in kcal mol−1. b Residues around the binding site of CDK2 are aligned the corresponding residues, on the next line in the table, around the binding site of CDK7. c ΔGv = ΔGvdW + ΔGnonpol,sol. d ΔGe = ΔGele + ΔGele,sol. | |||||||
| Ile10 | −4.06 | 1.52 | −2.89 | 0.91 | −3.92 | 1.17 | |
| −2.80 | 0.52 | −2.24 | 0.77 | −3.52 | 0.81 | Leu18 | |
| Val18 | −1.87 | 0.58 | −1.71 | 0.05 | −1.85 | 0.20 | |
| −1.51 | 0.01 | −1.73 | 0.09 | −1.66 | −0.09 | Val26 | |
| Ala31 | −1.00 | 0.38 | −1.26 | 0.06 | −1.26 | 0.03 | |
| −1.13 | 0.10 | −1.28 | 0.37 | −1.21 | 0.01 | Ala39 | |
| Lys33 | −0.76 | 2.56 | −1.14 | 2.44 | −0.57 | 1.37 | |
| −0.68 | 0.07 | −1.29 | 2.12 | −0.90 | 0.38 | Lys41 | |
| Phe80 | −1.32 | −0.60 | −1.50 | −0.80 | −1.10 | −0.02 | |
| −1.29 | 0.08 | −2.70 | −0.13 | −1.51 | −0.01 | Phe91 | |
| Glu81 | −0.47 | −0.41 | −0.17 | −0.30 | −0.33 | −0.18 | |
| −0.19 | −0.26 | −0.08 | 0.12 | −0.21 | 0.06 | Asp92 | |
| Phe82 | −2.02 | −0.71 | −1.76 | −0.37 | −1.71 | −0.88 | |
| −2.03 | −0.52 | −1.04 | −0.25 | −2.07 | −0.45 | Phe93 | |
| Leu83 | −0.93 | −1.53 | −1.16 | −1.37 | −1.69 | −0.05 | |
| −0.91 | −1.81 | −1.34 | −1.45 | −1.25 | −1.26 | Met94 | |
| Gln85 | −1.64 | −1.51 | −1.47 | 0.39 | −1.98 | 0.97 | |
| −2.04 | 0.38 | −0.92 | 0.12 | −1.78 | −0.38 | Thr96 | |
| Asp86 | −1.44 | 1.07 | −1.89 | 0.39 | −1.51 | 1.86 | |
| −1.19 | 0.95 | −1.25 | 0.93 | −2.30 | 0.98 | Asp97 | |
| Lys89 | −1.50 | −0.67 | −0.31 | 0.66 | −1.37 | 0.42 | |
| −0.73 | 0.05 | −0.02 | 0.05 | −0.94 | 0.09 | Val100 | |
| Leu134 | −2.45 | 0.29 | −2.37 | 0.05 | −2.26 | 0.61 | |
| −1.85 | 0.10 | −2.47 | 0.01 | −1.93 | −0.05 | Leu144 | |
| Asp145 | −1.37 | −0.53 | 0.10 | −4.12 | −0.75 | −0.41 | |
| −0.90 | 1.15 | −0.67 | −0.27 | −0.28 | 0.41 | Asp155 | |
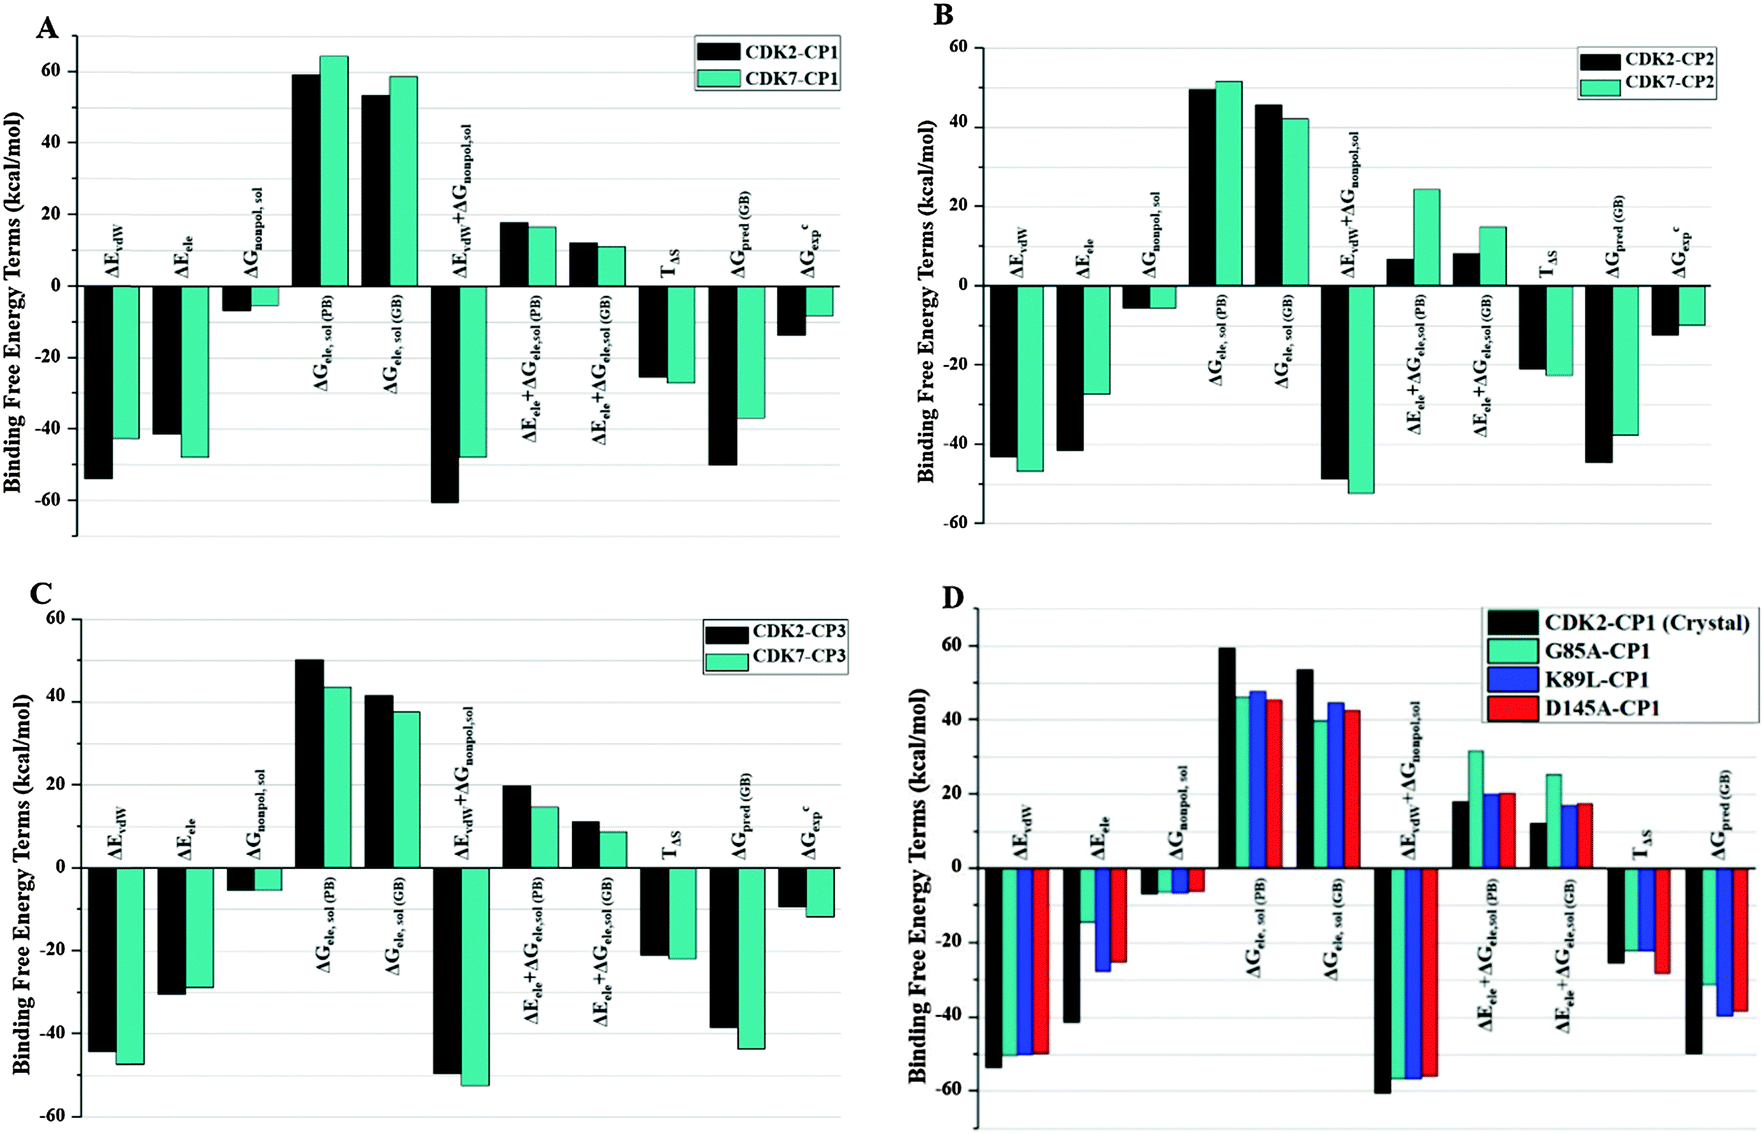 | ||
| Fig. 5 Comparison between binding free energy terms of CDK2 and CDK7: (A) CP1, (B) CP2, (C) CP3, (D) CDK2-mutants-CP1. | ||
Analysis of free energy components indicated that the decline in selectivity was directly associated with the reduction in vdW contribution, whereas the high potency of CP2 for CDK2 was maintained by an increase in electrostatic energy component. This finding was further authenticated by CP3 binding to CDK2/CDK7, in which the electrostatic energy component of CP3–CDK2 complex was approximately equal to that of CP3–CDK7 complex and the selectivity of CP3 was ascribed by higher vdW energy contribution for CP3–CDK7 than CP3–CDK2. Hence, it might be proposed that the selective binding of each inhibitor (CP1, CP2, or CP3) could be dominated by vdW and nonpolar solvation free energies while the electrostatic components have major contribution for binding affinity of an inhibitor with comparatively less influence to its selectivity for CDK2 over CDK7.
Structural analysis of dynamic results to understand the selectivity mechanism of inhibitors
The MD-simulated structural model of each CDK2–/CDK7–ligand complex was superimposed onto the corresponding initial structural model to see the structural variation, induced by the inhibitor binding, of residues around the binding pockets of CDK2 and CDK7 (Fig. 6). Among all complexes, CP3–CDK2 (Fig. 6C) shows maximum structural deviation with reference to key residues due to the presence of a bulky piperazine ring of CP3. By comparing the MD-simulated representative snapshots of complexes of CP1, CP2, and CP3 binding to CDK2 and CDK7, respectively, it was found that all three inhibitors adopted similar interaction modes with CDK2 and CDK7 (Fig. 6A–F). The MD simulation results indicated that the pyrimidine N1 atom and anilino NH group of each inhibitor may form a characteristic H-bonds network with the backbone NH and carbonyl groups of the residue Leu83 (CDK2) or Met94 (CDK7). In addition, CP1 has its sulfonyl group to form additional hydrogen bond interaction with the backbone NH group of the highly conserved residue Asp86 of CDK2 or Asp97 of CDK7 (Fig. 6A and D).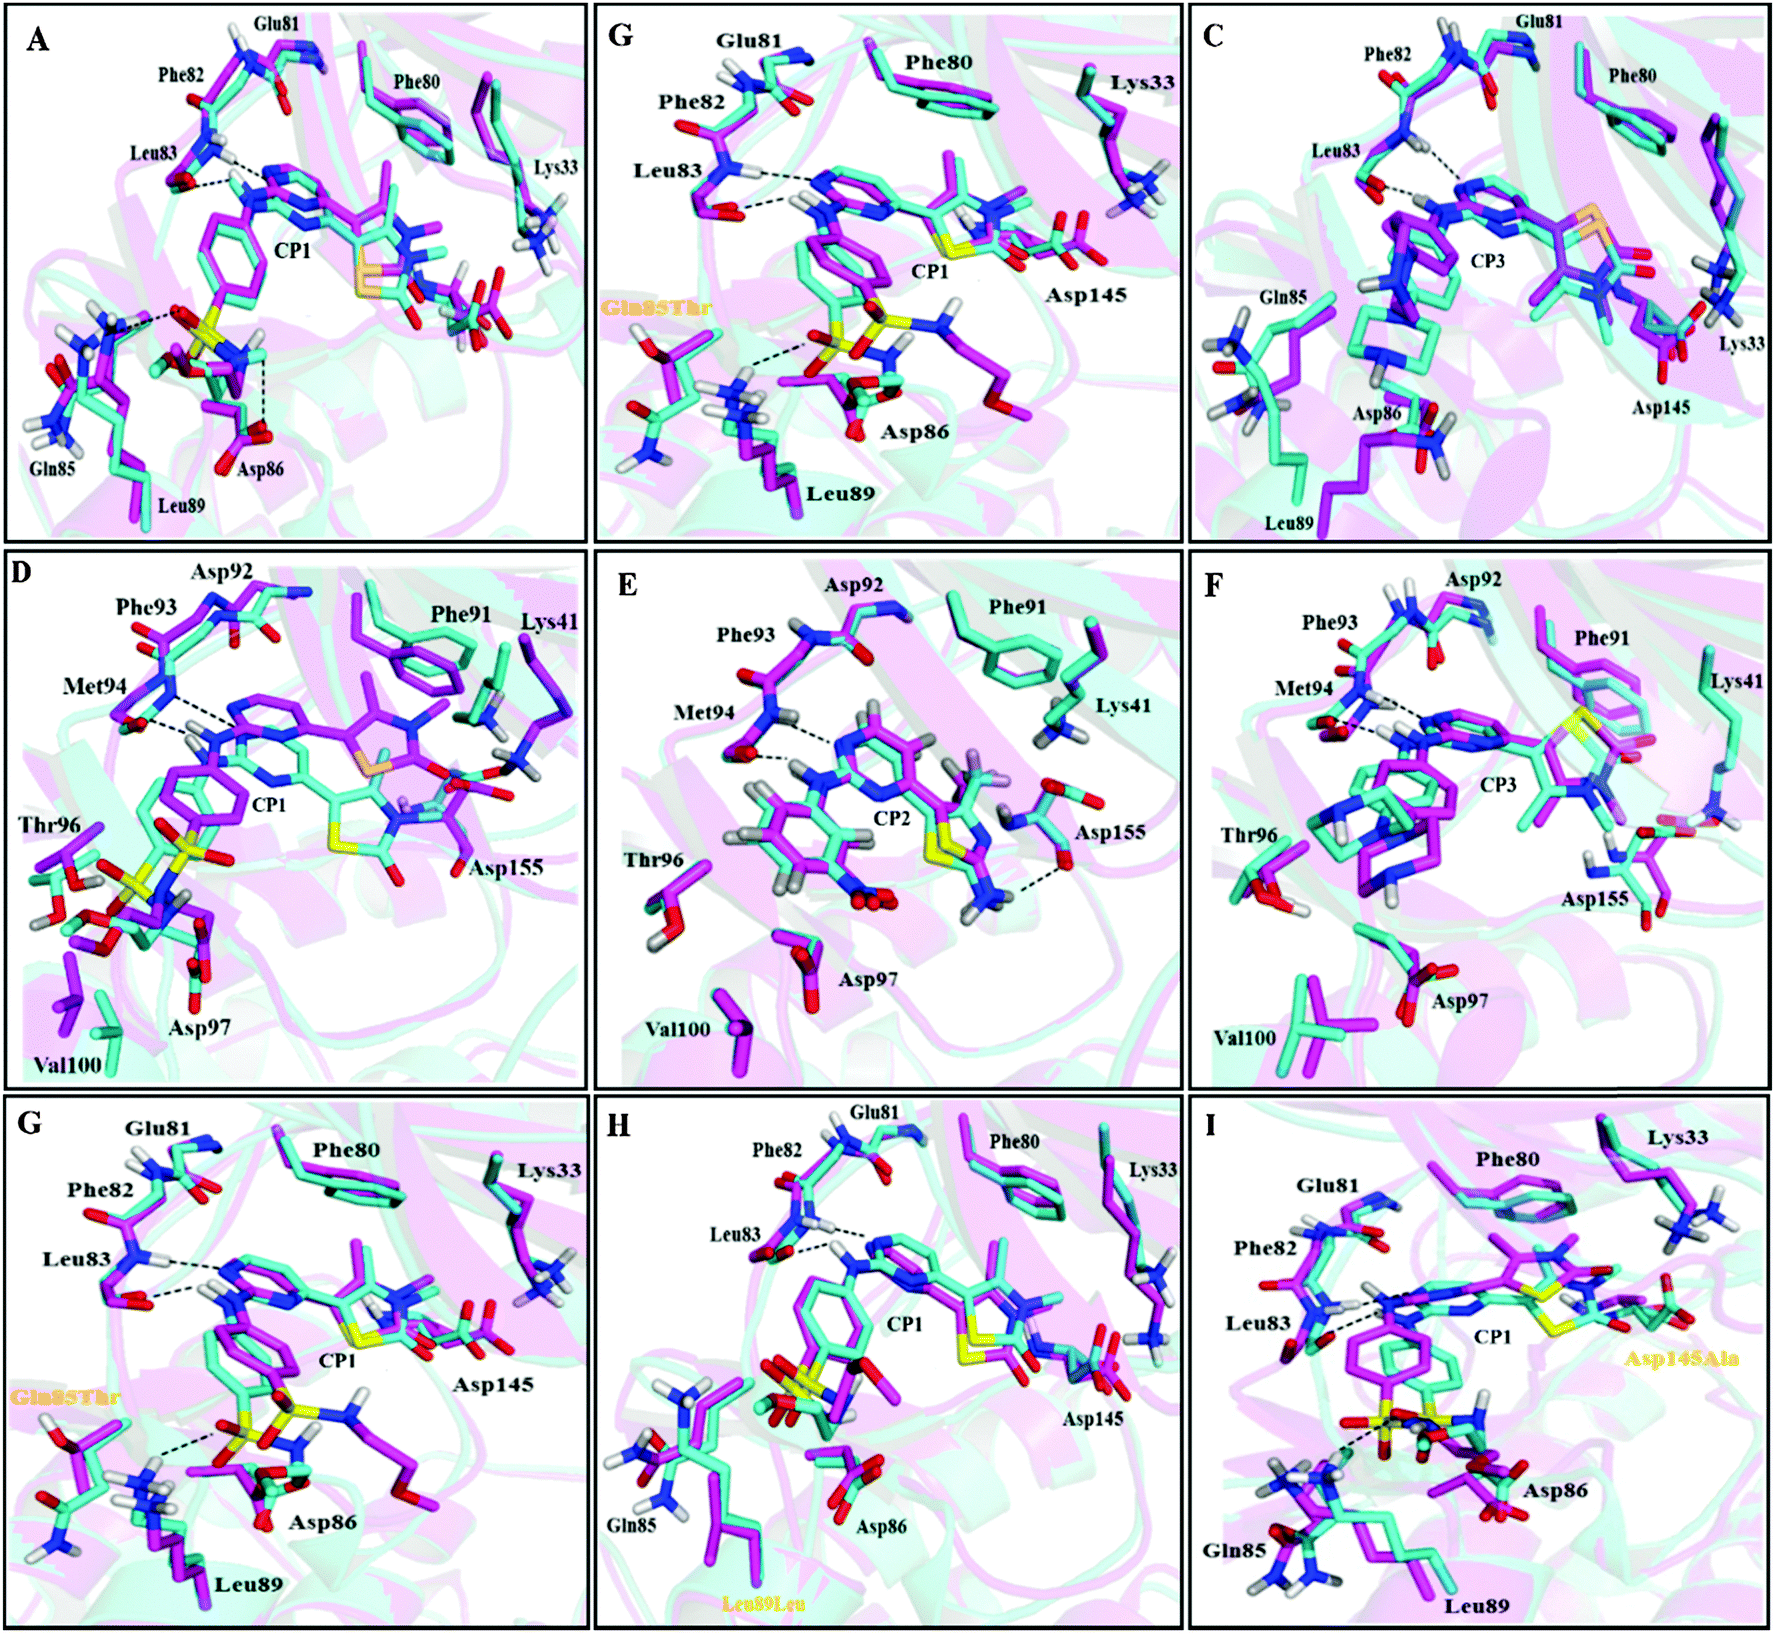 | ||
| Fig. 6 Structure comparison between initial (cyan) and representative snapshots from MD (magenta) of: (A) CDK2–CP1, (B) CDK7–CP1, (C) CDK2–CP2, (D) CDK7–CP2, (E) CDK2–CP3, (F) CDK7–CP3, (G) Q85T–CP1, (H) K89L–CP1, (I) D145A–CP1. | ||
Furthermore, it was illustrated that the binding mode of CP1 would not be changed by in silico site mutation at Gln85, Lys89, and Asp145 by the comparison of MD simulated mutant-CDK2–CP1 complexes with wild-type CDK2–CP1 complex (Fig. 6G–I). To investigate the extent of spatial variation of key residues and changes in binding site geometry induced by mutation of corresponding residues, a frame of active site was described from backbone nitrogen atom of key residues Val18, Leu83, Asp86, Phe80, and Ala144 surrounding the ligand in the binding site of CDK2 (Fig. 7A). The distances between each pair of the backbone nitrogen atoms were measured and compared with that of the corresponding pair of atoms in wild-type CDK2–CP1 complex. As shown in Fig. 7B, the site mutation is adjacent to the large-scale spatial variation of key residues constituting the frame of the active site. It may indicate that all three residues Gln85, Lys89, and Asp145 play significant role in maintaining correct geometrical conformation of key residues in the active site of CDK2.
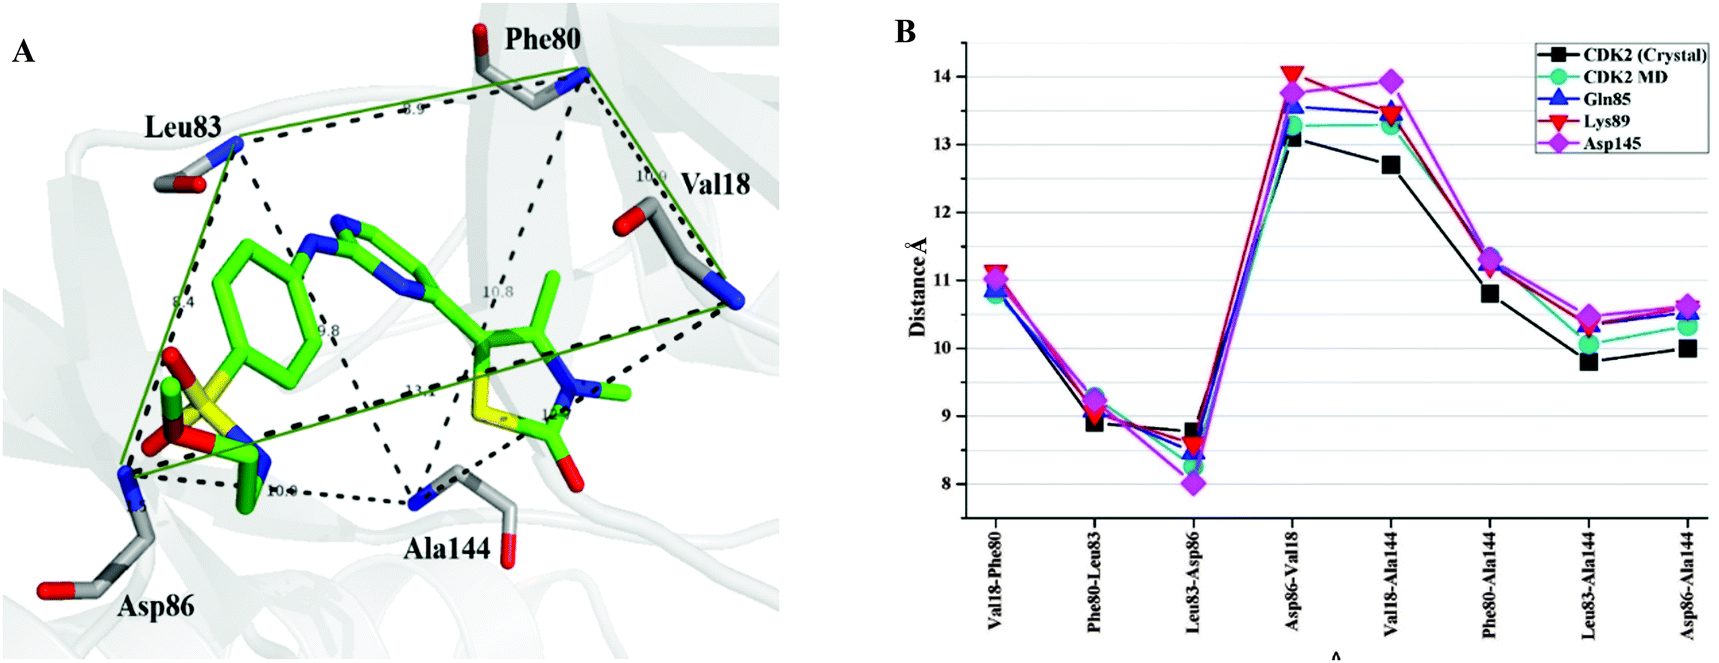 | ||
| Fig. 7 (A) The active site of CDK2 (residues with backbone atoms). The black dots represent the key atoms to define the frame of active site. (B) The atom-to-atom distances between the atoms in backbone at the key positions. | ||
Insight to the binding affinity of CP1 to CDK2 versus CDK7
The calculated binding free energies of receptor–ligand complexes were further decomposed on interaction energies of ligand with residues to evaluate the contribution of individual residue in tight binding of ligand to the active site of protein. Table 2 summarizes averaged interaction energies decomposed onto individual amino acid contributions (ΔGligand–residues) in terms of their electrostatic and vdW components for all complexes. As revealed in Fig. 8A–D, residues Glu8, Ile10, Gly11, Val18, Ala31, Phe80, Glu81, Phe82, Leu83, Gln85, Asp86, Lys89, Gln131, Asn132, Leu134, Ala144, and Asp145 of CDK2 have favorable vdW and electrostatic interactions with all three inhibitors. Whereas, the residues that favorably contribute to the ligand binding to CDK7 include Ile6, Gly7, Val14, Ala27, Phe79, Asp80, Phe81, Met82, Thr84, Asp85, Val88, Leu132, Ala144, and Asp155 of CDK7. On the other hand, hydrophilic residue Lys33 of CDK2 or Lys42 of CDK7 makes unfavorable electrostatic contribution in complexes CP1–CDK2, CP2–CDK2, CP3–CDK2, and CP2–CDK7, which could be explained by the fact that positive potentials spread over aminothiazole moiety push the side chain of lysine away from the active site to have a salt bridge interaction with Asp145 of CDK2 or Asp155 of CDK7.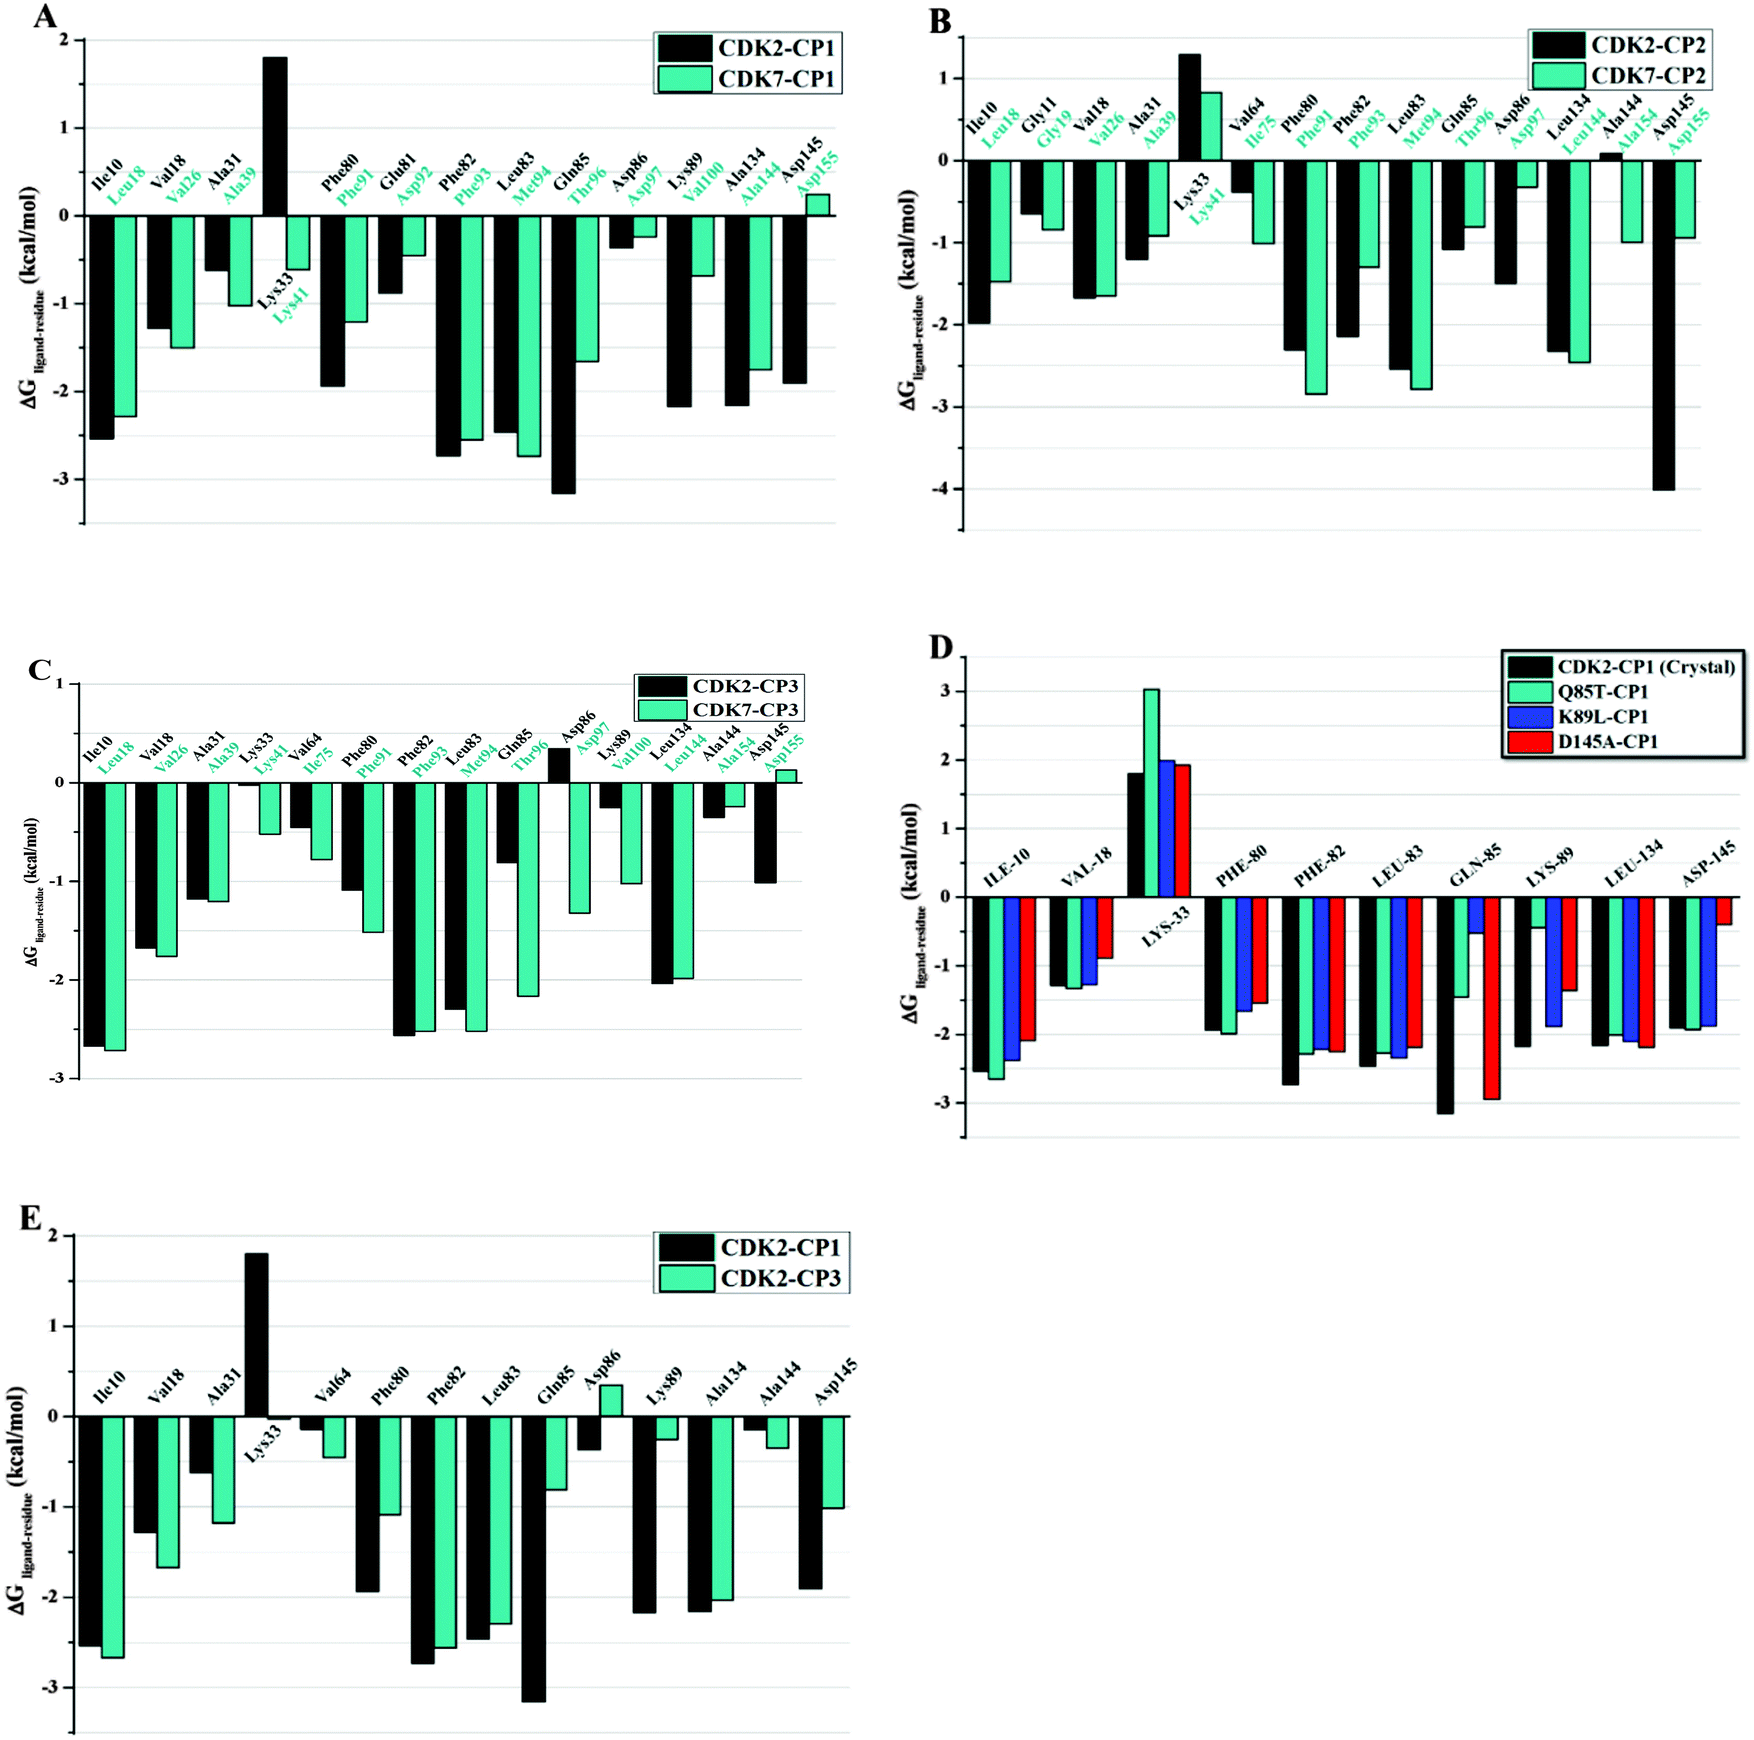 | ||
| Fig. 8 Comparison of per-residue energy decomposition ΔGligand–residue of CDK2, CDK2–mutants and CDK7 (A) CP1, (B) CP2, (C) CP3, (D) CDK2 mutants complex with CP1, (E) CDK2–CP1 versus CDK2–CP3. | ||
To rationalize the high affinity of CP1 towards CDK2 among all ligand–protein complexes, a comparison of ΔGligand–residue between CDK2 and CDK7 was performed (Fig. 8A). As a result, three key residues Gln85, Lys89, and Asp145 were identified as the dominant selectivity determinants for CP1 binding to CDK2 with absolute difference of ΔGligand–residues between CDK2 and CDK7 more than 0.2 kcal mol−1. The particular interaction pattern of CP1 binding to CDK2 is attributed by favorable free energy contributions from residues Gln85 (−3.15 kcal mol−1) and Lys89 (−2.17 kcal mol−1). However, this favorable free energy contribution is transformed into a comparatively less favorable contribution due to replacement of corresponding residues with Thr96 (−1.66 kcal mol−1) and Val100 (−0.68 kcal mol−1) of CDK7.
As illustrated in Fig. 8A, Asp86 (−0.36 kcal mol−1) of CDK2 has bigger contribution in CP1–CDK2 formation than Asp97 (−0.23 kcal mol−1) of CDK7 in CP1–CDK7 formation, although it can be seen that CP1 forms unstable hydrogen bond with both Asp86 of CDK2 (12% occupancy, Table S4 in the ESI†) and Asp97 of CDK7 (10% occupancy). Low occupancies of such H-bonding interactions may be explained by the observation that the side chain of aspartic acid in CP1–CDK2 or CP1–CDK7 complex can flip to 90 degree in a direction away from NH2 of CP1, leading to ultimate disruption of H-bond interaction. Another major difference to the binding free energy was caused by the thiazol-4-yl methyl group of CP1 to have favorable vdW contacts with Asp145 (−1.90 kcal mol−1) of CDK2 but unfavorable interaction with Asp155 (0.44 kcal mol−1) of CDK7. Since this aspartic acid residue is conserved in CDK2 and CDK7, the distance between the side chain carboxyl group of Asp145 of CDK2 or Asp155 of CDK7 and CP1 was plotted as function of time (Fig. S4A in the ESI†) to create a sense of variation in this residue attribution to vdW contribution throughout MD simulations. In case of initial coordinates, the distance between the C27 atom of CP1 and OD1 atom of Asp145 of CDK2 and Asp155 of CDK7 are 2.45 and 4.41 Å, respectively, whereas the mean distances between the center of mass of CP1 and the center of the side chain of Asp145 (CDK2) and Asp155 (CDK7) are 4.03 and 4.92 Å, respectively. Such distance variations in MD simulated CP1–CDK2 might be induced by unfavorable interaction between hydrophobic N–CH3 group of CP1 and hydrophilic carboxyl group of Asp145. This closer contact of CP1 with Asp145 rationalizes the stronger vdW interaction of CP1 with Asp145 than Asp155. Moreover, the C29 atom in the thiazol-4-yl methyl group of CP1 extends towards a shallow cavity (the Phe80-pocket of CDK2) to have stronger hydrophobic contact with Phe80 (−1.93 kcal mol−1) of CDK2 than the aligned residue Phe91 (−1.20 kcal mol−1) of CDK7. Similarly, the side chain of CDK2 Leu134 forms relatively stronger hydrophobic interactions (−2.15 kcal mol−1) with the pyrimidine and anilino rings of CP1 than the corresponding residue Leu144 (−1.75 kcal mol−1) of CDK7. As summarized in Table 2, the major differences of the vdW and nonpolar solvation energies can be identified on the residues Ile10, Phe80, Glu81, Phe82, Leu134 and Asp145 around the binding pocket of CDK2 and the residues Leu18, Phe91, Asp92, Phe93, Ala144 and Asp155 around the binding site of CDK7. These outcomes indicated that different vdW and nonpolar solvation energies might make major contributions to the differences of the predicted binding free energies between CP1–CDK2 and CP1–CDK7.
Furthermore, in silico mutagenesis analyses were performed to investigate the individual role of typical amino acid in the ligand–receptor interaction. As shown in Fig. 5D and 8D, the mutation at Gln85 (Q85T–CP1 complex) shows the largest decline to the binding free energy ΔGbind(GB) (17.08 kcal mol−1). Similarly, the mutation at Lys89 is also energetically unfavorable by 8.85 kcal mol−1 in ΔGbind(GB) due to the loss of an important H-bond interaction in the K89L–CP1 complex. The mutations at Gln85 and Lys89 were found to be mainly unfavorable for electrostatic components (ΔEele: 26.93 kcal mol−1 and 13.65 kcal mol−1, respectively). Whereas, the mutation of Asp145 (D145A–CP1 complex) shows a reduction in ΔGbind(GB) (9.93 kcal mol−1) along with decline of ΔEvdW by 3.88 kcal mol−1. Although Asp145 located at ribose binding site of CDK2 is highly conserved in the CDK family, our calculation results show that Asp145 of CDK2 might be an important residue for ligand recognition. The corresponding residue Asp155 of CDK7 does not have an equivalent contribution in CDK7 recognizing inhibitor.
Insight to the selectivity of CP2 binding to CDK2 versus CDK7
As illustrated in Fig. 8B, almost all of those residues, previously discussed to have contributions for CP1 binding to CDK2 or CDK7, are also favorable for CP2 binding to CDK2 or CDK7. However, residues Gln85 (Thr96) and Lys89 (Val100) were found to have no energetically valuable contribution in the case of CP2 binding to CDK2 or CDK7. Thus, the selectivity of inhibitor CP2 for CDK2 is potentially mediated by another two residues, namely Asp86 and Asp145, with absolute difference of ΔGligand–residues between CDK2 and CDK7 more than 0.2 kcal mol−1. Unlike CP1, NH2 group of CP2 provokes electrostatic interactions by forming H-bond with the side chain of Asp145. As shown in Fig. 8B, the free energy contribution of Asp145 (−4.01 kcal mol−1) in CP2–CDK2 complex is almost four times greater than that of corresponding residue Asp155 (−0.94 kcal mol−1) in CP2–CDK7 complex. As indicated in Table S4 in the ESI,† this increase in electrostatic energy component is mainly due to CP2 having more stable H-bond interaction with Asp145 of CDK2 (46.28% occupancy) than Asp155 of CDK7 (30.59% occupancy) with average distances between H-bond donor and acceptor in complexes CDK2–CP2 and CDK7–CP2 of 2.99 Å and 3.01 Å, respectively. It may give an explanation for higher difference of electrostatic contributions for CP2 binding to CDK2 and CDK7.Another particularly notable element for improved CP2 affinity towards CDK2 is attributed by vdW contributions of conserved residues (Fig. S4B in the ESI†). The nitrophenyl group of CP2, lying in the close vicinity of Asp86 of CDK2 or Asp97 of CDK7, to have more vdW interactions with Asp86 of CDK2 (−1.49 kcal mol−1) than Asp97 of CDK7 (−0.32 kcal mol−1). The mean distances between the nitrogen atom of CP2 and the side chain centers of residue Asp86 of CDK2 and Asp97 of CDK7 are 5.01 and 6.51 Å, respectively. On the other hand, hydrophobic residues Phe80 and Leu134 are unfavorable for CP2 binding to CDK2 in comparison with aligned residues Phe91 and Leu132 of CDK7 (Fig. 8B), although these residues have favorable contribution for tight binding of CP1 in CDK2 rather than CDK7. The comparison of independent binding free energy components between CP1–CDK2 and CP2–CDK2 reveals that the decrease in vdW interaction energy of CP2 relative to CP1 is largely due to difference in the substitution pattern at the amino thiazole rings of CP1 and CP2. In addition, NO2 substitution on phenyl ring of CP2 has little impact on its selectivity for CDK2 over CDK7 in comparison to SO2NH(CH2)2OCH3 group of CP1. The structural analyses and the decompositions of binding free energies to contributions of residues also imply that CP1 is more tightly binding to CDK2 than CP2. This might be explained by the stronger vdW contact of hydrophilic sulfonamide group of CP1 with Gln85 and Lys89 of CDK2 in relative to NO2 group of CP2 (Table 2). The results suggest that a highly electronegative substituent, like sulfonamide group, would aid to design more potential and selective CDK2 inhibitors.
Insight to the selectivity of CP3 binding to CDK2 versus CDK7
In contrast to CP1 or CP2, CP3 has higher bioactivity for CDK7 than CDK2. As listed in Table 2. Our calculations also indicate that CP3 has lower computed binding free energy values to CDK7 than CDK2. The calculated binding free energies of CP3 binding to CDK2 and CDK7, respectively, were then decomposed to per-residue contributions to further understand selectivity mechanism of CP3 binding to CDK7 against CDK2. Fig. 8C shows that two residues mainly determine the selective CP3 binding to CDK7 relative to CDK2 with absolute difference of ΔGligand–residues between CDK2 and CDK7 more than 0.2 kcal mol−1. This difference in the binding free energy primarily arises from the favorable contribution of residue Asp97 (−1.32 kcal mol−1) in CDK7, which is transformed into less favorable contribution of Asp86 (0.34 kcal mol−1) in CDK2 (Fig. 8C). As shown in Fig. S4C in the ESI,† N6 atom of CP3 is nearer to CB atom of Asp97 of CDK7 (3.70 Å) than to CB atom of CDK2 Asp86 (4.60 Å), although the distance (3.02 Å) between OD1 atom of Asp86 of CDK2 and C7 atom of CP3 is very similar as the distance (3.03 Å) between the oxygen atom of Asp97 of CDK7 and C7 atom of CP3. Therefore, the closer contact of CP3 with Asp97 rationalizes the stronger vdW interaction of CP3 with Asp97 of CDK7 than Asp86 of CDK2.Another upsurge to the binding free energy for CDK7 arises from major difference in the active site of CDK2 and CDK7 at so-called Lys89-pocket of CDK2. As we discussed above, the corresponding binding site is predominantly surrounded by Thr96, Val100, and Pro310, which make this pocket of greater hydrophobic character than the Lys89-pocket of CDK2. Hence, the piperazine part of CP3 approaches to the hydrophobic pocket of CDK7 to form stronger hydrophobic contact with Thr96 (−2.16 kcal mol−1) and Val100 (−1.02 kcal mol−1). Whereas in case of CDK2, the corresponding residues Gln85 (−0.80 kcal mol−1) and Lys89 (−0.25 kcal mol−1) make energetically weak contact with CP3. The graphical (Fig. 6F) and energetic analyses (Fig. 8C) illustrate that piperazine group of CP3 is not well accommodated in Lys89-pocket and is propelled to upward direction. These drastic conformational changes in CP3 binding are mainly originated from severe intrusion of a positively charged Lys89 side chain. Thus, this repulsion between the piperazine group with positive charge and Lys89 ultimately results in the weakening of overall binding interactions in the CDK2–CP3 complex. A comparison of ΔGligand–residues between CP1–CDK2 and CP3–CDK2 complexes (Fig. 8E) explains the effect of ligand displacement on the overall ligand–receptor binding interactions. As a result of comparison, we identified four key residues Phe80, Gln85, Lys89, and Asp145 strongly interacting in CP1–CDK2 compared to the CP2–CDK2 complex.
Conclusions
The present work has provided a detailed perspective from an atomic viewpoint regarding the selectivity aspect of three ligands CP1, CP2, and CP3 towards CDK2 and CDK7. In particular, we characterized underlying intermolecular interactions that play major role in binding and specificity of CDK2 and CDK7 inhibitors. The selectivity mechanism of three 2-anilino-4-(thiazol-5-yl)-pyrimidines was examined for binding to CDK2 and CDK7 using an arsenal of computational techniques. EasyMIFs enabled us to characterize the binding site surface of these two closely related isoforms based on their ligand recognition properties. MESP and structure based pharmacophore analysis were carried out to understand and rationally analyze the role of negative charges on CP1 in determining its selectivity towards CDK2 over CDK7. Similarly, the role of positive charge on CP3 in determining CDK7 selectivity has been discussed in detail. Binding free energy calculation and decomposition to per-residue contribution indicate that the presence of Lys89 in CDK2 plays a significant role by directly affecting the conformation of negatively charged ligand CP1 in active site and consequently, form a pair of hydrogen bonds. Through a series of analyses, it was possible to elucidate the mechanism by which the sulfonamide containing substituents provide interaction centers that enhance its affinity towards CDK2 than CDK7. CP1 was also found to be capable of establishing strong vdW contact with Asp145, located in ribose binding site of CDK2. These observations have been elucidated to be crucial in determining its selectivity towards CDK2. In comparison to CP1, the inhibitor CP3 was found to exhibit enhanced affinity for CDK7 than CDK2. Residues, particularly Thr96 and Val100, in the solvent exposed region are found to contribute favorably with CP3 in CDK7 while the corresponding residues Gln85 and Lys89 in CDK2 presented strong stress in accommodating positively charged group of CP3. The distinct behavior of the solvent exposed region in CDK2 for two structurally similar ligands CP1 and CP3 and the unique mode of interaction with conserved residues Asp145 (CDK2) and Asp155 (CDK7) further broaden the diverse nature of two homologous CDKs. Moreover, the functional and structural information obtained from the current study are expected to be valuable for structure guided drug designing of future ligands.Competing interests
The authors declare that they have no competing interests.Acknowledgements
Chinese Government would be acknowledged for providing full scholarship for PhD studies to Mr Tahir Ali Chohan.References
- J. Zhang, P. L. Yang and N. S. Gray, Nat. Rev. Cancer, 2009, 9, 28–39 CrossRef CAS PubMed.
- M. Malumbres and M. Barbacid, Trends Biochem. Sci., 2005, 30, 630–641 CrossRef CAS PubMed.
- P. M. Clare, R. A. Poorman, L. C. Kelley, K. D. Watenpaugh, C. A. Bannow and K. L. Leach, J. Biol. Chem., 2001, 276, 48292–48299 CAS.
- R. P. Fisher, J. Cell Sci., 2005, 118, 5171–5180 CrossRef CAS PubMed.
- D. O. Morgan, Annu. Rev. Cell Dev. Biol., 1997, 13, 261–291 CrossRef CAS PubMed.
- S. Lapenna and A. Giordano, Nat. Rev. Drug Discovery, 2009, 8, 547–566 CrossRef CAS PubMed.
- M. Dickson and G. Schwartz, Curr. Oncol., 2009, 16, 36 CAS.
- T. A. Chohan, H. Qian, Y. Pan and J.-Z. Chen, Curr. Med. Chem., 2015, 22, 237–263 CrossRef CAS PubMed.
- A. Li and J. J. Blow, Nat. Cell Biol., 2001, 3, E182–E184 CrossRef CAS PubMed.
- G. Lolli, E. D. Lowe, N. R. Brown and L. N. Johnson, Structure, 2004, 12, 2067–2079 CrossRef CAS PubMed.
- M. K. Dreyer, D. R. Borcherding, J. A. Dumont, N. P. Peet, J. T. Tsay, P. S. Wright, A. J. Bitonti, J. Shen and S.-H. Kim, J. Med. Chem., 2001, 44, 524–530 CrossRef CAS PubMed.
- S. Wang, C. Meades, G. Wood, A. Osnowski, S. Anderson, R. Yuill, M. Thomas, M. Mezna, W. Jackson and C. Midgley, J. Med. Chem., 2004, 47, 1662–1675 CrossRef CAS PubMed.
- K. F. Byth, J. D. Culshaw, S. Green, S. E. Oakes and A. P. Thomas, Bioorg. Med. Chem. Lett., 2004, 14, 2245–2248 CrossRef CAS PubMed.
- R. Hoessel, S. Leclerc, J. A. Endicott, M. E. Nobel, A. Lawrie, P. Tunnah, M. Leost, E. Damiens, D. Marie and D. Marko, Nat. Cell Biol., 1999, 1, 60–67 CrossRef CAS PubMed.
- K. S. Kim, S. D. Kimball, R. N. Misra, D. B. Rawlins, J. T. Hunt, H.-Y. Xiao, S. Lu, L. Qian, W.-C. Han and W. Shan, J. Med. Chem., 2002, 45, 3905–3927 CrossRef CAS PubMed.
- S. Wang, G. Griffiths, C. A. Midgley, A. L. Barnett, M. Cooper, J. Grabarek, L. Ingram, W. Jackson, G. Kontopidis and S. J. McClue, Chem. Biol., 2010, 17, 1111–1121 CrossRef CAS PubMed.
- S. K. Tripathi, R. Muttineni and S. K. Singh, J. Theor. Biol., 2013, 334, 87–100 CrossRef CAS PubMed.
- M. P. Mazanetz, O. Ichihara, R. Law and M. Whittaker, J. Cheminf., 2011, 3, 2 CAS.
- S. K. Tripathi and S. K. Singh, Mol. BioSyst., 2014, 10, 2189–2201 RSC.
- J. Zou, H.-Z. Xie, S.-Y. Yang, J.-J. Chen, J.-X. Ren and Y.-Q. Wei, J. Mol. Graphics Modell., 2008, 27, 430–438 CrossRef CAS PubMed.
- J. Alzate-Morales and J. Caballero, J. Chem. Inf. Model., 2009, 50, 110–122 CrossRef PubMed.
- S. K. Tripathi, S. K. Singh, P. Singh, P. Chellaperumal, K. K. Reddy and C. Selvaraj, J. Mol. Recognit., 2012, 25, 504–512 CrossRef CAS PubMed.
- SYBYL-X 1.3. Molecular Modeling Software, Tripose Inc., South Hanley Road, St., Louis MO 631444, USA, 1699 Search PubMed.
- A. N. Jain, J. Comput. – Aided Mol. Des., 1996, 10, 427–440 CrossRef CAS PubMed.
- A. N. Jain, J. Med. Chem., 2003, 46, 499–511 CrossRef CAS PubMed.
- P. A. Holt, J. B. Chaires and J. O. Trent, J. Chem. Inf. Model., 2008, 48, 1602–1615 CrossRef CAS PubMed.
- Y. Lin, S. Yoo and R. Sanchez, Bioinformatics, 2012, 28, 1172–1173 CrossRef CAS PubMed.
- D. Ghersi and R. Sanchez, Bioinformatics, 2009, 25, 3185–3186 CrossRef CAS PubMed.
- D. Ghersi and R. Sanchez, J. Struct. Funct. Genomics, 2011, 12, 109–117 CrossRef CAS PubMed.
- M. Frisch, G. Trucks, H. B. Schlegel, G. Scuseria, M. Robb, J. Cheeseman, G. Scalmani, V. Barone, B. Mennucci and G. Petersson, Gaussian 09, Revision C. 01, Gaussian. Inc., Wallingford, CT, 2009 Search PubMed.
- J. J. Stewart, J. Comput. Chem., 1989, 10, 209–220 CrossRef CAS.
- A. D. Becke, J. Chem. Phys., 1993, 98, 5648–5652 CrossRef CAS.
- V. Barone and M. Cossi, J. Phys. Chem. A, 1998, 102, 1995–2001 CrossRef CAS.
- M. Cossi, N. Rega, G. Scalmani and V. Barone, J. Comput. Chem., 2003, 24, 669–681 CrossRef CAS PubMed.
- E. Glendening, J. Badenhoop, A. Reed, J. Carpenter, J. Bohmann, C. Morales and F. Weinhold, Theoretical Chemistry Institute, University of Wisconsin, Madison, WI, 2001, vol. 2, pp. 91–104 Search PubMed.
- D. Case, T. Darden, T. E. Cheatham III, C. Simmerling, J. Wang, R. Duke, R. Luo, R. Walker, W. Zhang and K. Merz, AMBER 12, University of California, San Francisco, 2012 Search PubMed.
- D. A. Case, T. E. Cheatham, T. Darden, H. Gohlke, R. Luo, K. M. Merz, A. Onufriev, C. Simmerling, B. Wang and R. J. Woods, J. Comput. Chem., 2005, 26, 1668–1688 CrossRef CAS PubMed.
- W. L. Jorgensen, J. Chandrasekhar, J. D. Madura, R. W. Impey and M. L. Klein, J. Chem. Phys., 1983, 79, 926–935 CrossRef CAS.
- Y. Duan, C. Wu, S. Chowdhury, M. C. Lee, G. Xiong, W. Zhang, R. Yang, P. Cieplak, R. Luo and T. Lee, J. Comput. Chem., 2003, 24, 1999–2012 CrossRef CAS PubMed.
- J. Wang, R. M. Wolf, J. W. Caldwell, P. A. Kollman and D. A. Case, J. Comput. Chem., 2004, 25, 1157–1174 CrossRef CAS PubMed.
- H. J. Berendsen, J. P. M. Postma, W. F. van Gunsteren, A. DiNola and J. Haak, J. Chem. Phys., 1984, 81, 3684–3690 CrossRef CAS.
- J.-P. Ryckaert, G. Ciccotti and H. J. Berendsen, J. Comput. Phys., 1977, 23, 327–341 CrossRef CAS.
- T. Darden, D. York and L. Pedersen, J. Chem. Phys., 1993, 98, 10089–10092 CrossRef CAS.
- F. Fogolari, A. Brigo and H. Molinari, Biophys. J., 2003, 85, 159–166 CrossRef CAS PubMed.
- W. Rocchia, E. Alexov and B. Honig, J. Phys. Chem. B, 2001, 105, 6507–6514 CrossRef CAS.
- A. Onufriev, D. Bashford and D. A. Case, Proteins: Struct., Funct., Bioinf., 2004, 55, 383–394 CrossRef CAS PubMed.
- J. Weiser, P. S. Shenkin and W. C. Still, J. Comput. Chem., 1999, 20, 217–230 CrossRef CAS.
- Y. Li, J. Zhang, D. He, Q. Liang and Y. Wang, J. Mol. Model., 2012, 18, 1907–1916 CrossRef CAS PubMed.
- S.-Y. Lu, Y.-J. Jiang, J.-W. Zou and T.-X. Wu, Amino Acids, 2012, 43, 267–277 CrossRef CAS PubMed.
- C. I. Bayly, P. Cieplak, W. Cornell and P. A. Kollman, J. Phys. Chem., 1993, 97, 10269–10280 CrossRef CAS.
- R. C. Rizzo, J. Tirado-Rives and W. L. Jorgensen, J. Med. Chem., 2001, 44, 145–154 CrossRef CAS PubMed.
- G. Wolber and T. Langer, J. Chem. Inf. Model., 2005, 45, 160–169 CrossRef CAS PubMed.
- K. D. Freeman-Cook, C. Autry, G. Borzillo, D. Gordon, E. Barbacci-Tobin, V. Bernardo, D. Briere, T. Clark, M. Corbett, J. Jakubczak, S. Kakar, E. Knauth, B. Lippa, M. J. Luzzio, M. Mansour, G. Martinelli, M. Marx, K. Nelson, J. Pandit, F. Rajamohan, S. Robinson, C. Subramanyam, L. Wei, M. Wythes and J. Morris, J. Med. Chem., 2010, 53, 4615–4622 CrossRef CAS PubMed.
Footnote |
| † Electronic supplementary information (ESI) available: Superimposition of docked compounds CP1, CP2 and CP3 within the ATP binding pocket of CDK7. Multiple sequence alignments of CDK1, CDK2, CDK3, CDK4, and CDK7. Structural alignment of the CP1–CDK2 docking model and crystal structures of CP1–CDK2 and CP3–CDK2 complexes. Top ranking CMET probes clusters, HOMO–LUMO plots for compounds CP1, CP2 and CP3, distance plots, H-bond interaction analysis from MD trajectories. See DOI: 10.1039/c5mb00630a |
| This journal is © The Royal Society of Chemistry 2016 |