Genetic analysis of the clonal stability of Chinese hamster ovary cells for recombinant protein production†
Hongwen
Li
a,
Kaiming
Chen
a,
Zhe
Wang
a,
Dong
Li
a,
Jiannan
Lin
a,
Chao
Yu
b,
Fang
Yu
b,
Xin
Wang
a,
Lei
Huang
a,
Cizhong
Jiang
a,
Hua
Gu
a and
Jianmin
Fang
*acd
aSchool of Life Sciences and Technology, Tongji University, Shanghai, China. E-mail: jfang@tongji.edu.cn
bRC Biotechnologies, Ltd, Yantai, Shandong, China
cTongji University Suzhou Institute, Suzhou, Jiangsu, China
dCollaborative Innovation Center for Biotherapy, West China Hospital, Sichuan University, Chengdu, Sichuan, China
First published on 6th November 2015
Abstract
Chinese hamster ovary (CHO) cells are frequently used for the production of recombinant proteins for therapeutical applications. However, the recombinant protein expression level of CHO cells may reduce during long-term culture. The physiological changes related to the stability of expression were not well understood. In this study, we performed a series of genetic analysis on stable and unstable clonal derived populations. Transcriptome analysis revealed that a large number of differentially expressed genes (>100) were identified in the unstable population between early and late generations, while only a few differentially expressed genes were found in the stable population, suggesting that the gene expression change is related to the instability of recombinant protein production. On the other hand, no significant differences were found in promoter methylation or gene copy numbers in the unstable population. Taken together, our data help better understand the molecular mechanism underlying the stability of recombinant protein production in CHO cells.
Introduction
Chinese hamster ovary (CHO) cells are the most widely used mammalian cell lines for the production of recombinant proteins, such as monoclonal antibodies, Fc fusion proteins, and cytokines, which require proper folding and glycosylation for their full biological activity.1,2 Many CHO cell lines employ dihydrofolate reductase (DHFR) to amplify the gene copy number to increase the expression level of recombinant proteins.3,4 This is achieved by treating the CHO cells with methotrexate (MTX), a DHFR inhibitor. As a result, the region containing the DHFR gene is amplified to many copies.3,5 One unsolved problem is the instability of production using the gene amplification system, especially over long-term culture, leading to loss of productivity.6,7 Constructing a stable CHO cell line for recombinant protein expression could be time-consuming (over three or six months) and labor intensive.2,6,8Chromosome instability is one of the major reasons for the instability of production cell lines.9 During MTX treatment the CHO cells may experience severe genetic rearrangement10,11 and intraclonal heterogeneity is one of the inherent characteristics for CHO cell lines.12,13 The chromosomes of CHO cells are highly heterogenic14,15 and the landing site of the heterologous gene in chromosome is related to the stability of amplified gene caused by MTX selection.16–20 In addition to the decrease in gene copy number,21 it is suggested that the loss of production from CHO cell lines during long-term culture is also attributed to the modification of the promoter and histone acetylation.6,22
High-throughput mRNA sequencing (RNA-seq) offers the ability to measure global gene expression in a single assay.23–27 It could be used as a tool to better understand the molecular mechanisms of the instability of recombinant protein production in CHO cells, especially considering that the genomic sequence of the CHO cell line had been completed.28
In this study, two clonal derived populations, one stable and one unstable for recombinant protein production, were isolated from a single population of CHO cells treated with MTX. A series of genetic analyses were conducted in order to better understand the molecular mechanism of the instability of CHO cells for recombinant protein production during long term culture.
Results
Selection of stable and unstable cell lines
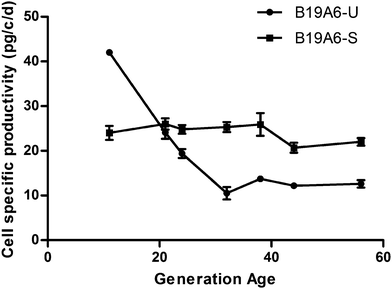
The DHFR deficient CHO cells (DG44) were transfected with a Transmembrane Activator and CAML Interactor Fc (TACI-Fc) fusion protein gene and the DHFR gene. Six clonal derived populations with the highest productivity of the TACI-Fc protein (>4 pg per cell per day) were selected for further analysis. After MTX treatment, the TACI-Fc productivity of one population increased from 4.2 pg per cell per day to 18.7 pg per cell per day. This population was named B19A6 and was selected for sub-clonal screening. After multiple selections, one sub-clonal population was identified to have a stable production of TACI-Fc during long-term culture (∼50 generations). The TACI-Fc expression level ranged from 24 pg per cell per day (13th generation) to 22 pg per cell per day (56th generation). This population was defined as a stable cell line and named B19A6-S. A second sub-clonal population was identified to have a reduced protein production, ranging from 42.0 pg per cell per day (11th generation) to 10.5 pg per cell per day (32nd generation). This population was defined as unstable and named B19A6-U. No significant decrease of protein production from the 32nd (10.5 pg per cell per day) to 56th generation (12.6 pg per cell per day) was observed in B19A6-U. This stable production in later generations could be caused by clearing out the unstable chromosomal regions or entire chromosomes, which has been reported as a main driver in MTX amplified cells.9,19 The selection process is illustrated in Fig. 1, and the stability of cell specific productivity of the two clonal derived populations is shown in Fig. 2.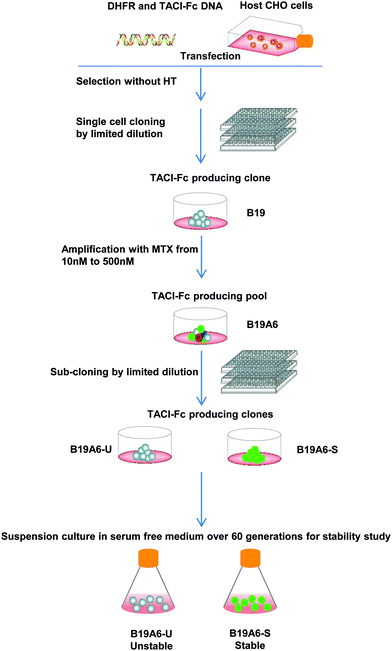 | ||
| Fig. 1 Flow chart of the experimental process of transfection, selection, cloning, amplification, and sub-cloning. Dots with different colors represent the heterogeneous populations in B19A6. | ||
CAG promoter methylation status
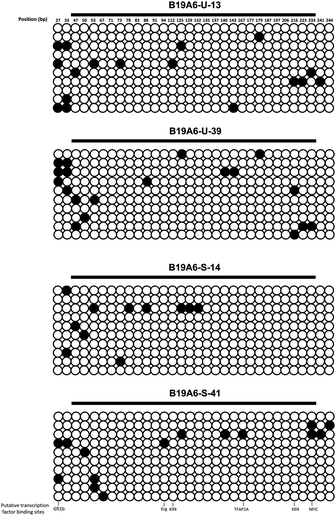
DNA methylation has been known to correlate with inhibition of gene expression.29 Recent studies have shown that the loss of productivity in recombinant CHO cell lines is partially due to promoter methylation, causing gene silencing.6,30,31 The methylation status of the CAG promoter, which was used to drive high levels of gene expression of the TACI-Fc protein, was investigated and compared in both B19A6-S and B19A6-U cell lines. Two sample groups were used in each cell line: generation 13 of B19A6-U (B19A6-U-13, high production), generation 39 B19A6-U (B19A6-U-39, low production), generation 14 of B19A6-S (B19A6-S-14) and generation 41 of B19A6-S (B19A6-S-41). Ten individual clones from each group were randomly selected and the methylation of 32 CpG nucleotides was analyzed by bisulfite sequencing PCR (BSP). The average methylation levels for the four groups (B19A6-U-13, B19A6-U-39, B19A6-S-14 and B19A6-S-41) were: 5.3 ± 4.4%, 5.9 ± 3.3%, 3.4 ± 5.3%, and 4.7 ± 4.7%, respectively (Fig. 3). No significant differences were found between any groups (P = 0.74 between B19A6-U-13 and B19A6-U-39; P = 0.60 between B19A6-S-14 and B19A6-S-41). We further analysed the putative transcription factor binding sites using the searching tool of Jaspar database (http://jaspar.genereg.net/cgi-bin/jaspar_db.pl). No significant changes were found on the methylation level of CpG sites that were co-localized with putative transcription factor binding sites. These results suggest that methylation of the CAG promoter was not involved in the levels of TACI-Fc fusion protein expression.Gene copy number of cell lines
Another major cause of instability for protein production is the loss of gene copy numbers.6,21 To test if they were involved in the production level and stability of the TACI-Fc protein, the gene copy numbers of the two cell lines were assayed using qPCR. Our results showed that the gene copy numbers for B19A6-U-13 and B19A6-U-39 remained at the same level (P = 0.96), being 170.11 ± 13.79 and 168.83 ± 18.45, respectively. However, compared with the gene copy number of B19A6-S-14 (102.36 ± 3.56), the gene copy number of B19A6-S-41 (79.40 ± 6.68) showed a statistically significant decrease (P = 0.015) (Fig. 4). Using the β-actin and GADPH as the reference gene, respectively, the results of the relative copy number of the TACI region showed no significant difference (P > 0.05) (see Fig. S1, ESI†). Furthermore, the relative quantity PCR was employed to analyze changes in the gene copy number of the CAG promoter, TACI, Fc and the downstream sequence of Fc in high generation cells relative to low generation cells. No significant difference was found in all gene regions (see Fig. S2, ESI†).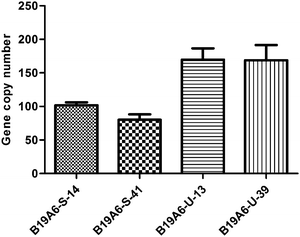 | ||
| Fig. 4 Relative gene copy number of the unstable cell line (B19A6-U-13 and B19A6-U-39) and the stable cell line (B19A6-S-14 and B19A6-S-41). β-actin was used for normalization. | ||
Transcriptome analysis of the stable and unstable cell lines
To further understand the mechanism of the stability for protein expression, RNA-seq was used to analyze the gene expression differences among different groups. As shown in Table S1 (ESI†), the greatest degree of differentially-expressed genes was seen between B19A6-U-13 and B19A6-U-39. Compared to B19A6-U-13, 104 genes were down-regulated and 12 were up-regulated in B19A6-U-39. In contrast, only 11 genes were down-regulated and two genes were up-regulated in B19A6-S-41, compared to B19A6-S-14. In addition, compared to B19A6-S-14, 20 genes were down-regulated and 31 genes were up-regulated in B19A6-U-13.The RNAseq analysis showed that the mRNA level of TACI-Fc of B19A6-U-39 was reduced to 57 percent of the B19A6-U-13 expression value. The TACI-Fc mRNA level between low and high generations of the stable cell line B19A6-S did not change significantly.
Verification of RNA-seq
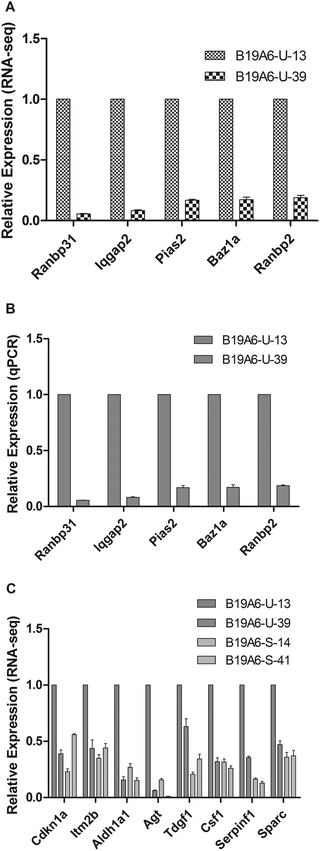
To validate the RNA-seq results, qPCR was performed to test the expression levels of the five genes that were most significantly changed between B19A6-U-13 and B19A6-U-39 (Fig. 5A). The house-keeping gene β-actin was used as a control. As shown in Fig. 5B, qPCR results showed a similar trend as RNA-seq, suggesting that RNA-seq is a useful tool to study the gene expression at a large scale.Gene ontology analysis of differentially expressed genes
The program DAVID,32–34 an online software for gene ontology (GO) analysis, was used to further investigate the physiological functions of the differentially expressed genes. Our results showed that among the 104 down-regulated genes between B19A6-U-13 and B19A6-U-39, the most enriched biological processes were clustered in steroid/sterol metabolic processes, macromolecule catabolic processes, glycosaminoglycan metabolic processes and mRNA transportation and localization processes (see Table S1, ESI†). Three down-regulated genes G3bp2 (GTPase activating protein (SH3 domain) binding protein 2), Ranbp2 (RAN binding protein 2) and Nxf7 (nuclear RNA export factor 7) were enriched in the mRNA transportation process (P = 0.055). The decrease of G3bp2, Ranbp2, and Nxf7 was 64%, 82%, and 88%, respectively. The molecular functions of these genes were enriched in metal ion binding, cation binding and enzyme inhibitor activity (Fig. 6). There were no enriched biological processes for regulated genes in the stable cell line (see Table S1, ESI†).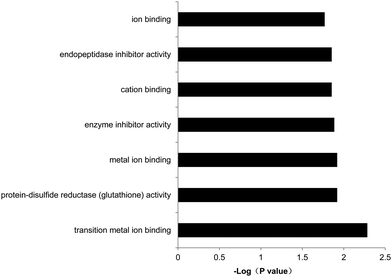 | ||
| Fig. 6 Gene ontology (GO) analysis of the molecular function of the differentially expressed genes between B19A6-U-39 and B19A6-U-13. X-axis shows the enrichment p value of each gene (−log base 10). | ||
Furthermore, comparison between the stable clonal derived populations B19A6-S-14 and the unstable clonal derived populations B19A6-U-13 showed eight up-regulated genes (Agt, Csf1, Cdkn1a, Tdgf1, Sparc, Aldh1a1, Itm2b and Serpinf1) in B19A6-U-13. These genes were involved in either cell proliferation or apoptosis. Agt, Csf1, Cdkn1a, Tdgf1 and SPARC are involved in the PI3K-Akt, MAPK or Ras/Raf signalling pathway.35–37 Aldh1a1 is related to the retinoic acid signalling pathway.38 Serpinf1 promotes proliferation activity in tumor cells.39 Except for Itm2b, which promotes apoptosis activity,40 all the other up-regulated genes were shown to promote cell survival and proliferation, which may lead to decrease of the expression of exogenous recombinant genes to save energy. Interestingly, the expression level of these genes in B19A6-U-39 was similar to that of B19A6-S-14 and maintains a relatively low level in B19A6-S-41 (Fig. 5C).
Conclusions
The stability of gene expression in mammalian cell lines is important for the production of recombinant antibodies and antibody-fusion proteins.2,41 The majority of these proteins are expressed in CHO cells. We employed a series of genetic analyses to gain insights into its molecular mechanism. The increased copy number in the unstable chromosome integrations is prone to loss when cells grow in medium without MTX.9 We found that the gene copy number of B19A6-U was not significantly changed during passage in the absence of MTX. This is consistent with a previous report,11 in which the unstable cells have a significant decrease in GOI (gene of interest) mRNA levels with little change in the gene copy number. Our transcriptome analysis revealed that more genes were down-regulated in the unstable cell lines than the stable cell line. GO analysis and KEGG pathway enrichment, such as the metabolism of fatty acids (see Table S2, ESI†), further showed that these down-regulated genes were mostly involved in metabolism, suggesting that a metabolic slowdown might be the major phenomenon accompanied by production reduction. The down-regulation of metabolism related genes are more obvious in three RNA transportation related genes: G3bp2, Ranbp2, and Nxf7. G3bp2 is one of the RNA binding proteins (RBPs) that is important in controlling of mRNA translation and stability,42–44 formation of stress granule,45,46 and regulation cell cycle.47,48 Ranbp2 acts as a regulator of nucleocytoplasmic transport.49,50 Nxf7 belongs to the nuclear RNA export factor (NXF) family proteins and is involved in mRNA localization in cytoplasm, degradation and sorting of mRNAs.51–53 Down-regulation of these three genes would interrupt the mRNA metabolism and decrease the TACI-Fc mRNA abundance, resulting in the reduction of productivity.GO analysis revealed that differences in gene expression between B19A6-U-13 and B19A6-S-14 were mostly related to the regulation of cell proliferation and apoptosis. Meanwhile the cell specific productivity of B19A6-U was not further decreased from the 32nd to 56th generation, suggesting that the up-regulation of cell proliferation related genes might be the major cause of instability of recombinant gene production.
A previous study suggests that CHO cells do not undergo further chromosome rearrangement during culture in the absence of MTX.11 On the other hand, as a type of immortalized cells, CHO cells exhibit cell to cell chromosome variations,54,55 especially from cells treated with MTX.9,19 The chromosome instability might be the original force to drive the differential gene expression and decrease productivity in unstable clonal populations.
It has been reported that the loss of gene copy number correlates with the instability of protein production.6 Surprisingly, we observed that the gene copy number remained unchanged in the unstable cell line, but there was a slight decrease in the stable cell line. This decrease does not influence the mRNA abundance of TACI-Fc, suggesting that these genes that are located in non-transcribed integration sites might be lost in high generation cells of the stable cell line.
This report provides a systematic study of the mechanism of protein expression stability of CHO cells. Although this study probably could not completely solve the issue of CHO stability, it will help establish better and more stable cell lines for production of antibodies and other recombinant proteins.
Experimental
Materials and methods
![[thin space (1/6-em)]](https://www.rsc.org/images/entities/char_2009.gif) :
:![[thin space (1/6-em)]](https://www.rsc.org/images/entities/char_2009.gif) 2000) (Bethyl laboratories, Montgomery, TX) was used as the primary antibody for coating and a horse radish peroxidase (HRP)-conjugated goat anti-human IgG-Fc antibody (1
2000) (Bethyl laboratories, Montgomery, TX) was used as the primary antibody for coating and a horse radish peroxidase (HRP)-conjugated goat anti-human IgG-Fc antibody (1![[thin space (1/6-em)]](https://www.rsc.org/images/entities/char_2009.gif) :
:![[thin space (1/6-em)]](https://www.rsc.org/images/entities/char_2009.gif) 5000) (Bethyl laboratories) was used as the secondary antibody for detection. ABST peroxidase substrate solution A (KPL, Gaithersburg, MD) and peroxidase substrate solution B (KPL) were mixed together. The mixed solution was used as the substrate and the absorption was measured at 405 nm on a microplate reader. 10% of the total clonal derived populations with the highest OD values were picked up and seeded in 6-well plates. Then the cell specific productivity for each population was measured using the equation qp = Δp/Δt × ln(Ct/C0)/ΔC, where qp represents cell specific productivity of TACI-Fc; Δp represents the change in TACI-Fc concentration; Δt represents time interval; ΔC represents the change of viable cell density from time 0 to time t; Ct represents viable cell density at time t and C0 represents viable cell density at time 0. Populations with the highest specific productivity were selected for further gene amplification. Viable cell density was measured by a dye exclusion method. Cells were first stained with 0.2% trypan blue, which stains dead cells only, for few seconds. Cells were then examined and counted using a microscope.
5000) (Bethyl laboratories) was used as the secondary antibody for detection. ABST peroxidase substrate solution A (KPL, Gaithersburg, MD) and peroxidase substrate solution B (KPL) were mixed together. The mixed solution was used as the substrate and the absorption was measured at 405 nm on a microplate reader. 10% of the total clonal derived populations with the highest OD values were picked up and seeded in 6-well plates. Then the cell specific productivity for each population was measured using the equation qp = Δp/Δt × ln(Ct/C0)/ΔC, where qp represents cell specific productivity of TACI-Fc; Δp represents the change in TACI-Fc concentration; Δt represents time interval; ΔC represents the change of viable cell density from time 0 to time t; Ct represents viable cell density at time t and C0 represents viable cell density at time 0. Populations with the highest specific productivity were selected for further gene amplification. Viable cell density was measured by a dye exclusion method. Cells were first stained with 0.2% trypan blue, which stains dead cells only, for few seconds. Cells were then examined and counted using a microscope.
| Gene name | Sequence of primers |
|---|---|
| CAG methylation detection | Outside F: GTAGTTATTGTTTTTTATGGTAAT |
| Outside R: TAATAAAACAACACAATAACCAACAC | |
| Inside F: GGGATTTTTTTTGTTTTAAATTTGTG | |
| Inside R: ACATAAACATAATTAACAAAAACTC | |
| Ranbp3l | F: TGGTCACAGTGCATCCAAAT |
| R: CATCTCGATGTTGCCTCTGA | |
| Iqgap2 | F: CCCAGCACTACCAGGATGTT |
| R: GACCAGTGAAACCCATTGCT | |
| Pias2 | F: CCACGGACACTTGAAGGACT |
| R: TGAAGCAGCACAGAACCAAC | |
| Baz1a | F: GATCGCAGTGTGATGTGGTC |
| R: TTTGGTCGACATTCTGGACA | |
| Ranbp2 | F: CAAGCCAAGGAGAAAGCAAG |
| R: TGTTCCAAACACAGCTGCTC |
For RNA-Seq sequence reads, one base was trimmed from the 5′ end and the reads were aligned to the CHO genome database and transcriptome using the TopHat program (version 2.0.4).25 The Refseq gene annotation file was also provided for TopHat. The Cuffdiff program58 was used to calculate the relative abundance of each gene. A gene was defined to be differentially expressed with statistical significance if the q-value calculated by Cuffdiff was less than 0.05. Gene ontology (GO) analysis was performed using the online program DAVID32–34 (http://david.abcc.ncifcrf.gov/).
Acknowledgements
This study was supported by National Science and Technology Key Projects for “Major Drug Innovation and Development”, grant #2013ZX09401002, National High Technology R&D Program (863 Program) of China, grant #2012AA02A302, and National Science Foundation of China (NSFC), grant #1470896.Notes and references
- S. Hammond and K. H. Lee, Biotechnol. Bioeng., 2012, 109, 528–535 CrossRef CAS PubMed.
- F. M. Wurm, Nat. Biotechnol., 2004, 22, 1393–1398 CrossRef CAS PubMed.
- S. J. Kim and G. M. Lee, Biotechnol. Bioeng., 1999, 64, 741–749 CrossRef CAS PubMed.
- W. F. Flintoff, E. Livingston, C. Duff and R. G. Worton, Mol. Cell. Biol., 1984, 4, 69–76 CrossRef CAS PubMed.
- R. J. Kaufman, P. A. Sharp and S. A. Latt, Mol. Cell. Biol., 1983, 3, 699–711 CrossRef CAS PubMed.
- M. Kim, P. M. O'Callaghan, K. A. Droms and D. C. James, Biotechnol. Bioeng., 2011, 108, 2434–2446 CrossRef CAS PubMed.
- L. A. Bailey, D. Hatton, R. Field and A. J. Dickson, Biotechnol. Bioeng., 2012, 109, 2093–2103 CrossRef CAS PubMed.
- R. J. Boado, E. K. Hui, J. Z. Lu and W. M. Pardridge, Biotechnol. Bioeng., 2011, 108, 186–196 CrossRef CAS PubMed.
- F. M. Wurm and C. J. Petropoulos, Biologicals: journal of the International Association of Biological Standardization, 1994, 22, 95–102 CAS.
- N. S. Kim, T. H. Byun and G. M. Lee, Biotechnol. Prog., 2001, 17, 69–75 CrossRef CAS PubMed.
- J. Chusainow, Y. S. Yang, J. H. Yeo, P. C. Toh, P. Asvadi, N. S. Wong and M. G. Yap, Biotechnol. Bioeng., 2009, 102, 1182–1196 CrossRef CAS PubMed.
- D. S. Abramian and O. K. Glebov, Tsitologiia, 1981, 23, 1031–1040 CAS.
- W. Pilbrough, T. P. Munro and P. Gray, PLoS One, 2009, 4, e8432 Search PubMed.
- R. G. Worton, C. C. Ho and C. Duff, Somatic Cell Genet., 1977, 3, 27–45 CrossRef CAS PubMed.
- C. S. Kaas, C. Kristensen, M. J. Betenbaugh and M. R. Andersen, BMC Genomics, 2015, 16, 160 CrossRef PubMed.
- J. H. Nunberg, R. J. Kaufman, R. T. Schimke, G. Urlaub and L. A. Chasin, Proc. Natl. Acad. Sci. U. S. A., 1978, 75, 5553–5556 CrossRef CAS.
- R. J. Kaufman, P. C. Brown and R. T. Schimke, Proc. Natl. Acad. Sci. U. S. A., 1979, 76, 5669–5673 CrossRef CAS.
- M. G. Pallavicini, P. S. DeTeresa, C. Rosette, J. W. Gray and F. M. Wurm, Mol. Cell. Biol., 1990, 10, 401–404 CrossRef CAS PubMed.
- F. M. Wurm, M. G. Pallavicini and R. Arathoon, Dev. Biol. Stand., 1992, 76, 69–82 CAS.
- T. Yoshikawa, F. Nakanishi, S. Itami, D. Kameoka, T. Omasa, Y. Katakura, M. Kishimoto and K. Suga, Cytotechnology, 2000, 33, 37–46 CrossRef CAS PubMed.
- T. F. Beckmann, O. Kramer, S. Klausing, C. Heinrich, T. Thute, H. Buntemeyer, R. Hoffrogge and T. Noll, Appl. Microbiol. Biotechnol., 2012, 94, 659–671 CrossRef CAS PubMed.
- V. Paredes, J. S. Park, Y. Jeong, J. Yoon and K. Baek, Biotechnol. Lett., 2013, 35, 987–993 CrossRef CAS PubMed.
- S. Hammond, J. C. Swanberg, S. W. Polson and K. H. Lee, Biotechnol. Bioeng., 2012, 109, 1371–1375 CrossRef CAS PubMed.
- J. Becker, M. Hackl, O. Rupp, T. Jakobi, J. Schneider, R. Szczepanowski, T. Bekel, N. Borth, A. Goesmann, J. Grillari, C. Kaltschmidt, T. Noll, A. Puhler, A. Tauch and K. Brinkrolf, J. Biotechnol., 2011, 156, 227–235 CrossRef CAS PubMed.
- C. Trapnell, A. Roberts, L. Goff, G. Pertea, D. Kim, D. R. Kelley, H. Pimentel, S. L. Salzberg, J. L. Rinn and L. Pachter, Nat. Protoc., 2012, 7, 562–578 CrossRef CAS PubMed.
- Z. Wang, M. Gerstein and M. Snyder, Nat. Rev. Genet., 2009, 10, 57–63 CrossRef CAS PubMed.
- J. C. Yee, K. F. Wlaschin, S. H. Chuah, P. M. Nissom and W. S. Hu, Biotechnol. Bioeng., 2008, 101, 1359–1365 CrossRef CAS PubMed.
- X. Xu, H. Nagarajan, N. E. Lewis, S. Pan, Z. Cai, X. Liu, W. Chen, M. Xie, W. Wang, S. Hammond, M. R. Andersen, N. Neff, B. Passarelli, W. Koh, H. C. Fan, J. Wang, Y. Gui, K. H. Lee, M. J. Betenbaugh, S. R. Quake, I. Famili, B. O. Palsson and J. Wang, Nat. Biotechnol., 2011, 29, 735–741 CrossRef CAS PubMed.
- Z. Siegfried and I. Simon, Wiley Interdiscip. Rev.: Syst. Biol. Med., 2010, 2, 362–371 CrossRef CAS PubMed.
- Y. Yang, Mariati, J. Chusainow and M. G. Yap, J. Biotechnol., 2010, 147, 180–185 CrossRef CAS PubMed.
- A. Osterlehner, S. Simmeth and U. Gopfert, Biotechnol. Bioeng., 2011, 108, 2670–2681 CrossRef CAS PubMed.
- G. Dennis, Jr., B. T. Sherman, D. A. Hosack, J. Yang, W. Gao, H. C. Lane and R. A. Lempicki, Genome Biol., 2003, 4, P3 CrossRef.
- D. W. Huang, B. T. Sherman and R. A. Lempicki, Nat. Protoc., 2009, 4, 44–57 CrossRef CAS PubMed.
- D. W. Huang, B. T. Sherman and R. A. Lempicki, Nucleic Acids Res., 2009, 37, 1–13 CrossRef CAS PubMed.
- A. J. George, W. G. Thomas and R. D. Hannan, Nat. Rev. Cancer, 2010, 10, 745–759 CrossRef CAS PubMed.
- M. Klauzinska, N. P. Castro, M. C. Rangel, B. T. Spike, P. C. Gray, D. Bertolette, F. Cuttitta and D. Salomon, Semin. Cancer Biol., 2014, 29, 51–58 CrossRef CAS PubMed.
- S. L. Thomas, R. Alam, N. Lemke, L. R. Schultz, J. A. Gutierrez and S. A. Rempel, Neuro-Oncology, 2010, 12, 941–955 CrossRef CAS PubMed.
- M. Rhinn and P. Dolle, Development, 2012, 139, 843–858 CrossRef CAS PubMed.
- S. P. Becerra and V. Notario, Nat. Rev. Cancer, 2013, 13, 258–271 CrossRef CAS PubMed.
- A. Fleischer, V. Ayllon, L. Dumoutier, J. C. Renauld and A. Rebollo, Oncogene, 2002, 21, 3181–3189 CrossRef CAS PubMed.
- L. M. Barnes, C. M. Bentley and A. J. Dickson, Biotechnol. Bioeng., 2003, 81, 631–639 CrossRef CAS PubMed.
- K. Bidet, D. Dadlani and M. A. Garcia-Blanco, PLoS Pathog., 2014, 10, e1004242 Search PubMed.
- M. M. Kim, D. Wiederschain, D. Kennedy, E. Hansen and Z. M. Yuan, Oncogene, 2007, 26, 4209–4215 CrossRef CAS PubMed.
- K. Taniuchi, I. Nishimori and M. A. Hollingsworth, Cancer Res., 2011, 71, 895–905 CrossRef CAS PubMed.
- H. Matsuki, M. Takahashi, M. Higuchi, G. N. Makokha, M. Oie and M. Fujii, Genes to cells: devoted to molecular & cellular mechanisms, 2013, 18, 135–146 CAS.
- T. Kobayashi, S. Winslow, L. Sunesson, U. Hellman and C. Larsson, PLoS One, 2012, 7, e35820 CAS.
- E. Guitard, F. Parker, R. Millon, J. Abecassis and B. Tocque, Cancer Lett., 2001, 162, 213–221 CrossRef CAS PubMed.
- H. Zhang, S. Zhang, H. He, W. Zhao, J. Chen and R. G. Shao, Cancer Sci., 2012, 103, 1848–1856 CrossRef CAS PubMed.
- B. Culjkovic-Kraljacic, A. Baguet, L. Volpon, A. Amri and K. L. Borden, Cell Rep., 2012, 2, 207–215 CrossRef CAS PubMed.
- M. Hamada, A. Haeger, K. B. Jeganathan, J. H. van Ree, L. Malureanu, S. Walde, J. Joseph, R. H. Kehlenbach and J. M. van Deursen, J. Cell Biol., 2011, 194, 597–612 CrossRef CAS PubMed.
- J. Pan, S. Eckardt, N. A. Leu, M. G. Buffone, J. Zhou, G. L. Gerton, K. J. McLaughlin and P. J. Wang, Dev. Biol., 2009, 330, 167–174 CrossRef CAS PubMed.
- J. Katahira, T. Miki, K. Takano, M. Maruhashi, M. Uchikawa, T. Tachibana and Y. Yoneda, Nucleic Acids Res., 2008, 36, 616–628 CrossRef CAS PubMed.
- I. Tretyakova, A. S. Zolotukhin, W. Tan, J. Bear, F. Propst, G. Ruthel and B. K. Felber, J. Biol. Chem., 2005, 280, 31981–31990 CrossRef CAS PubMed.
- T. C. Hsu, Int. Rev. Cytol., 1961, 12, 69–161 CAS.
- F. M. Wurm, Processes, 2013, 1, 296–311 CrossRef CAS.
- K. J. Livak and T. D. Schmittgen, Methods, 2001, 25, 402–408 CrossRef CAS PubMed.
- D. Li, K. Xie, G. Ding, J. Li, K. Chen, H. Li, J. Qian, C. Jiang and J. Fang, Cancer Lett., 2014, 346, 45–52 CrossRef CAS PubMed.
- C. Trapnell, B. A. Williams, G. Pertea, A. Mortazavi, G. Kwan, M. J. van Baren, S. L. Salzberg, B. J. Wold and L. Pachter, Nat. Biotechnol., 2010, 28, 511–515 CrossRef CAS PubMed.
Footnote |
| † Electronic supplementary information (ESI) available. See DOI: 10.1039/c5mb00627a |
| This journal is © The Royal Society of Chemistry 2016 |

