Exploring the mechanism of how tvMyb2 recognizes and binds ap65-1 by molecular dynamics simulations and free energy calculations†
Wei-Kang
Li
a,
Qing-Chuan
Zheng
*ab and
Hong-Xing
Zhang
a
aState Key Laboratory of Theoretical and Computational Chemistry, Institute of Theoretical Chemistry, Jilin University, Changchun 130023, People's Republic of China. E-mail: zhengqc@jlu.edu.cn
bKey Laboratory for Molecular Enzymology and Engineering of the Ministry of Education, Jilin University, Changchun 130023, People's Republic of China
First published on 16th October 2015
Abstract
TvMyb2, one of the Myb-like transcriptional factors in Trichomonas vaginalis, binds to two closely spaced promoter sites, MRE-1/MRE-2r and MRE-2f, on the ap65-1 gene. However, detailed dynamical structural characteristics of the tvMyb2-ap65-1 complex and a detailed study of the protein in the complex have not been done. Focused on a specific tvMyb2-MRE-2-13 complex (PDB code: 3OSF) and a series of mutants K51A, R84A and R87A, we applied molecular dynamics (MD) simulation and molecular mechanics generalized Born surface area (MM-GBSA) free energy calculations to examine the role of the tvMyb2 protein in recognition interaction. The simulation results indicate that tvMyb2 becomes stable when it binds the DNA duplex. A series of mutants, K51A, R84A and R87A, have been followed, and the results of statistical analyses of the H-bond and hydrophobic contacts show that some residues have significant influence on recognition and binding to ap65-1 DNA. Our work gives important information to understand the interactions of tvMyb2 with ap65-1.
Introduction
The Myb family consists of a number of proteins, which are encoded by a series of proto-oncogenes, with extensive functions in both animals and plants, such as playing an important role in development, cell survival, proliferation and homeostasis.1 Furthermore, the Myb proteins have also been testified to be associated with leukemogenesis in several species including humans.2,3 In recent years, lot of evidence has been shown that Myb is tightly regulated by attenuation sequences which reside in the first intron.4 The Myb domain normally has at most four imperfect amino acid sequence repeats (R). Each of the repeats has a very similar folding architecture, containing three well-defined helices, and the second and third helix in each repeat often forms a helix turn helix (HTH) structure. Both of the third helices of the second repeat (R2) and third repeat (R3) are involved in specific base recognition in the major groove of the DNA.5,6 Myb proteins mostly operate a transcriptional activator by highly conserved domains that bind to specified sequence t/cAACt/gG, which is known as the Myb binding site (MBS).5,7Trichomonas vaginalis (T. vaginalis), a kind of flagellated protozoan, causes the most prevalent non-viral sexually transmitted disease (STD) worldwide.8 It has been demonstrated that the trichomonosis infection caused by the T. Vaginalis is associated with increased risk for adverse pregnancy outcome, cervical cancer, and HIV seroconversion.9 Adherence to the vaginal epithelium by the T. vaginalis, a property key to colonization and infection, is a highly specific event that is mediated by adhesins. The adhesion protein 65-1 (ap65-1) gene encodes multiple homologous 65 kDa proteins. This protein has been detected on plasma membranes as part of adhesion complexes during host–parasite encounters in T. vaginalis.10–12 In recent reports, the transcription of the ap65-1 gene is regulated in cis by two neighbouring MBS, MRE-1/MRE-2r and MRE-2f, along with several other neighbouring DNA regulatory elements in the ap65-1 promoter. The MRE-1/MRE-2r site comprises three overlapping DNA elements, which are the binding sites for three Myb-like proteins: tvMyb1, tvMyb2 and tvMyb3.13–16 However, the tvMybs are not like the other members of the Myb family, tvMybs recognize the specified sequence a/gACGAT instead of the t/cAACt/gG. But at the same time, the tvMyb2 is just like the c-Myb invertebrates, the DNA-free tvMyb2 has a very flexible conformation. Upon binding to the promoter DNA ap65-1, tvMyb2 undergoes conformational re-arrangement and structural stabilization.16 The 3D structures of the tvMyb2-MRE-2-13 complex have been determined by X-ray crystallography (PDB code: 3OSF), illustrated in Fig. 1. Nonetheless, the stabilization and recognition mechanisms by tvMyb are still unclear at the atomic level.
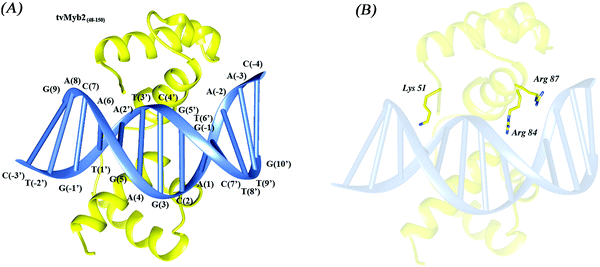 | ||
| Fig. 1 The overall structure of (A) the 3OSF complex and (B) the mutant residues, tvMyb248–150, yellow; MRE-2-13, blue. | ||
In order to clarify the details of the mechanisms and indicate the direction of suppressing DNA silencing or inhibiting ap65-1 gene translation lead the experts to develop treatments for the disease. Molecular dynamics (MD) simulations and the molecular mechanics generalized Born surface area (MM-GBSA) method are employed to clarify the interactional details and energetic information between the tvMyb2 and the MRE-2-13 gene at the atomic level. And then, a series of MD simulations of mutates K51A, R84A, and R87A with DNA complexes have been done. All these MD simulations and MM-GBSA calculations complement the experiments16 and help us to get a better understanding of the recognition and binding mechanism of tvMyb2 and the MRE-2-13 DNA complex by offering the binding details and experimentally inaccessible dynamic information.
Methods
Molecular system preparation, materials and methods, crystallography
The initial crystal structure for studying MD simulations was taken from the Protein Data Bank (PDB ID: 3OSF).16 We have chosen 2 different mutants, K51A and R87A, to stand for the specific interaction and nonspecific interaction. And the R84A mutant is one of the most important mutant which loses all binding affinity in the experimental results. The structure of DNA-free tvMyb2 and the structures of mutants K51A, R84A, and R87A were generated based on the crystal structure using Discovery Studio 2.5 software.17 All crystal water molecules were considered during MD simulations.Molecular dynamics simulations
The MD simulations were performed by using the AMBER 11 software package18 with the classical force-field parameters, AMBER99SB (ff99SB) force field, supplemented with the refined parmbsc0 parameters (ff99bsc0).19,20 The sodium ions (Na+) were added by the leap to be the explicit net neutralizing counterions based on a coulomb potential grid. For those complexes that were further subjected to MD simulations in explicit solvent, each system was solvated with TIP3P waters in a truncated octahedron box,21 with an 8.0 Å distance around the solute. Both the protein and the DNA were fixed with a 100 kcal mol−1 Å−2 positional restraint, and minimized the energy of the water and the irons for 1000 steps of the steepest descent (SD) method and 2000 steps of conjugate gradient (CG) algorithms. Then the minimization was repeated with restraints on the proteins only for 1000 step SD and 2000 step CG. The minimization was repeated again for 2000 step SD and 3000 step CG without any restraint. Thereafter, the heating dynamics was performed with all restraints by a 10 kcal mol−1 Å−2 weights. Thereby, the temperature was increased gently from 50 to 300 K and then equilibrated for 300 ps. Finally, a 25 ns simulation for each system under NPT ensemble conditions was carried out. All the systems were treated within periodic boundary conditions. Long range electrostatic interactions were calculated using the Particle-Mesh Ewald (PME)22 technique with a non-bonded cutoff of 12.0 Å to limit the direct space sum. An integration time step of 2 fs was used, and the SHAKE algorithm23 was employed to constrain bonds involving hydrogen atoms during dynamics. All the data given in the tables and figures were obtained from the last 15 ns of the MD simulations unless otherwise mentioned. The PyMOL,24 Chimera,25 and VMD26 software were used to visualize the trajectories and to depict structural representations.MM-GBSA calculations
Binding free energy for each complex was estimated by molecular mechanics generalized Born (MM-GBSA) approaches,27,28 using the MM/PBSA protocol in Amber11.18 We extracted last 1000 snapshots taken from the trajectories of each simulation for the energy calculation. The interaction energy was calculated according to the following equation:| ΔGbind = Gcomplex − Gprotein − GDNA | (1) |
| Gx=complex,protein,DNA = EMM + Gsolv − TS | (2) |
| EMM = Eele + Evdw + Eint | (3) |
| Gsolv = Ggb + Gnonp | (4) |
For obtaining a detailed view of tvMyb2 and DNA interactions, we employed the MM-GBSA method to calculate the binding free energy of each residue as well. Every single residue can be partitioned into two parts in the calculation: the backbone and the side chain. The snapshots used in the binding free energy decomposition are the same as those used in the binding free energy calculation.
Results and discussion
Structural and dynamic properties of each system
To access the stability of each system during the whole MD simulations, the average root-mean-square deviations (RMSD) of the backbone atoms referenced to the corresponding initial structure of each system were calculated and are shown in Fig. 2. All the systems achieved equilibrium quickly during the MD simulations except the DNA-free system. The average RMSD values are 1.65 Å in the 3OSF system, indicating good agreement with the X-ray crystal structures. The mean RMSD value of the DNA-free system, which is 3.27 Å, is very big compared with that of the 3OSF system, indicating that the DNA-free tvMyb2 has a very flexible conformation. The results mentioned above are in agreement with the experimental results.16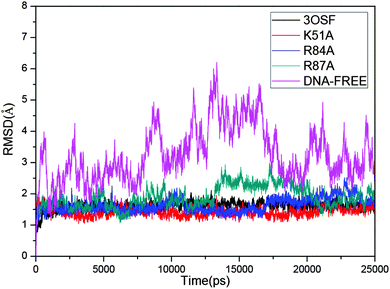 | ||
| Fig. 2 Time dependence of the RMSD values (Å). 3OSF for black; K51A for red; R84A for blue. R87A for dark cyan. DNA-free for magenta. | ||
To further understand the stability difference between the protein in the 3OSF system and the protein in the DNA-free system, we have analysed the cross-correlation of the protein in these two systems. In Fig. 3, we have defined three regions R2–R2, R3–R3 and R2–R3. The R2 and R3 are the repeat 2 (amino acids 52–102) and repeat 3 (amino acids 103–154) of the tvMyb2. For instance, R2–R2 means the cross-correlation between amino acids of the R2. As shown in Fig. 3(a), there are two high-relative regions which are R2–R2 and R3–R3, and one low-relative region R2–R3, indicating that the two repeat, R2 and R3, are independent from each other in the DNA-free system. In Fig. 3(b), three regions, R2–R2, R3–R3 and R2–R3, are all high-relative, which means that the tvMyb2 protein is very stable in the 3OSF system. What is more, in both figures, the R2–R2 and R3–R3 are high-relative no matter if the protein binds with the ap65-1 molecule or not.
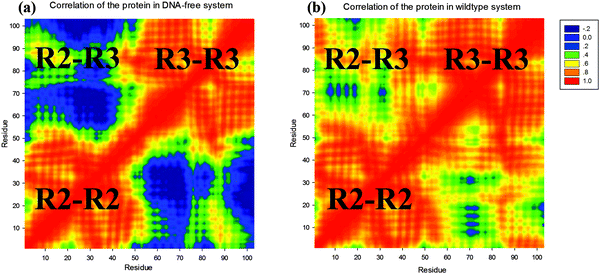 | ||
| Fig. 3 Cross-correlation matrices of the coordinate fluctuations for Cα atoms of (a) 3OSF and (b) DNA-free proteins around their mean positions. | ||
To further illustrate the structural difference in every system, we analysed the secondary structure. All the systems show six helixes (see Fig. 4). But for the R84A system, the fifth helix unwinds after 10 ns simulation, but the residue which we mutate, Arg84, locates on the third helix, which indicates that the mutation may cause unwind processes by a long-range interaction. This unwinding leads us to conclude that Arg84 is very important for the stability of the binding system.
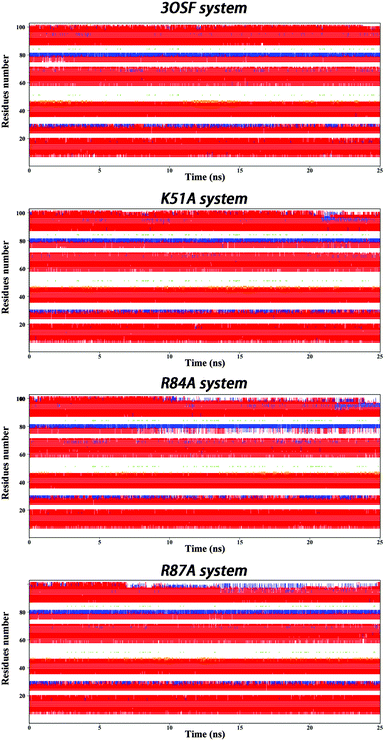 | ||
| Fig. 4 Secondary structure variation along MD simulations of 3OSF, K51A, R84A and R87A mutants. Red for α-helix; blue for 3–10 helix. | ||
In addition, we analysed the extent of variation in flexibility of the individual residue/nucleotide upon binding of each system to analyse the mobility of structural elements in each system; the per-residue/nucleotide root-mean-square fluctuations (RMSFs) of the protein Cα and the DNA backbone with respect to the initial coordinates computed over last 15 ns simulations are shown in Fig. 5. For the 3OSF system, the value is only high on the boundary of the protein and the loop between the R2 and R3. The DNA-free system is in very high flexibility compared with the 3OSF system from Fig. 5. In contrast, the value of the DNA-free system is high all the time, and only decreases a little on the middle of every helix. The RMSF values of the 3OSF and the mutant systems have approximate value of residues and nucleotides. The residues in R2 and R3 regions have low flexibility, and most high values of RMSF happened on the residues in the loop region. After analysing the RMSF value of the protein of each system, we have also further analysed the RMSF value for the DNA in the 3OSF and mutant systems. The RMSF value of the DNA is stable as well as the protein for the systems we analysed.
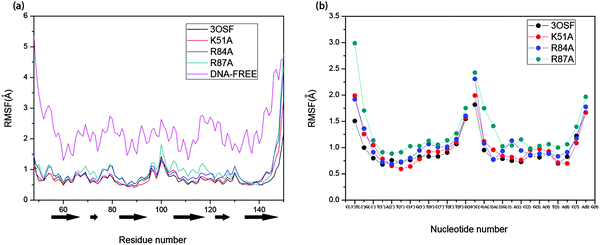 | ||
| Fig. 5 The RMSF per residues of protein (a) and nucleotides of the DNA (b) based on the initial structure. The α-helixes are represented by black block arrows. | ||
Energetic analysis of the TvMyb2-MRE-2-13 complexes
| 3OSF | K51A | R84A | R87A | |
|---|---|---|---|---|
| a G pol = Eele + Ggb. b G nonpol = Evdw + Gnonp. c G bind = Gnonp + Gpb − TS. | ||||
| E ele | −4892.54 ± 69.18 | −4354.28 ± 78.68 | −4196.02 ± 69.51 | −4397.73 ± 77.76 |
| E vdw | −122.39 ± 6.46 | −109.66 ± 6.25 | −108.07 ± 6.49 | −102.88 ± 6.84 |
| G gb | 4901.12 ± 65.54 | 4359.20 ± 75.84 | 4213.57 ± 66.47 | 4401.15 ± 72.82 |
| G nonp | −20.39 ± 0.34 | −19.28 ± 0.48 | −18.94 ± 0.70 | −19.53 ± 0.51 |
| G pol | 8.58 | 4.92 | 17.55 | 3.42 |
| G nonpol | −142.78 | −128.94 | −127.01 | −122.41 |
| H | −134.20 ± 8.57 | −124.03 ± 9.36 | −109.46 ± 8.17 | −118.99 ± 10.95 |
| −TS | 47.99 ± 5.34 | 49.00 ± 10.46 | 57.60 ± 5.92 | 57.92 ± 2.25 |
| G bind | −86.21 ± 10.10 | −75.03 ± 14.04 | −51.86 ± 10.09 | −61.07 ± 11.18 |
To further investigate the source of binding affinity as well as the loss of binding affinity in mutants, detailed contributions of various energy components computed by MM-GBSA and the entropy contributions from the normal-mode analysis are given (Table 1). The major favourable contributions to the binding free energies (Gbind) come from the nonpolar solvation energies (Gnonpol), more specifically from the van der Waals energies (Evdw). In contrast to the nonpolar solvation energies (Gnonpol), the polar solvation energies (Gpol) make unfavourable contribution to the binding energy. Actually, the direct intermolecular electrostatic interactions (Eele) are highly favorable to the binding but their contributions are completely screened by the unfavourable stronger polar-electrostatic solvation energies (Ggb). In addition, the contributions of entropy changes (−TS) to the free energies impair the binding of the ap65-1 molecule to the protein tvMyb2. All the entropy changes are depicted by −TS. In general, favourable van der Waals (Evdw) and nonelectrostatic solvation energies (Gnonp) mainly drive the binding between the tvMyb2 protein and ap65-1. All the mutant systems have a very similar nonpolar energy, which is the major attractive interaction, and the nonpolar energy of all the mutant systems have increased by 15 to 20 kcal mol−1 compared with the 3OSF system. For the K51A system, the main source for the binding affinity lost is that the nonpolar energy has increased by about 15 kcal mol−1. For the R87A system, not only the nonpolar energy has increased, but also the entropy has increased by about 10 kcal mol−1 at the same time. For the R84A system, the polar energy also increases by 10 kcal mol−1, except the values of the entropy and nonpolar energy have increased, compared with the 3OSF system. We could find that the R84A system is getting unstable from every aspect by analysing the energy results. It happens that there is a similar case in the experimental results, the R84A system loses the binding affinity. Again, the results we got are in the same trend with the experiment up to a point.16
A much better understanding of the tvMyb2-ap65-1 recognition is obtained via the interaction energy analysis. As it is shown in Table S1 (ESI†), the attractive interactions between the tvMyb2 protein and the bases of ap65-1 are stronger than the corresponding interactions between the protein and the phosphate backbone. We could infer that the tvMyb2 is a sequence specific DNA binding protein.
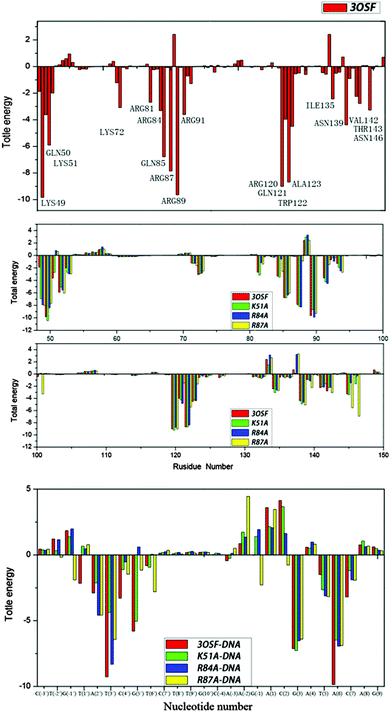 | ||
| Fig. 6 Free energy decomposition analysis for 3OSF and three mutants; residues contributing significantly for 3OSF are highlighted. | ||
The values of ΔGMM+solv have been decomposited on a per-residue basis into contributions from van der Waals energy, columbic interaction energy, polar solvation free energy, and the nonpolar solvation free energy. The residues with ΔGMM+solv < −3 kcal mol−1 in each system have been listed in Tables S2.1–S2.4 (ESI†). In the 3OSF system (Table S2.1, ESI†), seven amino acid residues (Lys49, Lys51, Gln85, Arg87, Arg89, Arg120, and Trp122) make major contributions to the binding free energy with ΔGMM+solv < −5 kcal mol−1. These residues are very important for the tvMyb2-MRE-2-13 binding, which are in agreement with the previous experimental identification.16 As seen from Tables S1.1 and S2.2–S2.4 (ESI†), three mutant systems have very different ways, for being unstable with the DNA molecule. In the K51A system, the decomposition energy shows that the DNA molecule is the main reason for the unstable binding. See Tables S1.2 and S1.3 (ESI†), the decomposition energy of the base of the K51A system is very similar to the 3OSF system, but the value of the backbone has risen by about 10 kcal mol−1, some of the backbones of nucleotides (A(2′), T(3′), C(4′)) repel protein instead of attracting it. The real reason for the increase of the value of the binding free energy for the K51A system compared with the 3OSF system is that the mutation of Lys51 to Ala51 destroys the electronic attraction between the residues of protein and the backbone of the ap65-1. But in other words, this mutant influences some of the interaction between tvMyb2 and the base of the DNA molecule which is the major recognition way. In the R84A system, the reason for instability is very complicated. Just like the K51A system, the backbone of the DNA molecule repels the protein, but at the same time, the decomposition energy of base has risen too, and what is really important is that the G(5′), which is the center of the specific base sequence, lose its binding affinity to the protein, meaning that the protein loses its recognizing ability. The decomposition energy of the R84A system could give another clue to recognize the losing ability. Except for Ala84 losing all the binding affinity because of the mutant, the Gln50 does not contribute to the binding anymore. And some other residues (Lys49, Arg81, Lys128 and Asn136) have a significant rise in the value of decomposition energy. In the R87A system, some of the residues (Lys49, Gln51, Arg81, Ala87, Lys91, Gln121, Trp122, Ala123 and Lys138) contribute less compared to the 3OSF system, and three of them, Lys49, Ala87 and Trp122, make the most important residues in the contribution of the 3OSF system.
From Tables S2.1–S2.4 (ESI†), it can be seen that most of the important residues of each system have a large polar interaction contribution while the nonpolar interaction has a relatively small influence. But for some of the other residues, the nonpolar interactions also have an obvious contribution, for example, Lys49, Arg84 and so on. Most of these polar interactions stem from the formation of hydrogen bonds, and the nonpolar interactions come from the hydrophobic interactions. Detailed interaction between the tvMyb2 protein and the DNA molecule can be observed by monitoring the occupation probability of these hydrogen bonds and hydrophobic interactions during the MD process.
Intermolecular interaction analysis
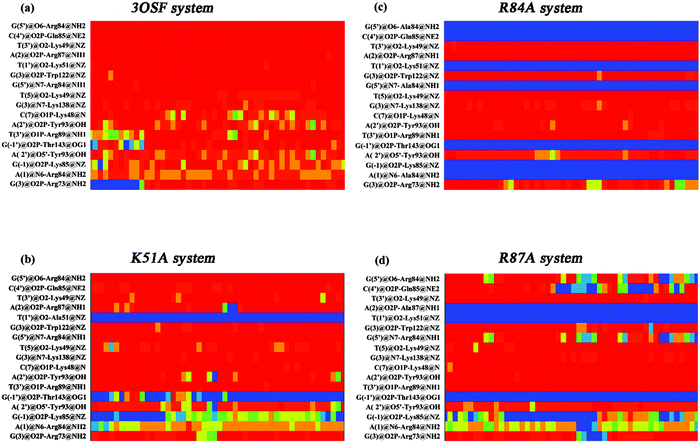
The protein–DNA interactions were investigated by focusing on hydrogen bonds and hydrophobic interactions. Protein–DNA hydrogen bonds include both nonspecific interactions (between the tvMyb2 and the DNA sugar/phosphate backbone), being significant for the stability of the protein–DNA complex, and specific interactions (between the tvMyb2 and the DNA base), being important for the molecular recognition process in the protein–DNA complex. Moreover, the hydrophobic contacts are necessary for the protein–DNA binding, but most of these interactions are nonspecific because the interactions are between the residues and the sugar backbone mostly. The criteria for hydrogen-bonded pairs are the distance shorter than 3.5 Å and the binding angle greater than 120.0° between the hydrogen donor and acceptor atoms. The hydrophobic contact is defined as a distance between carbon atoms shorter than 4.5 Å in the present study.All the complex systems become stable during the whole MD simulation, however, we could clearly find that 3 mutant systems are not as stable as the 3OSF system. To investigate the interaction characteristics between tvMyb2 and DNA and to find the reason for the stability difference, both the hydrogen bonds and the hydrophobic interaction formed between tvMyb2 and ap65-1 in all complex systems were analyzed. From all these studies, we have drawn the contact maps of each complex, see Fig. 7 and 8. There are more stable hydrogen bonds and hydrophobic contacts in the 3OSF system than in K51A, R84A or R87A systems. In the 3OSF system, there are 14 hydrogen bonds and 11 hydrophobic interactions between the protein and DNA. However, the number of hydrogen bonds and hydrophobic interactions become less in three mutants K51A, R84A and R87A. For the 3OSF system, Lys51, Lys49, Arg84, Tyr93 and Lys138 are involved in stable specific hydrogen bonds (Fig. S1, ESI†) between tvMyb2 and DNA. For the K51A system, the hydrogen bond Lys51 – T(1′) and hydrophobic contacts Lys51–T(3′) have disappeared because of mutation, and the Thr143–G(−1′) hydrogen bond has disappeared as well. Moreover, for the R84A system, a lot of hydrogen bonds and hydrophobic interactions have been very unstable. We were not surprised by this result because the experiment had already shown that the R84A system is very unstable.16 Gln85, Arg87, Lys91, Ala123 and Thr143 lose their interactions with DNA molecule. For the last system, R87A, we found that all the hydrogen bonds or the hydrophobic interactions, which are related to the Arg84, have vanished or have become unstable. Moreover, the hydrogen bonds Gln85–C(3′) and Lys91–A(-2) have become unstable, and hydrophobic interactions Lys49–T(3′), Lys138–G(3) have totally been disrupted.
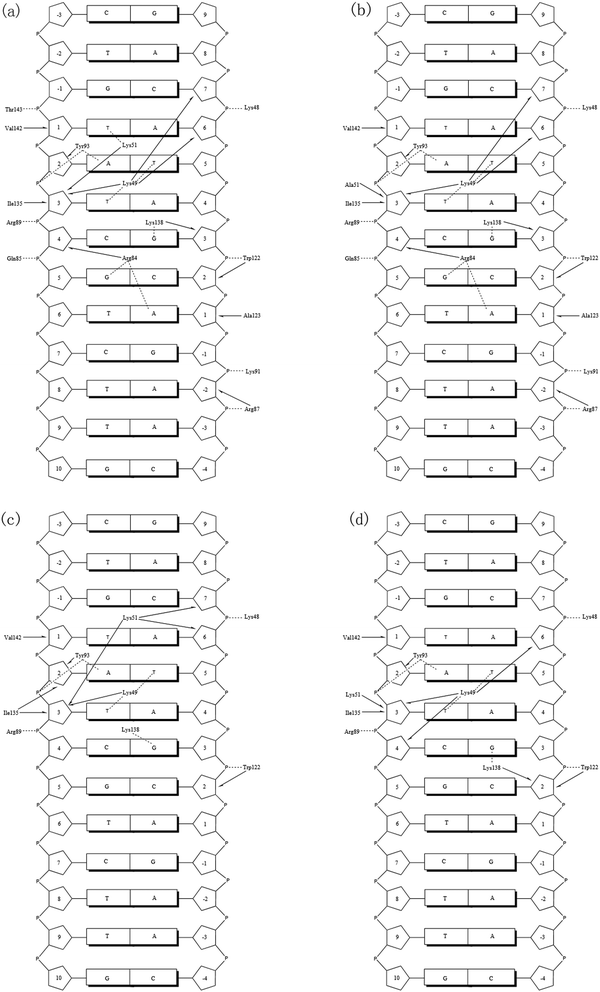 | ||
| Fig. 7 Diagrams of the calculated key contact sites of tvMyb2 with ap65-2 DNA, (a) 3OSF (b) K51A (c) R84A (d) R87A. Dashed line for hydrogen bonds; arrows hydrophobic interactions. | ||
After analyzing the interaction network between the tvMyb2 protein and the ap65-1 DNA molecule, we could infer that maybe the Lys49, Lys51 and Arg84 are the core residues for recognition, no matter from the energy aspect or the interaction aspect. All these residues involve specific interactions, and the decomposition energy of these residues makes major contribution to the binding free energy with less than −3 kcal mol−1. Furthermore, the Arg87 is one of the important residue which forms the nonspecific interaction between the phosphate backbone of the DNA molecule and the residue (see Fig. 7). Although nonspecific interactions are not the most important interactions for the recognition of tvMyb2-DNA, we could clearly find that the mutation of Arg87 destroys not only the nonspecific interaction, but also a series of specific interactions. After all, the binding of the tvMyb2 and the ap65-1 DNA molecule consist of specific interactions and the nonspecific interaction, and each of them are important to the binding interaction network.
Conclusion
Focused on the specific tvMyb2-MRE-2-13 DNA complex, the DNA-free tvMyb2, and 3 mutant complexes, we performed Molecular dynamics (MDs) simulations to investigate the structural stability. Furthermore, MM-GBSA was used to analyze the detailed interaction and binding free energy in all 4 complex systems.The results from MD simulations indicate that the tvMyb2 protein in the DNA-free system is not as stable as the protein in the tvMyb2-MRE-2-13 system. Although the tvMyb2 is unstable and more flexible when the DNA molecules are not binding with it, the R2 and R3 region are comparatively stable whenever the DNA binds with it or not. Furthermore, all four complex systems are stable in the MD simulations, only for slight structural changes of the protein and the DNA molecule. But the R84A system suffers an unwinding of the fifth helix. It is because the mutant causes the DNA molecule to undergo a slight structure change, but the slight change drags the residue Trp122, which locates on the fifth helix of the protein, away from the initial position by forming a hydrogen bond Trp122-C(2) and a hydrophobic contact Trp122-(2) with the DNA molecule, and the position change of the Trp122 may result in unstable second structure. The structure change is one of the most important reason why the R84A system loses binding affinity compared with the 3OSF system.
MM-GBSA free energy calculations provide the following energetic information: the binding affinity for each complexes shows that the 3OSF protein binds best with the DNA molecule, and all 3 mutant complexes lose a part of the binding affinity. The sequence of binding affinity for all 3 mutant systems are consistent with the experimental results,16 in which the K51A is the best, followed by the R87A and the R84A is the worst. The extensive interactions between the tvMyb2 and DNA base pair are the reason specific DNA-binding protein tvMyb2, and the dominant contribution to the binding free energy of the tvMyb2-DNA is the nonpolar interaction. Seven conserved amino acid residues (Lys49, Lys51, Gln85, Arg87, Arg89, Arg120, and Trp122) make major contributions to the binding free energy with more than 5 kcal mol−1 free energy for the tvMyb2-MRE-2-13 binding. Furthermore, hydrogen bonds and hydrophobic interaction analysis suggest the key contact sites for the two complexes. At last, 3 key residues (Lys49, Lys51 and Arg84) have been suggested for recognizing tvMyb2-ap65-1, which combined the energy analysis, the interaction analysis and the mutant results. MD simulations and MM-GBSA calculations provide the above dynamic structural information and energetic information, which are often inaccessible in the static crystal structure. This study will lead to a better understanding of tvMyb2-ap65-1 interactions.
Acknowledgements
This work is supported by the Natural Science Foundation of China (Grant No. 21273095).References
- R. G. Ramsay and T. J. Gonda, Nat. Rev. Cancer, 2008, 8, 523–534 CrossRef CAS PubMed.
- M. R. Lidonnici, F. Corradini, T. Waldron, T. P. Bender and B. Calabretta, Blood, 2008, 111, 4771–4779 CrossRef CAS PubMed.
- G. Anfossi, A. M. Gewirtz and B. Calabretta, Proc. Natl. Acad. Sci. U. S. A., 1989, 86, 3379–3383 CrossRef CAS.
- H. Hugo, A. Cures, N. Suraweera, Y. Drabsch, D. Purcell, T. Mantamadiotis, W. Phillips, A. Dobrovic, G. Zupi, T. J. Gonda, B. Iacopetta and R. G. Ramsay, Genes, Chromosomes Cancer, 2006, 45, 1143–1154 CrossRef CAS PubMed.
- K.-I. Chie. K. Ogata, M. Sasaki, H. Hatanaka, A. Nagadoi, M. Enari, H. Nakamura, Y. Nishimura, S. Ishii and A. Sarai, Nat. Struct. Biol., 1996, 3(2), 178–187 CrossRef.
- L. Jia, M. T. Clegg and T. Jiang, Plant Physiol., 2004, 134, 575–585 CrossRef CAS PubMed.
- H. Biedenkapp, U. Borgmeyer, A. E. Sippel and K.-H. Klempnauer, Nature, 1988, 335, 835–837 CrossRef CAS PubMed.
- F. Sorvillo, L. Smith, P. Kerndt and L. Ash, Emerging Infect. Dis., 2001, 7, 927 CrossRef CAS PubMed.
- M. A. Klebanoff, J. C. Carey, J. C. Hauth, S. L. Hillier, R. P. Nugent, E. A. Thom, J. M. Ernest, R. P. Heine, R. J. Wapner, W. Trout, A. Moawad, M. Miodovnik, B. M. Sibai, J. P. V. Dorsten, M. P. Dombrowski, M. J. O'Sullivan, M. Varner, O. Langer, D. McNellis, J. M. Roberts and K. J. Leveno, N. Engl. J. Med., 2001, 345, 487–493 CrossRef CAS PubMed.
- J. F. Alderete and G. E. Garza, Infect. Immun., 1988, 56, 28–33 CAS.
- J. Alderete, J. L. O'Brien, R. Arroyo, J. A. Engbring, O. Musatovova, O. Lopez, C. Lauriano and J. Nguyen, Mol. Microbiol., 1995, 17, 69–83 CrossRef CAS PubMed.
- R. Arroyo, J. Engbring and J. Alderete, Mol. Microbiol., 1992, 6, 853–862 CrossRef CAS PubMed.
- C.-D. Tsai, H.-W. Liu and J.-H. Tai, J. Biol. Chem., 2002, 277, 5153–5162 CrossRef CAS PubMed.
- S. J. Ong, S. C. Huang, H. W. Liu and J. H. Tai, Mol. Microbiol., 2004, 52, 1721–1730 CrossRef CAS PubMed.
- H.-M. Hsu, S.-J. Ong, M.-C. Lee and J.-H. Tai, Eukaryotic Cell, 2009, 8, 362–372 CrossRef CAS PubMed.
- I. Jiang, C.-K. Tsai, S.-C. Chen, S.-h. Wang, I. Amiraslanov, C.-F. Chang, W.-J. Wu, J.-H. Tai, Y.-C. Liaw and T.-h. Huang, Nucleic Acids Res., 2011, 39, 8992–9008 CrossRef CAS PubMed.
- D. Studio, Accelrys Inc., San Diego, CA, USA, 2009 Search PubMed.
- D. A. Case, T. Darden, T. Cheatham, C. L. Simmerling, J. Wang, R. E. Duke, R. Luo, R. Walker, W. Zhang and K. Merz, Amber 11, University of California, 2010 Search PubMed.
- J. Wang, P. Cieplak and P. A. Kollman, J. Comput. Chem., 2000, 21, 1049–1074 CrossRef CAS.
- A. Pérez, I. Marchán, D. Svozil, J. Sponer, T. E. Cheatham, C. A. Laughton and M. Orozco, Biophys. J., 2007, 92, 3817–3829 CrossRef PubMed.
- W. L. Jorgensen, J. Chandrasekhar, J. D. Madura, R. W. Impey and M. L. Klein, J. Chem. Phys., 1983, 79, 926–935 CrossRef CAS.
- T. Darden, D. York and L. Pedersen, J. Chem. Phys., 1993, 98, 10089–10092 CrossRef CAS.
- J.-P. Ryckaert, G. Ciccotti and H. J. Berendsen, J. Comput. Phys., 1977, 23, 327–341 CrossRef CAS.
- W. L. DeLano, DeLano Scientific, San Carlos, CA, 2002, p. 700.
- E. F. Pettersen, T. D. Goddard, C. C. Huang, G. S. Couch, D. M. Greenblatt, E. C. Meng and T. E. Ferrin, J. Comput. Chem., 2004, 25, 1605–1612 CrossRef CAS PubMed.
- W. Humphrey, A. Dalke and K. Schulten, J. Mol. Graphics, 1996, 14, 33–38 CrossRef CAS PubMed.
- J. Srinivasan, T. E. Cheatham, P. Cieplak, P. A. Kollman and D. A. Case, J. Am. Chem. Soc., 1998, 120, 9401–9409 CrossRef CAS.
- J. M. Swanson, R. H. Henchman and J. A. McCammon, Biophys. J., 2004, 86, 67–74 CrossRef CAS PubMed.
Footnote |
| † Electronic supplementary information (ESI) available. See DOI: 10.1039/c5mb00585j |
| This journal is © The Royal Society of Chemistry 2016 |

