An integrative C. elegans protein–protein interaction network with reliability assessment based on a probabilistic graphical model†
Xiao-Tai
Huang‡
a,
Yuan
Zhu‡
*ab,
Leanne Lai Hang
Chan
a,
Zhongying
Zhao
c and
Hong
Yan
a
aDepartment of Electronic Engineering, City University of Hong Kong, Hong Kong, China
bSchool of Automation, China University of Geosciences, Wuhan, China. E-mail: zhuyuan@cug.edu.cn; zhuyuan2015@yeah.net; Fax: +852 3442 0562; Tel: +852 3442 4889
cDepartment of Biology, Faculty of Science, Hong Kong Baptist University, Hong Kong, China
First published on 2nd November 2015
Abstract
In Caenorhabditis elegans, a large number of protein–protein interactions (PPIs) are identified by different experiments. However, a comprehensive weighted PPI network, which is essential for signaling pathway inference, is not yet available in this model organism. Therefore, we firstly construct an integrative PPI network in C. elegans with 12![[thin space (1/6-em)]](https://www.rsc.org/images/entities/char_2009.gif) 951 interactions involving 5039 proteins from seven molecular interaction databases. Then, a reliability score based on a probabilistic graphical model (RSPGM) is proposed to assess PPIs. It assumes that the random number of interactions between two proteins comes from the Bernoulli distribution to avoid multi-links. The main parameter of the RSPGM score contains a few latent variables which can be considered as several common properties between two proteins. Validations on high-confidence yeast datasets show that RSPGM provides more accurate evaluation than other approaches, and the PPIs in the reconstructed PPI network have higher biological relevance than that in the original network in terms of gene ontology, gene expression, essentiality and the prediction of known protein complexes. Furthermore, this weighted integrative PPI network in C. elegans is employed on inferring interaction path of the canonical Wnt/β-catenin pathway as well. Most genes on the inferred interaction path have been validated to be Wnt pathway components. Therefore, RSPGM is essential and effective for evaluating PPIs and inferring interaction path. Finally, the PPI network with RSPGM scores can be queried and visualized on a user interactive website, which is freely available at http://rspgm.bionetworks.tk/.
951 interactions involving 5039 proteins from seven molecular interaction databases. Then, a reliability score based on a probabilistic graphical model (RSPGM) is proposed to assess PPIs. It assumes that the random number of interactions between two proteins comes from the Bernoulli distribution to avoid multi-links. The main parameter of the RSPGM score contains a few latent variables which can be considered as several common properties between two proteins. Validations on high-confidence yeast datasets show that RSPGM provides more accurate evaluation than other approaches, and the PPIs in the reconstructed PPI network have higher biological relevance than that in the original network in terms of gene ontology, gene expression, essentiality and the prediction of known protein complexes. Furthermore, this weighted integrative PPI network in C. elegans is employed on inferring interaction path of the canonical Wnt/β-catenin pathway as well. Most genes on the inferred interaction path have been validated to be Wnt pathway components. Therefore, RSPGM is essential and effective for evaluating PPIs and inferring interaction path. Finally, the PPI network with RSPGM scores can be queried and visualized on a user interactive website, which is freely available at http://rspgm.bionetworks.tk/.
1 Introduction
A signaling pathway is an essential process in living organisms, receiving extracellular or cytoplasmic signals and then triggering downstream signal transduction, which modulates gene expression and cell function. The knowledge of different kinds of pathways can reveal biological functions or provide suggestions of disease therapy.1Unfortunately, although several pathways have been studied extensively, the structure and function of most pathways are not well understood. Because the signaling pathway is complicated involving different molecules in contact with each other via Protein–Protein Interactions (PPIs) or Protein–DNA Interactions (PDIs), it is time-consuming to detect molecular regulatory relationships through biological experiments, such as gene knockout or RNAi. Therefore, it is possible and necessary to infer the pathway by computational methods based on molecular interaction data.
Several computational methods have been proposed for pathway inference recently.2–5 Most of them require a weighted molecular interaction network, called the background network, as an input of the algorithm. The background network is generally constructed from PPI and PDI data. Most pathway inference methods are performed on yeast because of the availability of its weighted PPI networks currently.2,6 However, in Caenorhabditis elegans (C. elegans), there is still no comprehensive weighted PPI network available.7 Therefore, it is necessary to construct a PPI network of C. elegans, and assign the reliability score for each PPI.
PPIs can be identified via high-throughput and small-scale experimental techniques or be predicted from computational methods by using different types of data, such as sequence, expression and binding data, or three-dimensional structural data.8,9 Several different popular biological databases have collected abundant PPIs in C. elegans, such as the Database of Interacting Proteins (DIP),10 Biological General Repository for Interaction Datasets (BioGRID),11 IntAct Molecular Interaction Database (IntAct),12 Molecular Interaction database (MINT),13 WormBase,14 Worm Interactome version 8 (WI8)15 and GeneOrienteer.16 However, none of them contains the relative comprehensive PPI information. For instance, the interaction between mex-6 and emb-9 is recorded in BioGRID, IntAct and MINT, while the interaction between zag-1 and odr-7 can only be retrieved in GeneOrienteer and WormBase. Therefore, the construction of a comprehensive PPI network database of C. elegans is urgent and necessary.
Many computational methods have been developed to assess the reliability of the data. These methods can be approximately divided into three classes: (1) multiple data integration based methods;17–19 (2) network topology based methods;20–25 and (3) model based methods.26–28 Multiple data integration based methods work effectively but rely much more on the prior knowledge of individual proteins. Network topology based methods and model based methods are the most state-of-the-art evaluation approaches, recently. A Probabilistic Graphical Model (PGM) has been established to describe PPI networks in terms of a random process that generates the networks.29,30 Several studies demonstrated that PGMs can be widely applied to discover protein complexes,28,31,32 explore biological networks,33 assess PPIs,27etc. Motivated by a wide range of applications of PGMs in PPI network analysis, this paper further explores its potential in assessing new established integrative and comprehensive PPI networks of C. elegans.
2 Methods
Similar to Zhu et al.'s previous work,27 we assume that there are several latent properties between two interacting proteins. These latent properties could be GO annotation terms, gene expression, sequence, location or any other functional, physical and biochemical properties of the protein. Then, a reliability score for protein pairs is defined by accumulating protein propensities on the common latent properties, which can be estimated by a probabilistic graphical model.2.1 Reliability score for protein pairs
Based on our assumption, si = (si![[small script l]](https://www.rsc.org/images/entities/char_e146.gif) ) and sj = (sj
) and sj = (sj![[small script l]](https://www.rsc.org/images/entities/char_e146.gif) ) ∈
) ∈ ![[Doublestruck R]](https://www.rsc.org/images/entities/char_e175.gif) m are used to describe protein properties on m latent variables for proteins vi and vj, respectively. 0 ≤ si
m are used to describe protein properties on m latent variables for proteins vi and vj, respectively. 0 ≤ si![[small script l]](https://www.rsc.org/images/entities/char_e146.gif) , sj
, sj![[small script l]](https://www.rsc.org/images/entities/char_e146.gif) ≤ 1 means the propensity of proteins vi and vj on the
≤ 1 means the propensity of proteins vi and vj on the ![[small script l]](https://www.rsc.org/images/entities/char_e146.gif) -th latent variable. Suppose variables di, dj ∈
-th latent variable. Suppose variables di, dj ∈ ![[Doublestruck R]](https://www.rsc.org/images/entities/char_e175.gif) are the ability of protein vi and protein vj generating edges in the network, respectively. Thus, we obtain the reliability score rij between protein vi and protein vj in the following form.
are the ability of protein vi and protein vj generating edges in the network, respectively. Thus, we obtain the reliability score rij between protein vi and protein vj in the following form.| rij = 1 − exp(−(〈disi,djsj〉) + eps), | (1) |
2.2 A probabilistic graphical model
In this method, a PPI network is represented by an undirected graph G(V,E), i.e. a vertex set including each protein as a vertex V = {v1, v2,…,vn}, and an edge set E = {(vi,vj)|, where there is an interaction between proteins vi and vj, 1 ≤ i,j ≤ n}. The symmetric adjacent matrix is denoted as W = (wij) ∈![[Doublestruck R]](https://www.rsc.org/images/entities/char_e175.gif) n×n, where wij = 1 if (vi,vj) ∈ E else wij = 0. The probabilistic graphical model can be described by the joint likelihood function over all variables as below.
n×n, where wij = 1 if (vi,vj) ∈ E else wij = 0. The probabilistic graphical model can be described by the joint likelihood function over all variables as below.| P(W,S,B,D) = P(W|S,D)P(S|B)P(D|γ)P(B), | (2) |
![[small script l]](https://www.rsc.org/images/entities/char_e146.gif) ) ∈
) ∈ ![[Doublestruck R]](https://www.rsc.org/images/entities/char_e175.gif) n×m is the propensity matrix, D = (di) ∈
n×m is the propensity matrix, D = (di) ∈ ![[Doublestruck R]](https://www.rsc.org/images/entities/char_e175.gif) n is the protein linkage ability vector of all n proteins involved in the PPI network. B = (β
n is the protein linkage ability vector of all n proteins involved in the PPI network. B = (β![[small script l]](https://www.rsc.org/images/entities/char_e146.gif) ) ∈
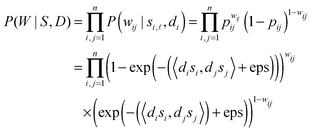
) ∈ ![[Doublestruck R]](https://www.rsc.org/images/entities/char_e175.gif) m is the parameter vector of S. P(W|S,D) is the probability of generating interaction wij between protein i and protein j in a PPI network. As shown above, wij is binary (0 or 1), which is supposed to follow the Bernoulli distribution with parameter pij = rij. Similar to ref. 27 and 28 we also assume that each si
m is the parameter vector of S. P(W|S,D) is the probability of generating interaction wij between protein i and protein j in a PPI network. As shown above, wij is binary (0 or 1), which is supposed to follow the Bernoulli distribution with parameter pij = rij. Similar to ref. 27 and 28 we also assume that each si![[small script l]](https://www.rsc.org/images/entities/char_e146.gif) comes from an exponential distribution with rate parameter β
comes from an exponential distribution with rate parameter β![[small script l]](https://www.rsc.org/images/entities/char_e146.gif) . Considering the scale-free property of PPI networks, the degree of distribution di in the PPI network approximates to a power law with a hyperparameter γ. Mathematically, the components of (2) can be described in detail as follows.
. Considering the scale-free property of PPI networks, the degree of distribution di in the PPI network approximates to a power law with a hyperparameter γ. Mathematically, the components of (2) can be described in detail as follows.| wij ∼ B(1,pij), |
For protein vi and latent variable ![[small script l]](https://www.rsc.org/images/entities/char_e146.gif) , draw the protein-propensity score:
, draw the protein-propensity score:
si![[small script l]](https://www.rsc.org/images/entities/char_e146.gif) ∼ Exp(β ∼ Exp(β![[small script l]](https://www.rsc.org/images/entities/char_e146.gif) ). ). |
 | (3) |
 | (4) |
| P(di|γ) ∝ d−γi, |
X = −log(D) and Y = log![[thin space (1/6-em)]](https://www.rsc.org/images/entities/char_2009.gif) P(D|γ). P(D|γ). | (5) |
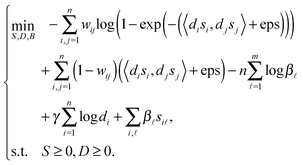 | (6) |
2.3 Parameter estimation
To solve the non-negative constrained optimization problem, we use the multiplicative updating rules, which show a good compromise between speed and ease of implementation, to alternately update the model parameters S, D and B. ‘t’ denotes the transpose of the matrix while ‘1n’ denotes the column vector of ones with n length. Similar to ref. 27 and 28 we can obtain the following updated formulae for parameters S, D, B, respectively. | (7) |
 | (8) |
 | (9) |
2.4 Main algorithm
The main algorithm of the new proposed assessment of Reliability Score based on a Probabilistic Graphical Model (RSPGM) is presented in Algorithm 2.4, where, 0m denotes the column vector of zeros with m length and ‘°’ denotes the Hadamard product of two matrices with the same size. For example, A = (aij), B = (bij) ∈![[Doublestruck R]](https://www.rsc.org/images/entities/char_e175.gif) n×m, thus (A°B)ij = aijbij.
n×m, thus (A°B)ij = aijbij.
3 Results
3.1 Databases to navigate the scored PPI network
Since PPI data from different molecular interaction databases are distinct, it is necessary to construct a relative comprehensive PPI network in C. elegans for further study. Here,| Algorithm 1 RSPGM | ||
|---|---|---|
| Input: m = 500, W, S, D, B, T = 300, σ = 0.01. | ||
| Output: reliability score matrix R for the PPI network. | ||
| 1: | Initialize S with a random n × m matrix, D with the 1n, B with the 0m initialization. | |
| 2: | Integrate the C. elegans PPI network, obtain the adjacent matrix W. | |
| 3: | Estimate γ by eqn (5). | |
| 4: | Iterate S, D, and B by eqn (7), (8) and (9), respectively. | |
| 5: | Until the iteration count is larger than T or ∥S(T+1) − S(T)∥ < σ. | |
| 6: | Repeat step 1–5 50 times, the final result produces the parameters with the minimum objective function in (6). | |
| 7: | R = 1 − exp(−((D × Dt)°(S × St) + eps × ones(n,n))). | |
we integrate PPI data of C. elegans from seven free available databases, i.e. DIP, BioGRID, IntAct, MINT, WormBase, WI8 and GeneOrienteer. The details are presented in Table 1.
| Database | Reference | Version |
|---|---|---|
| DIP | Salwinski et al.,10 2004 | Celeg20141001 |
| BioGRID | Chatr-aryamontri et al.,11 2013 | 3.2.119 |
| IntAct | Kerrien et al.,12 2011 | 2014-12-18 |
| MINT | Licata et al.,13 2012 | 2012-10-29 |
| WormBase | Harris et al.,14 2014 | WS245 |
| WI8 | Simonis et al.,15 2009 | WI8 |
| GeneOrienteer | Zhong and Sternberg,16 2006 | v2.25 |
We then filter the PPI data in terms of four criteria: (1) physical interactions which belong to the MI:0914 (association) type from Molecular Interaction (PSI MI 2.5); (2) no self-interactions (loops); (3) no repetitive interactions; (4) not containing interactions whose genes are not protein-coding, e.g. pseudogene, transposon or miRNA. The statistics of the original and filtered databases are discussed in Supplementary 1 Table 1 (ESI†).
According to the filter criterion, we construct an integrative protein–protein interaction network of C. elegans which contains 5039 nodes involving in 12![[thin space (1/6-em)]](https://www.rsc.org/images/entities/char_2009.gif) 951 PPIs, shown in Supplementary 1 Fig. 1 (ESI†). The intersection numbers and overlapping rates of any two filtered databases from the seven selected databases are provided in Supplementary 1 Table 2 (ESI†) that shows a low overlapping rate between most any two filtered databases. This indicates that interactions are partially recorded in different specific databases.
951 PPIs, shown in Supplementary 1 Fig. 1 (ESI†). The intersection numbers and overlapping rates of any two filtered databases from the seven selected databases are provided in Supplementary 1 Table 2 (ESI†) that shows a low overlapping rate between most any two filtered databases. This indicates that interactions are partially recorded in different specific databases.
3.2 Yeast PPI networks
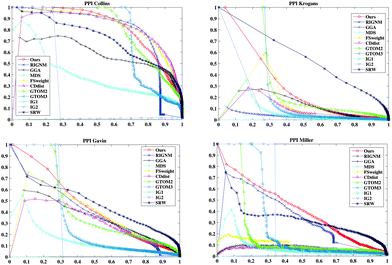
The yeast PPI networks are download from BioGRID (version 3.2.119). Four yeast PPI subnetworks filtered by different techniques are used for evaluation. The Collins dataset34 (short for PPICollins), the Krogans dataset35 (short for PPIKrogans) and the Gavin dataset36 (short for PPIGavin) are detected by the TAP-MS technique. The largest connected components of physical interactions of these subnetworks are 1002 proteins with 8313 PPIs, 2527 proteins with 6985 PPIs and 1359 proteins with 6541 PPIs, respectively. The Miller dataset37 (short for PPIMiller) is detected by the PCA technique, which has the largest connected component of physical interactions with 513 proteins and 1947 PPIs. Since PPICollins is in high-confidence, we employ it to evaluate the GO similarity and sequence consistency and compare the biological relevance and the accuracy of the prediction of the known protein complexes of PPI groups.3.3 Effectiveness validation of the reliability score
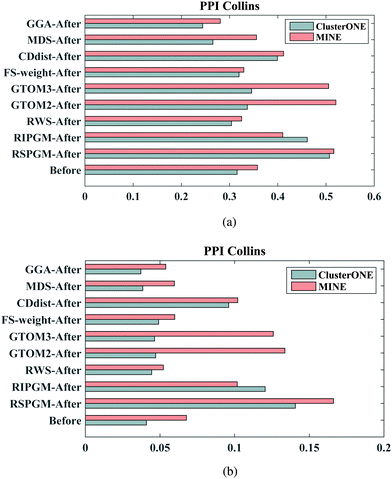
In this section, we first compare the RSPGM score with other scores obtained using existing methods on the four yeast datasets by a PR curve which presents recall against precision. Secondly, we validate the consistency between the RSPGM score and GO semantic similarity and sequence similarity, respectively. Moreover, we evaluate the functional relevance of the original and reconstructed PPI networks on several types of sources, including gene ontology, gene expression and essentiality analysis. Finally, we investigate and compare the accuracy of protein complex prediction between the original and the reconstructed PPI network.We then calculate the GO semantic similarity, the Pearson correlation coefficient of gene expression, and the co-essentiality percentage of PPIs in ‘Before’, ‘After’, ‘New’, ‘Removed’ and ‘Confirmed’ generated from RSPGM on PPICollins. The results are shown in Fig. 3. Here, we use profiles to characterize the expression dynamics for 3552 significant periodic genes over 36 time points. The raw data are available on gene expression omnibus (GEO)42 with accession number GSE3431.31 Additionally, the yeast essential gene list is retrieved from the Saccharomyces Genome Database.43 The essentiality score is calculated by the percentage of the number of PPIs, in which two proteins have the same essentiality (two interacting proteins are in the essential list or not in the essential list simultaneously). As shown in Fig. 3, the ‘After’ groups has a higher functional relevance than ‘Before’ groups on gene expression, GO similarity and essentiality. Moreover, the ‘Confirmed’ group has almost the highest functional relevance score compared with other groups. The functional relevance score of the ‘Removed’ group is lower than the ‘New’ group. We also evaluate the functional relevance of our method and other comparative methods on PPICollins and PPIKrogans. The results are demonstrated in Supplementary 1 Fig. 2–5 (ESI†).
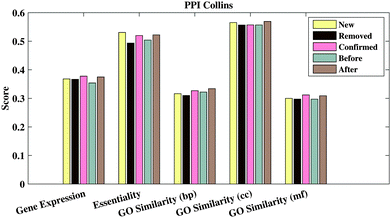 | ||
| Fig. 3 Gene expression PCC, co-essentiality percentage and three branches' GO-based similarity of different PPI groups generated from RSPGM for PPICollins. | ||
3.4 Application and evaluation of the C. elegans PPI network
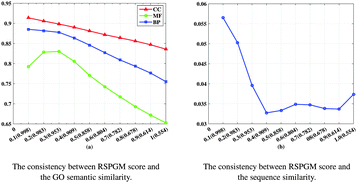
We assign a RSPGM score for each PPI on the new integrative PPI network of C. elegans to assess the reliability of protein pairs. The adjacent matrix (5039 × 5039) is built according to 12![[thin space (1/6-em)]](https://www.rsc.org/images/entities/char_2009.gif) 951 PPIs of integrative PPI networks of C. elegans. Then, this W as long as other settings are applied based on Algorithm 2.4 to obtain the reliability score for each PPI. The data of PPIs with RSPGM scores is available at our website and in the Supplementary 2 ESI.† In this subsection, for the new integrative C. elegans network, we firstly validate the consistency between our RSPGM score, the GO and sequence similarity. Then, we provide an example to infer the interaction path.
951 PPIs of integrative PPI networks of C. elegans. Then, this W as long as other settings are applied based on Algorithm 2.4 to obtain the reliability score for each PPI. The data of PPIs with RSPGM scores is available at our website and in the Supplementary 2 ESI.† In this subsection, for the new integrative C. elegans network, we firstly validate the consistency between our RSPGM score, the GO and sequence similarity. Then, we provide an example to infer the interaction path.
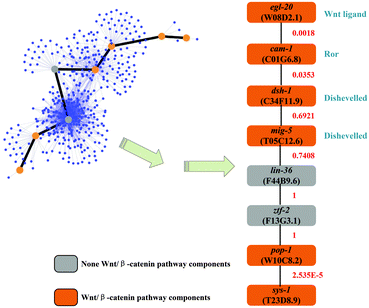
A well-studied C. elegans pathway, the canonical Wnt/β-catenin pathway, is used as the reference to validate interaction path inference results. This pathway is responsible for modulating the expression of specific target genes by effector protein β-catenin. The canonical Wnt/β-catenin pathway is a signal transduction pathway from Wnt ligands to β-catenin protein.48 Here, we inferred the interaction path between one type of Wnt ligand and one type of β-catenin protein. This inferred interaction path will be useful for pathway inference.
Gene egl-20 (W08D2.1) produces one type of Wnt ligand, while sys-1 (T23D8.9) produces a β-catenin protein. We inferred an interaction path between egl-20 and sys-1. Totally 1415 candidate paths have been found by setting L = 7, which represents the maximum of finding the candidate path length (details in the Supplementary 3 ESI†). The inferred interaction path with the highest path score is shown in Fig. 5. Moreover, for the 8 genes on the interaction path, 6 of them, 75%, are Wnt/β-catenin pathway related genes. These 6 genes have been validated and comprehensively studied in other literature reports.49 Also, for all 1415 possible candidate paths, they totally include 280 genes. Among them, only 17 genes (the gene name with symbol ‘#’ in the Supplementary 3 ESI†), about 6%, are Wnt/β-catenin pathway components. In the inferred interaction path, it is a high rate (75%) of the Wnt pathway component, although most genes in the possible candidate path set are not. Therefore, the performance of interaction path inference is relatively accurate by using the reliability score computed from the RSPGM algorithm.
3.5 Website server
To query and visualize the PPI network with RSPGM scores, we build a user interactive website, available at http://rspgm.bionetworks.tk/. This website is in support of two types of queries, single gene query and multiple gene query. User can type a single gene name or multiple gene names in the search bar. It will return a subnetwork graph in the webpage, shown in Fig. 6. The details of the usage can be found in Supplementary 1 Section XIII (ESI†).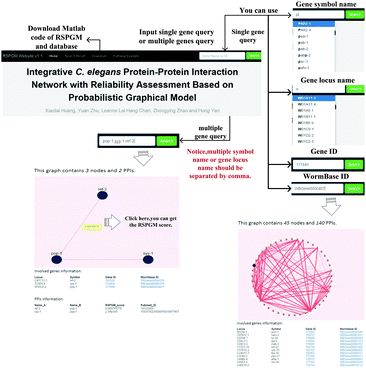 | ||
| Fig. 6 The website is designed for querying and visualizing RSPGM scores of PPI subnetworks of single gene or multiple genes in C. elegans. | ||
We use SQLite version 3.8.8.3 to store the data and execute the SQL query for the single gene and multiple gene query. Mojolicious version 6.06, a Perl real-time web framework, is employed to build the website. With the help of Cytoscape.js version 2.3.11, the network graphs are illustrated in the website.
4 Discussion
In this paper, we constructed a PPI network in C. elegans by integrating data from seven molecular interaction databases. This integrative PPI network was subsequently evaluated by our newly proposed protein–protein interaction reliability assessment method, RSPGM. This weighted PPI network is useful for pathway inference. Also, we built a website for querying and visualizing protein–protein interactions with RSPGM scores in the C. elegans PPI network.In the consistency validation between the RSPGM score and GO similarity, sequence similarity, it shows a significant decreasing trend in yeast data. However, this is not very significant in current C. elegans data. It may be due to the non-full map of protein–protein interactome in C. elegans currently.7 The RSPGM algorithm is based on the topology of the input network. Therefore, an incomplete protein–protein interactome may disturb the result of RSPGM scoring. In the functional relevance validation, the PPI groups in the reconstructed network generated by RSPGM have higher GO similarity, gene expression PCC and essentiality percentages than those in the original network, and obtain improved performance for the prediction of known protein complexes.
In the interaction path validation, 6 out of 8 genes are related to the reference Wnt pathway in the example shown in Section 3.4.2. The other two genes, lin-36 (F44B9.6) and ztf-2 (F13G3.1), have not been shown to be the components of the Wnt pathway. However, in the inferred interaction path, the PPI scores corresponding to these two genes are very high, (Fig. 5). This indicates that these two genes are hub nodes in the network which may be involved in other biological pathways. Generally, several different pathways can cooperate to possess particular biological functions.50 The lin-36 gene is the SynMuv B pathway component.51 It has been validated to interact with eor-1 which belongs to the Ras/ERK pathway to cooperate with the Wnt pathway.52 The ztf-2 gene encodes an orthology of human ovo-like zinc finger 2 (Ovol2) which has been reported to act as the downstream of the Wnt pathway.53 Therefore, both lin-36 and ztf-2 are indirectly related to the Wnt pathway, which implies that the inferred interaction path in the example is very close to the Wnt/β-catenin pathway.
In a future study, weighted PPI networks along with other data sources, such as PDIs, genetic interactions (GIs) and perturbation data, will be simultaneously considered for pathway inference.
Acknowledgements
This work is supported by the Hong Kong Research Grants Council (Project HKBU5/CRF/11G) and City University of Hong Kong (Project 9610326), the National Science Foundation of China (Project 11401110), the Natural Science Foundation of Guangdong Province (Project 2013KJCX0086) and the Research Center Foundation of School of Automation of China University of Geosciences (Wuhan) (Project AU2015CJ008).References
- N. Pratanwanich and P. Lió, Mol. BioSyst., 2014, 10, 1538–1548 RSC.
- O. Ourfali, T. Shlomi, T. Ideker, E. Ruppin and R. Sharan, Bioinformatics, 2007, 23, i359–i366 CrossRef CAS PubMed.
- A. Todor, H. Gabr, A. Dobra and T. Kahveci, Bioinformatics, 2014, 30, i96–i104 CrossRef CAS PubMed.
- D. Kleftogiannis, L. Wong, J. A. Archer and P. Kalnis, Bioinformatics, 2015, btv138 Search PubMed.
- A. Vinayagam, J. Zirin, C. Roesel, Y. Hu, B. Yilmazel, A. A. Samsonova, R. A. Neumüller, S. E. Mohr and N. Perrimon, Nat. Methods, 2014, 11, 94–99 CrossRef CAS PubMed.
- Y. Ko, C. Zhai and S. Rodriguez-Zas, BMC Syst. Biol., 2009, 3, 54 CrossRef PubMed.
- K. C. Gunsalus and K. Rhrissorrakrai, Curr. Opin. Genet. Dev., 2011, 21, 787–798 CrossRef CAS PubMed.
- A. Emamjomeh, B. Goliaei, J. Zahiri and R. Ebrahimpour, Mol. BioSyst., 2014, 10, 3147–3154 RSC.
- I. Saha, J. Zubek, T. Klingström, S. Forsberg, J. Wikander, M. Kierczak, U. Maulik and D. Plewczynski, Mol. BioSyst., 2014, 10, 820–830 RSC.
- L. Salwinski, C. S. Miller, A. J. Smith, F. K. Pettit, J. U. Bowie and D. Eisenberg, Nucleic Acids Res., 2004, 32, D449–D451 CrossRef CAS PubMed.
- A. Chatr-aryamontri, B. J. Breitkreutz, S. Heinicke, L. Boucher, A. Winter, C. Stark, J. Nixon, L. Ramage, N. Kolas and L. Oonnell, et al. , Nucleic Acids Res., 2013, 41, D816–D823 CrossRef CAS PubMed.
- S. Kerrien, B. Aranda, L. Breuza, A. Bridge, F. Broackes-Carter, C. Chen, M. Duesbury, M. Dumousseau, M. Feuermann and U. Hinz, et al. , Nucleic Acids Res., 2011, 40, D841–D846 CrossRef PubMed.
- L. Licata, L. Briganti, D. Peluso, L. Perfetto, M. Iannuccelli, E. Galeota, F. Sacco, A. Palma, A. P. Nardozza and E. Santonico, et al. , Nucleic Acids Res., 2012, 40, D857–D861 CrossRef CAS PubMed.
- T. W. Harris, J. Baran, T. Bieri, A. Cabunoc, J. Chan, W. J. Chen, P. Davis, J. Done, C. Grove and K. Howe, et al. , Nucleic Acids Res., 2014, 42, D789–D793 CrossRef CAS PubMed.
- N. Simonis, J.-F. Rual, A.-R. Carvunis, M. Tasan, I. Lemmens, T. Hirozane-Kishikawa, T. Hao, J. M. Sahalie, K. Venkatesan and F. Gebreab, et al. , Nat. Methods, 2009, 6, 47–54 CrossRef CAS PubMed.
- W. Zhong and P. W. Sternberg, Science, 2006, 311, 1481–1484 CrossRef CAS PubMed.
- S. Suthram, T. Shlomi, E. Ruppin, R. Sharan and T. Ideker, BMC Bioinf., 2006, 7, 360 CrossRef PubMed.
- X. Lin, M. Liu and X. Chen, BMC Bioinf., 2009, S5 Search PubMed.
- M. Deng, F. Sun and T. Chen, Pac. Symp. Biocomput., 2003, 8, 140–151 Search PubMed.
- C. Lei and J. Ruan, Bioinformatics, 2013, 29, 355–364 CrossRef CAS PubMed.
- Y. Hulovatyy, R. W. Solava and T. Milenković, PLoS One, 2014, 9, e90073 Search PubMed.
- J. Chen, M. L. Lee and S. K. Ng, Bioinformatics, 2006, 22, 1998–2004 CrossRef CAS PubMed.
- J. Hou and A. Saini, Math. Biosci., 2013, 245, 226–234 CrossRef CAS PubMed.
- R. Saito, H. Suzuki and Y. Hayashizaki, Nucleic Acids Res., 2002, 30, 1163–1168 CrossRef CAS PubMed.
- R. Saito, H. Suzuki and Y. Hayashizaki, Bioinformatics, 2003, 19, 756–763 CrossRef CAS PubMed.
- X. Luo, Z. You, M. Zhou, S. Li, H. Leung, Y. Xia and Q. Zhu, Sci. Rep., 2015, 5, 7702 CrossRef CAS PubMed.
- Y. Zhu, X. F. Zhang, D. Q. Dai and M. Y. Wu, IEEE/ACM Trans. Comput. Biol. Bioinf., 2013, 10, 219–225 CrossRef PubMed.
- X. F. Zhang, D. Q. Dai, L. Ou-Yang and H. Yan, BMC Bioinf., 2014, 15, 186 CrossRef PubMed.
- J. M. Ranola, S. Ahn, M. Sehl, D. J. Smith and K. Lange, Bioinformatics, 2010, 26, 2004–2011 CrossRef CAS PubMed.
- R. Schweiger, M. Linial and N. Linial, Bioinformatics, 2011, 27, i142–i148 CrossRef CAS PubMed.
- L. Ou-Yang, D. Q. Dai, X. L. Li, M. Wu, X. F. Zhang and P. Yang, BMC Bioinf., 2014, 15, 335 CrossRef PubMed.
- X. F. Zhang, D. Q. Dai and X. X. Li, IEEE/ACM Trans. Comput. Biol. Bioinf., 2012, 9, 857–870 CrossRef PubMed.
- Z. M. Saul and V. Filkov, Bioinformatics, 2007, 23, 2604–2611 CrossRef CAS PubMed.
- S. R. Collins, K. Patrick, X. C. Zhao, J. F. Greenblatth, F. Spencerg, F. C. P. Holstege, J. S. Weissmana and N. J. Krogana, Mol. Cell. Proteomics, 2007, 6, 439–450 CAS.
- N. J. Krogan, G. Cagney, H. Yu, G. Zhong, X. Guo, A. Ignatchenko, J. Li, S. Pu, N. Datta and A. P. Tikuisis, et al. , Nature, 2006, 440, 637–643 CrossRef CAS PubMed.
- A. C. Gavin, P. Aloy, P. Grandi, R. Krause, M. Boesche, M. Marzioch, C. Rau, L. Jensen, S. Bastuck and B. Dümpelfeld, et al. , Nature, 2006, 440, 631–636 CrossRef CAS PubMed.
- J. P. Miller, R. S. Lo, A. Ben-Hur, C. Desmarais, I. Stagljar, W. S. Noble and S. Fields, Proc. Natl. Acad. Sci. U. S. A., 2005, 102, 12123–12128 CrossRef CAS PubMed.
- S. Oliver, Nature, 2000, 403, 601–603 CrossRef CAS PubMed.
- G. Yu, F. Li, Y. Qin, X. Bo, Y. Wu and S. Wang, Bioinformatics, 2010, 26, 976–978 CrossRef CAS PubMed.
- J. Z. Wang, Z. Du, R. Payattakool, S. Y. Philip and C. Chen, Bioinformatics, 2007, 23, 1274–1281 CrossRef CAS PubMed.
- I. Korf, M. Yandell and J. Bedell, Blast, O'Reilly Media, 2003 Search PubMed.
- R. Edgar, M. Domrachev and A. E. Lash, Nucleic Acids Res., 2002, 30, 207–210 CrossRef CAS PubMed.
- S. S. Dwight, R. Balakrishnan, K. R. Christie, M. C. Costanzo, K. Dolinski, S. R. Engel, B. Feierbach, D. G. Fisk, J. Hirschman and E. L. Hong, et al. , Briefings Bioinf., 2004, 5, 9–22 CrossRef CAS.
- T. Nepusz, H. Yu and A. Paccanaro, Nat. Methods, 2012, 9, 471–472 CrossRef CAS PubMed.
- K. Rhrissorrakrai and K. C. Gunsalus, BMC Bioinf., 2011, 12, 192 CrossRef PubMed.
- H.-W. Mewes, C. Amid, R. Arnold, D. Frishman, U. Güldener, G. Mannhaupt, M. Münsterkötter, P. Pagel, N. Strack and V. Stümpflen, et al. , Nucleic Acids Res., 2004, 32, D41–D44 CrossRef CAS PubMed.
- A. Gitter, J. Klein-Seetharaman, A. Gupta and Z. Bar-Joseph, Nucleic Acids Res., 2011, 39, e22 CrossRef PubMed.
- C. Y. Logan and R. Nusse, Annu. Rev. Cell Dev. Biol., 2004, 20, 781–810 CrossRef CAS PubMed.
- H. Sawa and H. C. Korswagen, Wnt signaling in C. elegans, WormBook, 2005 Search PubMed.
- R. Derynck, B. P. Muthusamy and K. Y. Saeteurn, Curr. Opin. Cell Biol., 2014, 31, 56–66 CrossRef CAS PubMed.
- D. S. Fay and J. Yochem, Dev. Biol., 2007, 306, 1–9 CrossRef CAS PubMed.
- R. M. Howard and M. V. Sundaram, Genes Dev., 2002, 16, 1815–1827 CrossRef CAS PubMed.
- J. Wells, B. Lee, A. Q. Cai, A. Karapetyan, W. Lee, E. Rugg, S. Sinha, Q. Nie and X. Dai, J. Biol. Chem., 2009, 284, 29125–29135 CrossRef CAS PubMed.
Footnotes |
| † Electronic supplementary information (ESI) available. See DOI: 10.1039/c5mb00417a |
| ‡ These authors contributed equally to this work. |
| This journal is © The Royal Society of Chemistry 2016 |

