
Reconstruction and analysis of a genome-scale metabolic model for Eriocheir sinensis eyestalks†
Bin
Wang
ab,
Qianji
Ning
*a,
Tong
Hao
*b,
Ailing
Yu
b and
Jinsheng
Sun
*b
aCollege of Life Sciences, Henan Normal University, Xinxiang 453007, Henan, P. R. China. E-mail: nqjnqj1964@163.com
bTianjin Key Laboratory of Animal and Plant Resistance/College of Life Science, Tianjin Normal University, Tianjin 300387, P. R. China. E-mail: jinshsun@163.com; joyht2001@163.com
First published on 6th November 2015
Abstract
The eyestalk of Eriocheir sinensis has significant biological functions with many nerve peptide hormones expressed in the X-organ which exists in the eyestalk. A metabolic network model is an effective tool for the systematic study of E. sinensis eyestalks. In this work, we reconstructed a metabolic network model for E. sinensis eyestalks based on transcriptome sequencing. The model contains 1304 reactions, 1381 unigenes and 1243 metabolites distributing in 98 pathways. The reconstructed metabolic network model was used for the functional module and block metabolite analysis of eyestalks, which reveals that the function of the eyestalk network agrees with its function as the centre of the E. sinensis endocrine system. The difference expression analysis of reactions in the model indicates that the eyestalk mainly functions in the regulation of amino acids, carbohydrate and nucleotide metabolism.
Introduction
E. sinensis, also known as crabs, is one of the most important aquatic economic animals with a high commercial value as a food source. Many studies have been performed focusing on several or single genes,1 proteins2 or a specific pathway3 to accelerate the growth or further investigate the metabolic system of E.sinensis. In 2014, Sun Yan et al. conducted transcriptome sequencing on the hepatopancreas, the eyestalk and the Y-organ of E. sinensis.4 Subsequently, Hao Tong et al. constructed a protein interaction network of these organs.5 Eyestalks which contain the X-organ sinus gland (XO-SG) are known as the endocrine control center of E. sinensis. It secretes and produces a variety of neuropeptide hormones which regulates important physiological activities of the crustacean animals, such as growth, metabolism and reproduction.Many research studies have focused on the profiles or genes of eyestalks.6,7 However, a systematic study of the eyestalk metabolic system is still missing. In recent decades, a forward trend of the network biology is to use genomic data and molecular mechanisms to construct predictive models.8 A genome-scale metabolic network model is an important part in this area and is a useful tool for a systematic study of specific organisms or organs.9 In recent years, with the development of high throughput data analysis, the reconstruction of a genome-scale metabolic network model has developed rapidly10,11 with interaction of knowledge on biochemistry and physiological metabolism.12 Since Edwards and Palsson et al. constructed the first genome-scale metabolic network model for Haemophilus influenzae in 1999,13 plenty of models have been constructed and applied in the analysis of various biological phenotypes, which reflects the important role of the genome-scale metabolic network model in the research of metabolism in a wide range of organisms. Currently, more than one hundred metabolic network models have been reconstructed for bacteria,14 plants,15,16 animals17 and human.18,19 The models have a wide use in areas such as metabolic engineering, antibiotic design, and organismal and enzyme evolution.20
For the systematic study of the metabolic function of E. sinensis eyestalks, we reconstructed a genome-scale metabolic model for eyestalks based on transcriptome sequencing. The model was revised with the simulation on the synthesis capability of non-essential amino acids. Functional analysis of the reconstructed model was used to reveal the fundamental function of the eyestalk metabolism system and the vital function as the center of the crustaceans endocrine system. The differentially expressed unigenes were analyzed for further understanding the influence of 5-HT and glucose on the metabolism of eyestalks. The model provides a useful tool for the in-depth study on the function of E. sinensis eyestalks, as well as provides an important reference for the future study of aquatic crustacean species.
Methods
Preliminary reconstruction of the genome-scale metabolic network model
The unigene information was obtained from the transcriptional sequencing of E. sinensis eyestalks.4 The KO annotate of the unigenes was supplied in the work of Yan Sun et al.4 The related biochemical information of proteins, metabolic reactions, pathways and metabolic subsystems was matched from the KEGG database with KO as a bridge. The draft reconstruction is obtained with the relationship of unigene–protein-reaction is established according to the KEGG database.The draft reconstructed metabolic network on the genome-scale is far from perfect. Further curation is needed. Firstly, the chiral molecule of glucose is revised. In the KEGG database, glucose was shown in three forms: D-glucose, alpha-D-glucose and beta-D-glucose. D-glucose is the general name of glucose, which includes both alpha-D-glucose and beta-D-glucose. In order to avoid the confusion of glucose in the following curation and simulation, all the glucose in the network was unified to be alpha-D-glucose as the alpha type is the main existing form of most sugar in biological organisms.
Gap filling
The gaps in the network were filled with the method based on the connectivity of weak connected components (WCCs).21,22 Firstly, the reactions that exist in the whole reaction list from the KEGG database but not the preliminary reconstructed network were considered as the candidate dataset for gap filling. Secondly, as graph theory has been proved to be a useful train of thought for biological analysis,23–26 the network was converted into a reaction map with reactions as nodes and metabolites as edges according to the metabolic flux direction. In this way, the metabolic network was divided into different WCCs. Finally, the reactions that could be used to connect different WCCs were searched in the candidate dataset. These reactions were identified as the gap filling reactions.The gaps were filled both on the pathway21 and global scales.22 These two methods were used sequentially to fill the gaps in the network to a maximum extent. Gap filling on the pathway scale prefers to decrease the number of WCCs in the same pathway, whereas that on the global scale inclines to reduce the WCCs in the whole network.
Simulative curation of the model
In order to determine whether the reconstruction can correctly reflect the metabolic processes of the living organisms, we firstly convert the reaction list to standard SBML document which can be read by COBRA27 and analyzed with flux balance analysis (FBA) which is the commonly used optimization simulation method28–30 for metabolic networks.The flux ranges of reactions in the network were limited for simulations. The upper and lower flux of the reversible reaction, the irreversible reaction and the transport reaction were set to be (−1000, 1000)12 (0, 1000), and (−1000, 1000) mmol g DW−1 h−1, respectively. The limits of exchange reactions for essential amino acids, glucose, H2O, Fe3+, alpha-D-glucose, potassium, magnesium, calcium, which are needed to be exchanged with the environment, were set to be (−5, 1000) mmol g DW−1 h−1, while those for non-essential amino acids which can be synthesized by E. sinensis were set to (0, 1000) mmol g DW−1 h−1.
In order to investigate the biosynthesis capability of non-essential amino acids (alanine, asparagine, aspartic acid, cysteine, glutamine, glutamate, glycine, proline, serine, and tyrosine), 10 non-essential amino acids were set to be objective functions, respectively. If an amino acid cannot be synthesized, there must be the absence of reaction(s) in the network. The missing reaction(s) are found by backtracking along the synthesis pathway of the amino acid. With the addition of missing reaction(s), the production of the amino acid was calculated again to confirm the synthesis capability of the model.
Network decomposition
Model decomposition is performed by applying the method based on the combination of dendrogram and modularity.31,32 The network was decomposed with four steps. Firstly, the network was converted into a reaction map. In order to achieve the conversion, current metabolites (such as ATP, ADP, H2O, NAD+, NADH, Pi33) are firstly removed. Reactions exist as nodes and the metabolites act as edges in the map. Secondly, the reaction map was preliminary decomposed according to the dendrogram tree with no more than 50 nodes in a cluster. Thirdly, the preliminary decomposition was optimized by the elimination of the Very Small Cluster (VSC) with no more than 10 nodes as the first optimization step. Fourthly, the modularity of the network was maximization in the second optimization step with the final number of cluster set to be 10. With the decrease of module numbers in the fourth step, the partition with highest modularity was considered as the final decomposition result.Detection of differentially expressed protein in eyestalks
The healthy E. sinensis (body weight 5–6 g), with good vitality, was bought from Huada, and then acclimatized in freshwater at 18–20 °C for 3–5 days.A total of 180 E. sinensis that were selected randomly from the rearing animals in the laboratory were equally divided into three groups. The group that was injected with 5-HT was the experimental group (A1). The second group that was injected with glucose was the experimental group (A2). The third group, which was injected with distilled water, was the control group (A0) (The weight of each E. sinensis was measured before injection. The volume injected (ul) was the same as the weight (g) in terms of number.) One hour later, eyestalks of E. sinensis from all these groups were removed and frozen in liquid nitrogen immediately storing at −80 °C until the extraction of RNA.
To extract RNA, the following steps were taken. Firstly, the total RNA from eyestalks in groups A0, A1 and A2 was extracted using the TRIzol method (Invitrogen, USA). Secondly, the cDNA was synthesized using the superScript III first-strand synthesis system (Invitrogen, USA). After extracting the total RNA from the three samples, the generated cDNA library was sequenced using Illumina HiSeqTM2000.
Results and discussion
Preliminary reconstruction of the network
Totally 48![[thin space (1/6-em)]](https://www.rsc.org/images/entities/char_2009.gif) 835 unigenes were obtained in the transcriptional sequencing of eyestalks, in which 12864 were found to be matched with KO from the KEGG database.4 The preliminarily reconstructed metabolic network was obtained through matching unigenes to related reactions and pathways from the KEGG database through KO as a bridge. The network included 1208 reactions and 1381 unigenes, which distributed in 98 pathways and 11 subsystems (additional file 1). 6 reactions with D-glucose were curated to be alpha-D-glucose for the standardization of chiral metabolites.
835 unigenes were obtained in the transcriptional sequencing of eyestalks, in which 12864 were found to be matched with KO from the KEGG database.4 The preliminarily reconstructed metabolic network was obtained through matching unigenes to related reactions and pathways from the KEGG database through KO as a bridge. The network included 1208 reactions and 1381 unigenes, which distributed in 98 pathways and 11 subsystems (additional file 1). 6 reactions with D-glucose were curated to be alpha-D-glucose for the standardization of chiral metabolites.
Gap filling
A ‘gap’ is defined as a reaction that takes place in a pathway/network different to that of its two neighbor reactions. Network gaps will lead to unbalanced flux distribution. Therefore, it is necessary to fill them before simulation. Filling gaps can improve the connectivity of the network and enable a pathway to perform its normal function.34Gaps were filled on the pathway and global scale sequentially. With gap filling on the pathway scale, the number of reactions in the network increased from 1028 to 1186. 158 new reactions were added, most of which were involved in metabolism of arginine, proline, caffeine, cysteine, methionine, sphingolipid, cytochrome P450 and biosynthesis of phenylpropanoid and steroid. With gap filling on the global scale, 60 more reactions were added. The number of WCCs decreased from 218 to 79 in the gap filling step, in which 108 decreases on the pathway scale and 31 decreases on the global scale. After gap filling, the network contains 1246 reactions.
Addition of transport and exchange reactions
In order to distinguish the intracellular and extracellular parts of the cell, the metabolites and reactions in the network were divided into two compartments: intracellular and extracellular. The metabolites were discriminated as intracellular or extracellular according to their locations. The reactions with all the related metabolites located in intracellular are identified as intracellular reactions. The reactions with all the related metabolites in extracellular are identified as extracellular reactions. The reactions with related metabolites distribute in both intracellular and extracellular are identified as transport reactions.Actually most reactions in the metabolic network are intracellular reactions, whereas the organisms cannot grow without exchanging substances with the extracellular environment by absorbing nutrients or discharging metabolic products. In order to enable the model the capability of exchanging substances with the outside world, transport and exchange reactions for the basic nutrients that the eyestalk cells may exchange with external environment were added. We totally added transport and exchange reactions for 26 substances including 20 kinds of amino acids, H2O, Fe3+, potassium, alpha-D-glucose, magnesium and calcium. With addition of transport and exchange reactions, 1299 reactions were included in the network. Both intracellular and extracellular metabolites are involved in the transport reactions, and all the metabolites are extracellular in the exchange reactions.
Simulation curation
In order to investigate the quality of the model, the capability of synthesizing non-essential amino acids was verified. The result showed that two of non-essential amino acids, asparagine and cysteine, cannot be synthesized. According to the map of Alanine, aspartate and glutamate metabolism in KEEG, L-asparagine (KEGG NO.: C00152) is the product of two reactions (R00483 and R00578). When R00483 (ATP + L-aspartate + ammonia ⇔ AMP + diphosphate + L-asparagine) is added to the network, asparagine can be successfully synthesized. Therefore, it was finally found that the break of the asparagines synthesis route is due to the absence of reaction R00483. With the same way, the synthesis route of cysteine (C00097) was remedied by the addition of four reactions (R00528, R00858, T00027, E00027). These reactions enable the network to absorb sulfate from the environment35 and convert it into sulfide which is necessary in the synthesis of cysteine. With these curations, all the ten non-essential amino acids can be successfully synthesized by the reconstructed network model. The curated model contains 1340 reactions, 1243 metabolites, 1381 unigenes, which distributes in 98 pathways and 11 subsystems (ESI,† file S1). The overview characteristics of the reconstructed model are shown in Table 1.| Items | Count |
|---|---|
| Unigenes | 1381 |
| Reactions | 1304 |
| Metabolic reactions | 1250 |
| Transport reactions | 27 |
| Exchange reactions | 27 |
| Metabolites | 1243 |
| Intracellular metabolites | 1214 |
| Extracellular metabolites | 29 |
| Pathways | 98 |
| Subsystems | 11 |
Topology and functional analysis of the reconstructed metabolic network model
| Graph matrics | Value | |
|---|---|---|
| Nodes | 1128 | |
| Arcs | 1970 | |
| Edges | 769 | |
| Density | 0.002757 | |
| Average degree | 4.856383 | |
| Average path length | 8.95101 | |
| Diameter | 21 | |
| Biggest cluster | Nodes | 797 |
| Arcs | 1702 | |
| Edges | 717 | |
| Bowtie of biggest cluster | GSC | 394(49.4%) |
| S | 75(9.4%) | |
| P | 253(31.7%) | |
| IS | 75(9.4%) | |
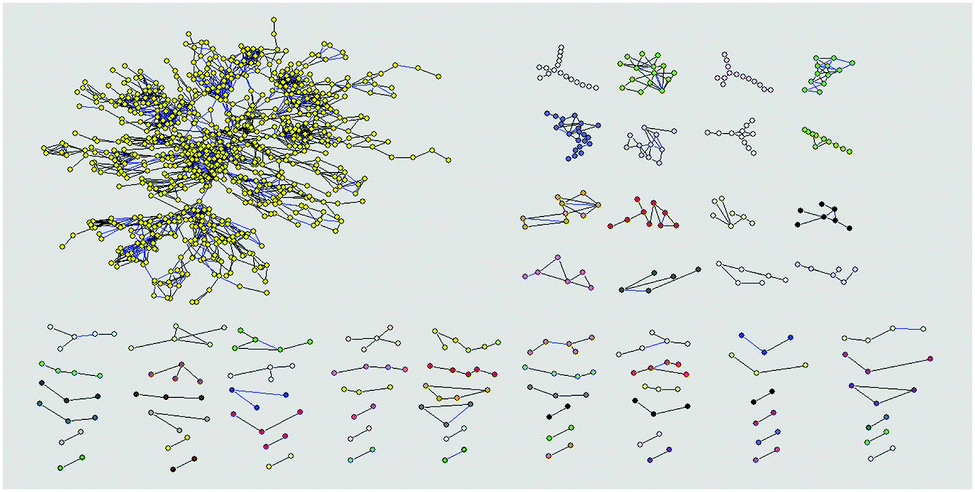 | ||
| Fig. 1 The WCCs (weak connected components) in the eyestalk metabolic network. Totally 71 components are shown which are distinguished by different colors. | ||
| Threshold | Modules | Modularity | |
|---|---|---|---|
| Preliminary | 50 | 57 | 0.622 |
| First | 10 | 22 | 0.812 |
| Second | 10 | 16 | 0.827 |
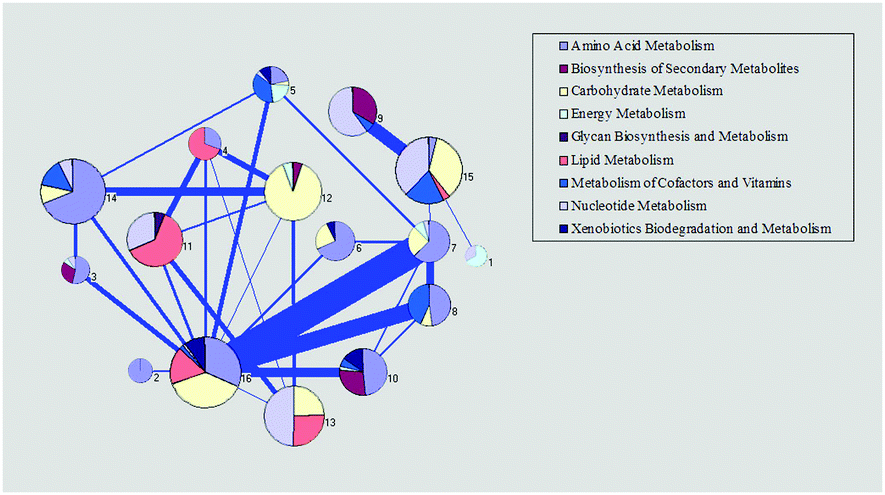 | ||
| Fig. 2 Functional analysis of the reconstructed metabolic network. Each pie chart represents a single module divided into several different subsystems. The percentage of reactions in a certain subsystem are shown by the area in a pie chart. The thickness of the line between modules represents the strength of the connection. | ||
| Module number | Metabolic process |
|---|---|
| Module 2 | Lysine biosynthesis and degradation |
| Module 3 | Leucine and isoleucine degradation |
| Module 4 | Glycine metabolism |
| Module 5 | Tryptophan metabolism |
| Module 6 | Isoleucine degradation |
| Module 7 | Serine and glycine metabolism |
| Module 8 | Cysteine metabolism |
| Module 10 | Tyrosine and phenylalanine metabolism |
| Module 14 | Arginine, proline, glutamate metabolism |
| Module 15 | Cysteine metabolism |
| Module 16 | Lysine, isoleucine degradation; glycine metabolism |
To further confirm the core function of the modules, we considered the reactions with the highest degree in the module as the core reactions and analyzed the subsystem of the core reactions, which may inflect the core function of the related module. The first three reactions with the highest degrees were checked. We found that the function of the core reactions in each module agreed well with the main functions in Fig. 2 (ESI,† file S3).
In the common metabolism process of a cell, exogenous nutrients are firstly decomposed into primary metabolites and then synthesized into 12 kinds of common precursors, such as glucose-6-phosphate, fructose-6-phosphate, phosphoenolpyruvic acid, pyruvic acid (as shown in Fig. 3). The common precursors are subsequently used for the synthesis of the key components of the cell, such as amino acids, nucleotides, fatty acid and sugar.42 In order to verify the basic metabolic functions of the genome-scale metabolic network model for E. sinensis eyestalks, the synthesis process of the 12 common precursors was investigated. As shown in Fig. 3, all the 12 precursors can be found in the network. They distribute in three modules, and half of them were in module 12 where reactions were mainly associated with carbohydrate metabolism. The TCA cycle scattered in two modules, which agreed with the diversity of the TCA pathway.43 In addition to the common precursors, module 16 contained a number of building blocks from these precursors, such as aspartate and asparagine. The above analysis showed that the eyestalk has the basic capability of synthesizing common precursors and building blocks.
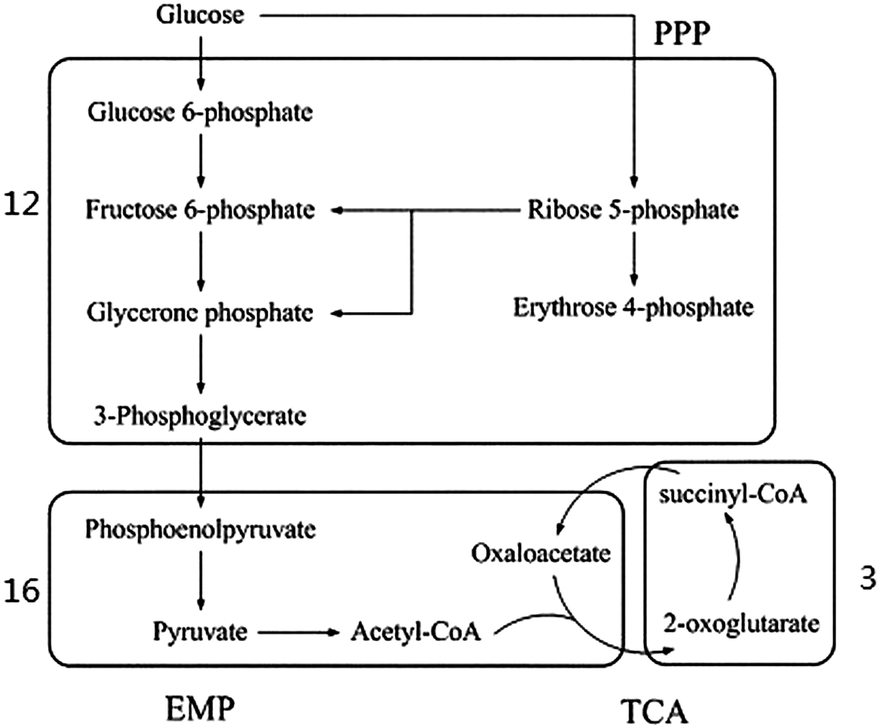 | ||
| Fig. 3 Distribution of 12 precursors in the modules of the eyestalk metabolic network. All precursors were distributed in three modules, and half of them centered in module 12. | ||
Analysis of differentially expressed unigenes
In the comparison of the mRNA expression from A0 with that from A1 and A2, we got 51810 and 53833 differentially expressed unigenes respectively. In these unigenes, both 135 can be found in the metabolic network respectively (ESI,† file S4). The result of the expression profile is shown in Table 5.
| Experimental | Differentially expressed unigenes | Differentially expressed unigenes in module | Differentially expressed unigenes in the biggest WCC | ||||||
|---|---|---|---|---|---|---|---|---|---|
| A0 | 51810 |
Up | 12716 |
135 | Up | 11 | 89 | Up | 5 |
| A1 | Down | 39094 |
Down | 124 | Down | 84 | |||
| A0 | 53833 |
Up | 49048 |
135 | Up | 118 | 89 | Up | 77 |
| A2 | Down | 4785 | Down | 17 | Down | 12 | |||
5-HT injection results in the expression changes of 90 unigenes which are related to 90 reactions. These reactions were mainly in modules 7, 11, 12, 13, 14, and 15. To be specific, the metabolic difference reaction of amino acid mostly distributed in module 5 (in which metabolism of cofactors and vitamins dominates), modules 7, 10, 14 (in which amino acid metabolism dominates) and module 15 (in which nucleotide metabolism and carbohydrate metabolism dominate); the metabolic difference reaction of carbohydrate was in module 15 and module 12 (in which carbohydrate metabolism dominates); the metabolic difference reaction of lipid existed in modules 11 and 13 (in which nucleotide metabolism dominates); the metabolic difference reaction of cofactors and vitamin centered in modules 3 and 14 (in which amino acid metabolism dominates); the metabolic difference reaction of the nucleotide was in modules 13 and 15 (as shown in Fig. 4). 5-HT is a neurotransmitter in the nervous system of crustaceans.44,45 Its function is to help the X organ-sinus gland complex (XO-SG) in the eyestalk of crustaceans to release some neurohormones, such as high blood sugar hormone (CHH),46,47 molt inhibiting hormone (MIH).48 The differential expression results show that the function of 5-HT in eyestalks is accomplished by various metabolic subsystems. The differences between the differentially expressed reactions and the dominated reactions in a module indicate that the injection of 5-HT may influence the dominated metabolisms in the module mainly through the differentially expressed reactions and thereby influence the function of eyestalks.
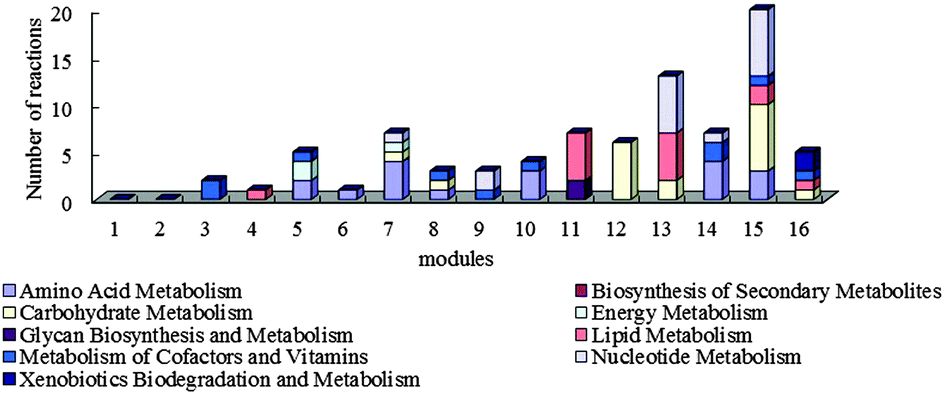 | ||
| Fig. 4 Functional distribution of differentially expressed reactions in the modules of the eyestalk network. | ||
Differentially expressed genes found after the injection of glucose were the same as those after the injection of 5-HT. It is because that the eyestalk secretes neuropeptide hormone whose chemical nature is protein which was composed of amino acids. Precursors synthesized into amino acid are in the pathways of carbohydrate metabolism. Nucleotide metabolism and amino acid metabolism are closely linked because they are all related to nitrogen. Lots of unigenes have different change trends after the injection of glucose and 5-HT. The main metabolic processes influenced by these unigenes are shown in Table 6. That may be because the injection of 5-HT motivates the release of CHH which improves the increase of blood sugar, whereas the injection of glucose may inspire the regulation for decreasing the blood sugar. 5-HT/glucose exerts an effect on the metabolism of several substances in eyestalks, such as ammonia acid, proline, amino sugars and uracil, thus affecting the metabolic process of E. sinensis.
| Pathway | Process | General trend | ||
|---|---|---|---|---|
| 5-HT | Glucose | |||
| Amino acid metabolism | Arginine and proline metabolism | L-Arginine → L-arginine phosphate; L-proline → hydroxyproline | Down | Up |
| Glycine, serine and threonine metabolism | Sarcosine ↔ glycine ↔ L-threonine; serine ↔ L-cysteine | Down | Up | |
| Cysteine and methionine metabolism | AdoMet → S-adenosylhomocysteine → homocysteine | Down | Up | |
| Carbohydrate metabolism | Pentose phosphate pathway | Beta-D-fructose 6-phosphate → alpha-D-glucose 6-phosphate | Down | Up |
| Amino sugar, nucleotide sugar metabolism | GlcNAc → GlcNAc-6P → GlcNAc-1P → UDP-GlcNAc → chitin | Down | Up | |
| Nucleotide metabolism | Uracil metabolism | UDP ↔ UMP ↔ Uracil ↔ pseudouridine 5′-phosphate | Down | Up |
| Adenine metabolism | GMP → IMP ← AMP ↔ ADP ↕ hypoxanthine | Down | Up | |
| Lipid metabolism | Sphingolipid metabolism | Dihydroceramide → ceramide ↔ sphingomyelin | Down | Up |
| Glycerophospholipid metabolism | Ethanolamine → ethanolamine phosphate → CDP-ethanolamine | Down | Up | |
Conclusions
A genome-scale metabolic network model has been widely used in the analysis of the metabolic function and processes for many kinds of organisms. In this work, we reconstructed a genome-scale metabolic network for E. sinensis eyestalks on the basis of transcriptome sequencing. The biological feature of the model was evaluated by the topology analysis. The analysis of the biggest WCC shows that amino acid metabolism and carbohydrate metabolism constitute the largest proportions in the eyestalk which indicates the function of eyestalks in peptide hormone secretion and energy metabolism. 5-HT and glucose injections lead to the changes in amino acid metabolism and carbohydrate metabolism, which illustrates that 5-HT and glucose may influence the neuropeptide hormone secretion of the eyestalk, and further certified that the eyestalk is the control center of the endocrine system in E. sinensis.Acknowledgements
This work was supported by National High-Tech Research and Development Program of China (863 programs, 2012AA10A401), Grants of the Major State Basic Research Development Program of China (973 programs, 2012CB114405), National Key Technology R&D Program (2011BAD13B07 and 2011BAD13B04), National Natural Science Foundation of China (21106095, 61100124), Natural Science Foundation of Tianjin (15JCYBJC30700), Foundation of Introducing Talents to Tianjin Normal University (5KQM110003), Academic innovation promotion project of Tianjin Normal University for young teachers (52XC1403), and “131” Innovative Talents cultivation of Tianjin.Notes and references
- A. Q. Yu, X. K. Jin, X. N. Guo, L. Shuang, M. H. Wu, W. W. Li and Q. Wang, Fish Shellfish Immunol., 2013, 35, 1282–1292 CrossRef CAS PubMed.
- Y. Wang, Y. Zhang, Y. Sun, Y. Liu, X. Geng and J. Sun, J. Fish. China, 2013, 37, 987–993 CrossRef CAS.
- X. Li, Z. Cui, Y. Liu, C. Song and G. Shi, PLoS One, 2013, 8, 374 Search PubMed.
- Y. Sun, Y. Zhang, Y. Liu, S. Xue, X. Geng, T. Hao and J. Sun, PLoS One, 2014, 9, e95827 Search PubMed.
- H. Tong, Z. Zheng, B. Wang, Y. Zhang, Y. Liu, X. Geng and J. Sun, BMC Syst. Biol., 2014, 8, 417–422 Search PubMed.
- G. Zhengbing, Y. Shui, X. Zhou, X. Zenghong and Z. Zhaoyang, Jiang Su Agric. Sci., 2012, 40, 28–30 Search PubMed.
- P. S. Sun, Mol. Mar. Biol. Biotechnol., 1995, 4, 262–268 CAS.
- E. Wang, N. Zaman, S. Mcgee, J. S. Milanese, A. Masoudi-Nejad and M. O’Connor-Mccourt, Semin. Cancer Biol., 2015, 30, 4–12 CrossRef CAS PubMed.
- J. D. Orth, T. M. Conrad, J. Na, J. A. Lerman, H. Nam, A. M. Feist and B. Ø. Palsson, Mol. Syst. Biol., 2011, 7, 535 CrossRef PubMed.
- R. A. Notebaart, F. H. V. Enckevort, C. Francke, R. J. Siezen and B. Teusink, BMC Bioinf., 2006, 7, 296 CrossRef PubMed.
- C. Francke, R. J. Siezen and B. Teusink, Trends Microbiol., 2005, 13, 550–558 CrossRef CAS PubMed.
- I. Thiele and B. Ø. Palsson, Nat. Protoc., 2010, 5, 93–121 CrossRef CAS PubMed.
- J. S. Edwards and B. O. Palsson, J. Biol. Chem., 1999, 274, 17410–17416 CrossRef CAS PubMed.
- T. Hao, B. Han, H. Ma, J. Fu, H. Wang, Z. Wang, B. Tang, T. Chen and X. Zhao, Mol. BioSyst., 2013, 9, 2034–2044 RSC.
- R. Saha, P. F. Suthers and C. D. Maranas, PLoS One, 2011, 6, e21784 CAS.
- S. Mintz-Oron, S. Meir, S. Malitsky, E. Ruppin, A. Aharoni and T. Shlomi, Proc. Natl. Acad. Sci. U. S. A., 2012, 109, 339–344 CrossRef CAS PubMed.
- M. Sigurdsson, N. Jamshidi, E. Steingrimsson, I. Thiele and B. Palsson, BMC Syst. Biol., 2010, 4, 140 CrossRef PubMed.
- H. Ma, A. Sorokin, A. Mazein, A. Selkov, E. Selkov, O. Demin and I. Goryanin, Mol. Syst. Biol., 2007, 3, 135 CrossRef PubMed.
- N. Duarte, S. Becker, N. Jamshidi, I. Thiele, M. Mo, T. Vo, R. Srivas and B. Palsson, Proc. Natl. Acad. Sci. U. S. A., 2007, 104, 1777–1782 CrossRef CAS PubMed.
- E. O’Brien, J. Monk and B. Palsson, Cell, 2015, 161, 971–987 CrossRef PubMed.
- T. Hao, H.-W. Ma, X.-M. Zhao and I. Goryanin, BMC Bioinf., 2010, 11, 393 CrossRef PubMed.
- T. Hao, H.-W. Ma, X.-M. Zhao and I. Goryanin, Mol. BioSyst., 2012, 8, 663–670 RSC.
- A. Liu, Z. Wang, W. Nie and Y. Su, Inf. Sci., 2015, 320, 429–442 CrossRef.
- A. A. Liu, K. Li and T. Kanade, IEEE Trans. Med. Imaging, 2012, 31, 359–369 CrossRef PubMed.
- A. A. Liu, Y. T. Su, P. P. Jia, Z. Gao, T. Hao and Z. X. Yang, IEEE Trans. Cybern., 2015, 45, 1194–1208 CrossRef PubMed.
- A. A. Liu, Y. T. Su, W. Z. Nie and Z. X. Yang, PLoS One, 2015, 10, e0130884 Search PubMed.
- S. A. Becker, A. M. Feist, M. L. Mo, G. Hannum, B. Ø. Palsson and M. J. Herrgard, Nat. Protoc., 2007, 2, 727–738 CrossRef CAS PubMed.
- J. M. Lee, E. P. Gianchandani and J. A. Papin, Briefings Bioinf., 2006, 7, 140–150 CrossRef CAS PubMed.
- J. M. Park, T. Y. Kim and S. Y. Lee, Biotechnol. Adv., 2009, 27, 979–988 CrossRef PubMed.
- D. Koschützki, B. H. Junker, J. Schwender and F. Schreiber, J. Theor. Biol., 2010, 265, 261–269 CrossRef PubMed.
- H. W. Ma, X. M. Zhao, Y. J. Yuan and A. P. Zeng, Bioinformatics, 2004, 20, 1870–1876 CrossRef CAS PubMed.
- T. Hao, B. Wang, A. Yu, A. Liu and J. Sun, MNetDec: A Flexible Algorithm for Metabolic Network Decomposition, 2015 Search PubMed.
- H. Ma and A.-P. Zeng, Bioinformatics, 2003, 19, 270–277 CrossRef CAS PubMed.
- R. L. Chang, L. Ghamsari, A. Manichaikul, E. F. Hom, S. Balaji, W. Fu, Y. Shen, T. Hao, B. Ø. Palsson and K. Salehi-Ashtiani, Mol. Syst. Biol., 2011, 7, 518 CrossRef PubMed.
- J. M. Dreyfuss, J. D. Zucker, H. M. Hood, L. R. Ocasio, M. S. Sachs and J. E. Galagan, PLoS Comput. Biol., 2013, 9, e1003126 CAS.
- V. Batagelj and A. Mrvar, Lecture Notes in Computer Science, 2002, vol. 2265, pp. 77–103 Search PubMed.
- J. Zhao, H. Yu, J.-H. Luo, Z.-W. Cao and Y.-X. Li, BMC Bioinf., 2006, 7, 386 CrossRef PubMed.
- W. Zaizhao and X. Jianhai, J. Fish. China, 2001, 175–180 Search PubMed.
- J. Dongcai, J. Han, J. Xiaojun and Y. Haiming, China Feed, 2014, 29, 31–36 Search PubMed.
- K. r. C. Williams, N. E. Renthal, R. D. Gerard and C. R. Mendelson, Mol. Endocrinol., 2012, 26, 1857–1867 CrossRef CAS PubMed.
- J. KAN, L. LI and J.-y. XU, Chin. J. Biochem. Pharm., 2009, 4, 020 Search PubMed.
- M. Csete and J. Doyle, Trends Biotechnol., 2004, 22, 446–450 CrossRef CAS PubMed.
- L. J. Sweetlove, K. F. Beard, A. Nunes-Nesi, A. R. Fernie and R. G. Ratcliffe, Trends Plant Sci., 2010, 15, 462–470 CrossRef CAS PubMed.
- R. R. Eitenmiller, J. H. Orr, W. W. Wallis, Chemistry and biochemistry of marine food products, 1982, pp. 39–50 Search PubMed.
- L. Laxmyr, Comp. Biochem. Physiol., C: Comp. Pharmacol., 1984, 77, 139–143 CrossRef CAS.
- R. Keller, Cell. Mol. Life Sci., 1992, 48, 439–448 CrossRef CAS PubMed.
- W. Lüschen, A. Willig and P. P. Jaros, Comp. Biochem. Physiol., C: Comp. Pharmacol., 1993, 105, 291–296 CrossRef.
- M. P. Mattson and E. Spaziani, Biol. Bull., 1985, 169, 246–255 CrossRef CAS.
Footnote |
| † Electronic supplementary information (ESI) available. See DOI: 10.1039/c5mb00571j |
| This journal is © The Royal Society of Chemistry 2016 |