Enhancement of carotenoid bioaccessibility from carrots using excipient emulsions: influence of particle size of digestible lipid droplets
Ruojie
Zhang
a,
Zipei
Zhang
a,
Liqiang
Zou
a,
Hang
Xiao
a,
Guodong
Zhang
a,
Eric Andrew
Decker
ab and
David Julian
McClements
*ab
aDepartment of Food Science, University of Massachusetts Amherst, Amherst, MA 01003, USA. E-mail: mcclements@foodsci.umass.edu; Tel: +1 413 545 1019
bDepartment of Biochemistry, Faculty of Science, King Abdulaziz University, P. O. Box 80203, Jeddah 21589, Saudi Arabia
First published on 10th November 2015
Abstract
The influence of initial lipid droplet size on the ability of excipient emulsions to increase carotenoid bioaccessibility from carrots was investigated using a simulated gastrointestinal tract (GIT). Corn oil-in-water excipient emulsions were fabricated with different surface-weighted mean droplet diameters: d32 = 0.17 μm (fine), 0.46 μm (medium), and, 10 μm (large). Bulk oil containing a similar quantity of lipids as the emulsions was used as a control. The excipient emulsions and control were mixed with pureed carrots, and then passed through a simulated GIT (mouth, stomach, and small intestine), and changes in particle size, charge, microstructure, lipid digestion, and carotenoid bioaccessibility were measured. Carotenoid bioaccessibility significantly increased with decreasing lipid droplet size in the excipient emulsions, which was attributed to the rapid formation of mixed micelles that could solubilize the carotenoids in the intestinal fluids. These results have important implications for designing excipient foods, such as dressings, dips, creams, and sauces, to increase the bioavailability of health-promoting nutraceuticals in foods.
1. Introduction
Carotenoids are a class of highly hydrophobic phytochemicals characterized by a tetraterpenoid structure consisting of an extended non-polar chain that has many conjugated double bonds.1–3 Carotenoids have been reported to have a number of potential health benefits when taken orally including, providing pro-vitamin A activity,4,5 reducing the risk of certain cancers,6–8 inhibiting or treating cardiovascular diseases,9–11 and controlling obesity.12 Many commonly consumed fruits and vegetables are good natural sources of carotenoids, including carrots, broccoli, kale, tomatoes, peppers, and mangoes.13 However, the oral bioavailability of carotenoids is relatively low and variable from many fruits and vegetables because of their low bioaccessibility.14–17 Carotenoid bioaccessibility is often relatively poor because they are not easily liberated from their original location within plant tissues (e.g., chromoplasts), and because of their very low solubility in aqueous gastrointestinal fluids.17–19Recent studies suggest that carotenoid bioavailability can be improved by designing the composition and structure of the food matrix they are ingested with ref. 20–24 This research has led to the concept of excipient foods specifically designed to increase the bioavailability of nutraceuticals, such as carotenoids.25 Excipient foods may have no bioactivity themselves, but they boost the bioactivity of nutraceuticals co-ingested with them by modulating their bioaccessibility, absorption, or transformation within the gastrointestinal tract (GIT). In the case of lipophilic nutraceuticals, this can be achieved by including digestible lipids within an excipient food that can act as a non-polar solvent that facilitates their release from the plant tissues, and that can form mixed micelles in the small intestine that solubilize and transport them.17,20,23,24,26,27 Oil-in-water emulsions are particularly suitable substrates for creating excipient foods for a number of reasons.25 Firstly, foods based on this type of emulsion are already widely used as accompaniments for many fruits and vegetables, e.g., creams, sauces, dressings, soups, desserts, and beverages. Secondly, lipophilic, hydrophilic, and amphiphilic components can be included as functional ingredients into a single food product. These functional ingredients may be designed to increase the bioactivity of nutraceuticals in fruits and vegetables (“excipient ingredients”), or they may have other roles, such as colors, flavors, stabilizers, texture modifiers, or preservatives. Third, the composition, size, and interfacial characteristics of the lipid droplets can easily be manipulated, which gives great scope for creating excipient emulsions with different physicochemical, sensory, and biological properties.
Previously, we have shown that excipient emulsions can be used to increase the bioaccessibility of curcumin (another hydrophobic nutraceutical) that was initially in a powdered form.28–30 As part of these studies, we showed that the bioaccessibility and transformation of curcumin depended on the lipid droplet size.29 It was postulated that curcumin bioaccessibility increased with decreasing droplet size because faster lipid digestion led to the rapid formation of mixed micelles that could solubilize the curcumin released. Conversely, the curcumin degradation rate increased with decreasing droplet size because the curcumin molecules were closer to the aqueous phase. We have also shown that excipient emulsions can increase the bioaccessibility of carotenoids from yellow peppers31 and from carrots.32 In these previous studies, we examined the influence of the composition of the excipient emulsions on the bioaccessibility of the carotenoids from peppers or carrots, i.e., lipid type and concentration. In the current study, we investigated the influence of excipient emulsion microstructure (droplet size) on carotenoid bioaccessibility. We hypothesized that excipient emulsions containing smaller droplets would be digested more rapidly and completely in the small intestine, and therefore would form a mixed micelle phase that was more effective at solubilizing the carotenoids released from the carrots. Indeed, previous studies using carotenoids encapsulated within lipid droplets in emulsion-based delivery systems have shown an increase in bioaccessibility with decreasing droplet size.33
In the current study, raw carrots were pureed and then mixed with excipient emulsions with different particle sizes. The resulting carrot–emulsion mixtures were then passed through a simulated gastrointestinal tract (GIT) that included mouth, stomach, and small intestinal phases, which was based on recent standardized methods.34,35 Changes in the microstructure and physicochemical properties of the excipient emulsions were measured after exposure to the various stages of the model GIT to provide a more mechanistic understanding of the influence of droplet characteristics on their potential gastrointestinal fate. In addition, the influence of initial droplet size on the kinetics of lipid digestion and on the bioaccessibility of the carotenoids was measured. The knowledge gained from this study should be useful for designing functional foods that can improve the potential health benefits of nutraceuticals in natural sources, such as fruits and vegetables. For example, emulsion-based excipient sauces, dressings, or dips that could be consumed with raw or cooked vegetables could be designed to boost nutraceutical bioavailability.
2. Materials and methods
2.1. Materials
Raw carrots were purchased from a local supermarket. Powdered whey protein isolate (WPI) was kindly donated by Davisco Foods International Inc. (Le Sueur, MN). The manufacturer stated that the powder contained 97.6% protein on a dry basis. Corn oil was purchased from a commercial food supplier (Mazola, ACH Food Companies, Memphis, TN). The manufacturer reported that the saturated, monounsaturated, and polyunsaturated fat content of this product were about 14, 29, and 57%, respectively. Mucin from porcine stomach, pepsin from porcine gastric mucosa (250 units per mg), porcine lipase (100–400 units per mg), and porcine bile extract were purchased from Sigma-Aldrich (Sigma Chemical Co., St Louis, MO). HPLC standards of β-carotene were purchased from Sigma-Aldrich (Sigma Chemical Co., St Louis, MO) and of α-carotene were purchased from Sinostandards Bio-Tech Co., Ltd (Chendu, China). HPLC grade methanol and MTBE were purchased from Fisher Scientific (Pittsburgh, PA). All other chemicals were purchased from either Sigma-Aldrich (Sigma Chemical Co., St Louis, MO) or Fisher Scientific (Pittsburgh, PA). All solvents and reagents were of analytical grade. Double distilled water from a water purification system (Nanopure Infinity, Barnstaeas International, Dubuque, IA) was used for preparation of all aqueous solutions.2.2. Methods
![[thin space (1/6-em)]](https://www.rsc.org/images/entities/char_2009.gif) :
:![[thin space (1/6-em)]](https://www.rsc.org/images/entities/char_2009.gif) 10 emulsifier-to-oil mass ratio (pH 7.0, 5 mM phosphate buffer). Excipient emulsions with different particle sizes (small, medium, or large) were prepared using different homogenization procedures. Emulsions containing relatively large-sized lipid droplets were formed by blending the oil and aqueous phases using a high-speed blender (M133/1281-0, Biospec Products, Inc., ESGC, Switzerland). Emulsions containing medium-sized lipid droplets were formed by passing blended oil and water through a microfluidizer at 7000 psi for 3 passes (M110Y, Microfluidics, Newton, MA). Emulsions containing small-sized lipid droplets were formed by passing blended oil and water through the microfluidizer at 11
10 emulsifier-to-oil mass ratio (pH 7.0, 5 mM phosphate buffer). Excipient emulsions with different particle sizes (small, medium, or large) were prepared using different homogenization procedures. Emulsions containing relatively large-sized lipid droplets were formed by blending the oil and aqueous phases using a high-speed blender (M133/1281-0, Biospec Products, Inc., ESGC, Switzerland). Emulsions containing medium-sized lipid droplets were formed by passing blended oil and water through a microfluidizer at 7000 psi for 3 passes (M110Y, Microfluidics, Newton, MA). Emulsions containing small-sized lipid droplets were formed by passing blended oil and water through the microfluidizer at 11![[thin space (1/6-em)]](https://www.rsc.org/images/entities/char_2009.gif) 000 psi for 5 passes. Prior to use, the emulsions were diluted to 4 wt% corn oil using buffer solution. For the sake of comparison, bulk oil at the same total fat level as the excipient emulsions was used as a control.
000 psi for 5 passes. Prior to use, the emulsions were diluted to 4 wt% corn oil using buffer solution. For the sake of comparison, bulk oil at the same total fat level as the excipient emulsions was used as a control.
Fresh carrots were cut into cylindrical disks (approximately 10 mm high and 15 mm wide), and then homogenized with an equal mass of buffer solution (pH 7.0). The resulting carrot puree was mixed with an equal mass of excipient emulsion or buffer solution (control). The carrot/emulsion or carrot/buffer mixtures were then passed through a simulated gastrointestinal tract (GIT) that mimicked mouth, stomach, and small intestine conditions.32
Initial system. An aliquot (20 mL) of carrot/emulsion or carrot/buffer mixture was placed into a glass beaker in an incubated shaker (Innova Incubator Shaker, Model 4080, New Brunswick Scientific, New Jersey, USA).
Mouth phase. The initial system (20 mL) was mixed with 20 mL of simulated saliva fluid (SSF) containing 0.03 g per mL mucin. After adjustment to pH 6.8, the mixture was placed in a shaking incubator for 10 min to mimic agitation in the mouth.
Stomach phase. 20 mL of the “bolus” sample resulting from the mouth phase was mixed with 20 mL of simulated gastric fluid (SGF) containing 0.0032 g per mL pepsin, and then the pH was adjusted to 2.5. This mixture was incubated in the shaking incubator for 2 h to mimic stomach conditions.
Small intestine phase. 30 g of “chyme” sample from the stomach phase was poured into a 100 mL glass beaker, and then the mixture was adjusted to pH 7.00. 1.5 mL of simulated intestinal fluid was added to the reaction vessel, followed by 3.5 mL of bile salt solution with constant stirring. The pH of the reaction system was adjusted back to 7.00. 2.5 mL of lipase solution was then added to the sample and an automatic titration unit (Metrohm, USA Inc.) was used to monitor the pH and maintain it at pH 7.0 by titrating 0.25 M NaOH solution into the reaction vessel for 2 h. The amount of free fatty acids released was calculated from the titration curves as described previously.37
It should be noted that the simulated GIT model used in this study cannot mimic the complex and dynamic physicochemical and physiological processes occurring within the human gastrointestinal tract.34,35 Nevertheless, this kind of static in vitro model is useful for providing valuable insights into the physicochemical mechanisms involved in determining nutraceutical bioaccessibility, and for rapidly screening samples with different compositions or structures to identify suitable candidates for more detailed studies using animal or human feeding studies.
The particle size distribution of the emulsions was determined using static light scattering (Mastersizer 2000, Malvern Instruments Ltd, Malvern, Worcestershire, UK). Samples were diluted in aqueous solutions and stirred in the dispersion unit with a speed of 1200 rpm to ensure homogeneity. Phosphate buffer (5 mM, pH 7.0) was used to dilute initial, mouth, and small intestine samples, while distilled water (adjusted to pH 2.5) was used to dilute stomach samples. Average particle sizes are reported as the surface-weighted mean diameter (d32).
The ζ-potential of the particles in the samples was measured using an electrophoresis instrument (Zetasizer Nano ZS series, Malvern Instruments Ltd Worcestershire, UK). Prior to analysis, initial, mouth, and small intestine samples were diluted with 5 mM phosphate buffer (pH 7.0), whereas stomach samples were diluted with pH 2.5-adjusted distilled water.
![[thin space (1/6-em)]](https://www.rsc.org/images/entities/char_2009.gif) 000 rpm (41
000 rpm (41![[thin space (1/6-em)]](https://www.rsc.org/images/entities/char_2009.gif) 657g), 4 °C for 50 min, which resulted in samples that contained sediment at the bottom and clear supernatant at the top. The supernatant was collected and assumed to be the “micelle” fraction, in which the carotenoids were solubilized. The bioaccessibility was calculated from the concentrations of total carotenoids determined in the micelle fraction and supernatant using the procedure described previously. The bioaccessibility of carotenoids was calculated using the following equation:
657g), 4 °C for 50 min, which resulted in samples that contained sediment at the bottom and clear supernatant at the top. The supernatant was collected and assumed to be the “micelle” fraction, in which the carotenoids were solubilized. The bioaccessibility was calculated from the concentrations of total carotenoids determined in the micelle fraction and supernatant using the procedure described previously. The bioaccessibility of carotenoids was calculated using the following equation:where, Cmicelle and CDigesta are the concentrations of carotenoids in the mixed micelle phase and in the overall digesta after the simulated intestinal digestion, respectively.
![[thin space (1/6-em)]](https://www.rsc.org/images/entities/char_2009.gif) :
:![[thin space (1/6-em)]](https://www.rsc.org/images/entities/char_2009.gif) acetone (1
acetone (1![[thin space (1/6-em)]](https://www.rsc.org/images/entities/char_2009.gif) :
:![[thin space (1/6-em)]](https://www.rsc.org/images/entities/char_2009.gif) 1, v/v) mixture, vigorously shaken, and then centrifuged for 2 min at 4000 rpm (1788.8g). The supernatant layer was collected in a second tube. The extraction process was repeated three times. The combined organic fractions were mixed with saturated sodium chloride solution and the mixture was shaken vigorously. After the supernatant hexane layer was collected, the lower phase was extracted again with hexane. Combined supernatant hexane phases were then diluted with hexane to an appreciate concentration and filtered through 0.45 μm filter (VWR International, Philadephia, PA, USA) to be analyzed by HPLC. All procedures were carried out on ice and with low light exposure.
1, v/v) mixture, vigorously shaken, and then centrifuged for 2 min at 4000 rpm (1788.8g). The supernatant layer was collected in a second tube. The extraction process was repeated three times. The combined organic fractions were mixed with saturated sodium chloride solution and the mixture was shaken vigorously. After the supernatant hexane layer was collected, the lower phase was extracted again with hexane. Combined supernatant hexane phases were then diluted with hexane to an appreciate concentration and filtered through 0.45 μm filter (VWR International, Philadephia, PA, USA) to be analyzed by HPLC. All procedures were carried out on ice and with low light exposure.
The HPLC system (Agilent 1100 series, Agilent Technologies, Santa Clara, CA, USA) consisted of a binary solvent delivery system, an on-line degasser, an auto-sampler, a column temperature controller, a diode array detector (DAD), and a variable wavelength detector (VWD). System control and data analysis were processed using instrument software (Agilent ChemStation). A C-30 reversed phase column (250 mm × 4.6 mm id, 5 μm, YMC Carotenoid, YMC Inc., Wilmington, NC) was used as the stationary phase. The injection volume was 20 μL and the flow rate was 1 mL min−1. The detection wavelength was set at 450 nm. The mobile phase was composed of (A) methanol/MTBE/1M ammomium acetate (95![[thin space (1/6-em)]](https://www.rsc.org/images/entities/char_2009.gif) :
:![[thin space (1/6-em)]](https://www.rsc.org/images/entities/char_2009.gif) 3
3![[thin space (1/6-em)]](https://www.rsc.org/images/entities/char_2009.gif) :
:![[thin space (1/6-em)]](https://www.rsc.org/images/entities/char_2009.gif) 2 v/v/v) and (B) methanol/MTBE/1M ammonium acetate (25
2 v/v/v) and (B) methanol/MTBE/1M ammonium acetate (25![[thin space (1/6-em)]](https://www.rsc.org/images/entities/char_2009.gif) :
:![[thin space (1/6-em)]](https://www.rsc.org/images/entities/char_2009.gif) 75
75![[thin space (1/6-em)]](https://www.rsc.org/images/entities/char_2009.gif) :
:![[thin space (1/6-em)]](https://www.rsc.org/images/entities/char_2009.gif) 2 v/v/v). A linear gradient program was performed as follows: initial condition of mobile phase A
2 v/v/v). A linear gradient program was performed as follows: initial condition of mobile phase A![[thin space (1/6-em)]](https://www.rsc.org/images/entities/char_2009.gif) :
:![[thin space (1/6-em)]](https://www.rsc.org/images/entities/char_2009.gif) B was 85
B was 85![[thin space (1/6-em)]](https://www.rsc.org/images/entities/char_2009.gif) :
:![[thin space (1/6-em)]](https://www.rsc.org/images/entities/char_2009.gif) 15; followed 70
15; followed 70![[thin space (1/6-em)]](https://www.rsc.org/images/entities/char_2009.gif) :
:![[thin space (1/6-em)]](https://www.rsc.org/images/entities/char_2009.gif) 30 for 10 min, 52
30 for 10 min, 52![[thin space (1/6-em)]](https://www.rsc.org/images/entities/char_2009.gif) :
:![[thin space (1/6-em)]](https://www.rsc.org/images/entities/char_2009.gif) 48 for 12 min, 52
48 for 12 min, 52![[thin space (1/6-em)]](https://www.rsc.org/images/entities/char_2009.gif) :
:![[thin space (1/6-em)]](https://www.rsc.org/images/entities/char_2009.gif) 48 for 18 min, 35
48 for 18 min, 35![[thin space (1/6-em)]](https://www.rsc.org/images/entities/char_2009.gif) :
:![[thin space (1/6-em)]](https://www.rsc.org/images/entities/char_2009.gif) 65 for 26 min and then back to the initial condition for 30 min to allow re-equilibration. The content of α-carotene and β-carotene in the samples were calculated from carotenoid standard curves.
65 for 26 min and then back to the initial condition for 30 min to allow re-equilibration. The content of α-carotene and β-carotene in the samples were calculated from carotenoid standard curves.
2.3. Statistical analysis
All experiments were performed on two or three freshly prepared samples. The results are reported as averages and standard deviations and the differences among the treatments were calculated using an analysis of variance (ANOVA) and a post hoc Duncan test with a confidence level of 95%. The analyses were made using SPSS software (IBM Corporation, Armonk, NY, USA).3. Results and discussion
3.1. Initial characteristics of the excipient emulsions
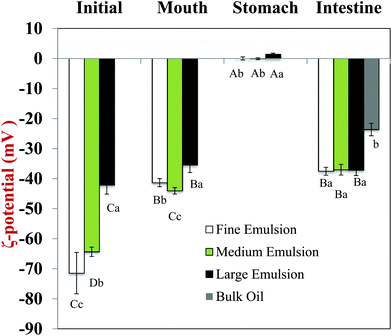
Initially, excipient emulsions with three different mean particle diameters were prepared: fine emulsions (d32 ≈ 0.17 μm); medium emulsions (d32 ≈ 0.64 μm); and large emulsions (d32 ≈ 10 μm). The particle size distributions were monomodal for all three emulsions (data not shown). The electrical potential (ζ-potential) of all the emulsions was highly negative, but its magnitude deceased with increasing mean droplet diameter, being −71.5, −64.4 and −42.2 mV for fine, medium, and large emulsions, respectively. The relatively high negative ζ-potential on the droplets in the excipient emulsions is due to the presence of whey proteins at the lipid droplet surfaces, which have a strong negative charge at neutral pH because this is appreciably above their isoelectric point (pI ≈ 5). The dependence of the droplet charge on particle size may have occurred for a number of reasons. First, the amount of non-adsorbed protein in the emulsions increases as the droplet size increases because of the concomitant reduction in droplet surface area. These non-adsorbed proteins increase the ionic strength of the aqueous phase,40 which will decrease the magnitude of the ζ-potential.41 Second, the number and structural organization of protein molecules at the droplet surfaces may have been different for different droplet sizes and homogenization methods, which may have altered their electrical properties.40 Third, there may have been some limitations in the mathematical model used to calculate the ζ-potential values from the electrophoretic measurements, since the model includes some simplifying assumptions about particle dimensions.423.2. Impact of GIT model on physicochemical properties and structure of excipient emulsions
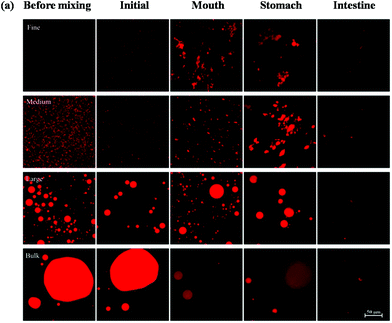
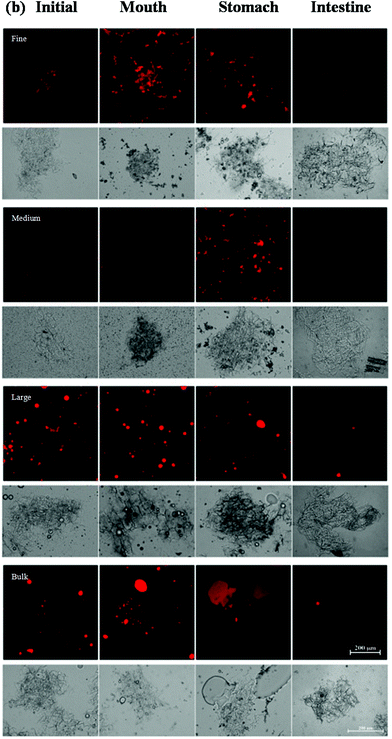
Changes in the particle size, charge, and microstructure of the samples were measured as the carrot/emulsion mixtures were passed through the simulated GIT. For the particle size, ζ-potential, and confocal microscopy measurements, the lipid droplets were separated from the carrot pieces prior to analysis by adding buffer solution to the carrot/emulsion mixture and then allowing the large plant tissue fragments to sediment to the bottom of the tubes (Fig. 1–3). This allowed us to characterize changes in the properties of the lipid droplets themselves, without having interference from the plant tissue fragments. However, optical and confocal microscopy measurements were also carried out on the entire carrot/emulsion mixtures so that we could identify changes in plant tissue structure and lipid droplet location throughout the simulated GIT (Fig. 4).The microstructures of the carrot/emulsion mixtures were examined using a combination of optical and confocal microscopy on the same samples (Fig. 4). The optical microscopy measurements highlight the location of fragments of plant tissue arising from the pureed carrots, whereas the confocal microscopy images highlight the location of fluorescently-stained lipid droplets. Interestingly, for the fine and medium emulsions, the lipid droplets appeared to be closely associated with the plant tissue, suggesting that the droplets were small enough to be internalized by the pores within the cellular structure of the pureed carrots. Conversely, for the large emulsions and bulk oil, the lipid droplets appeared to be mainly present within the aqueous phase surrounding the plant tissue. In this case, the lipid droplets were probably too large to enter into the small pores or fissures in the plant tissue. The small droplets may have been preferentially located within the plant tissues because they were pulled into the pores or fissures through capillary forces, or due to specific attractive interactions between the lipid droplets and the components of the cellular matrix (such as dietary fibers).
After mixing with pureed carrot, the magnitudes of the negative charges on the droplets in the excipient emulsions were fairly similar to those measured before mixing, i.e., there was a decrease in ζ-potential with increasing particle size (Fig. 5). As mentioned earlier, this may have been due to changes in interfacial or aqueous phase properties for emulsions with different droplet sizes.
A comparison of the optical and confocal fluorescence microscopy images of the carrot/emulsion mixtures after exposure to oral conditions suggests that more lipid droplets were internalized by the carrot tissue for the fine and medium emulsions than for the large emulsions or bulk oil (Fig. 4). Again, this may be because the smaller droplets can penetrate more easily into the pores in the plant tissues than the larger ones.
After exposure to the mouth stage, the magnitude of the negative charge on all emulsions decreased appreciably compared to the initial values (Fig. 5a). This decrease in negative charge can be attributed to electrostatic screening effects by ions in the simulated saliva solution41 and to the interaction of mucin molecules with the lipid droplet surfaces.46
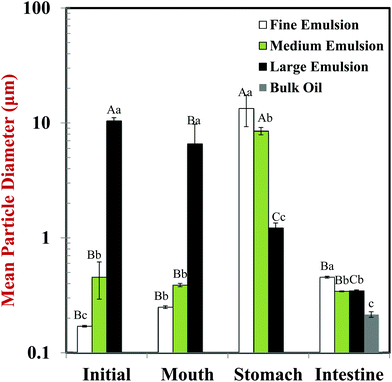
The reason for the increase in particle size after exposure to gastric conditions for the fine and medium emulsions can be attributed to a number of factors.47,48 The pH of the aqueous phase surrounding the protein-coated lipid droplets is highly acidic in the gastric environment, which will change the net charge on the adsorbed protein molecules to positive. As a result, anionic mucin molecules arising from the simulated saliva fluids may promote bridging flocculation of cationic protein-coated droplets in the stomach. This phenomenon accounts for the fact that the droplets were not highly positively charged in the gastric environment as would have been expected from the protein's isoelectric point (Fig. 5). In addition, the gastric fluids contain digestive enzymes (pepsin) that may hydrolyze the proteins adsorbed to the lipid droplet surfaces, thereby altering their ability to stabilize the droplets against aggregation. The carrot/emulsion mixtures containing relatively large lipid droplets behaved differently, which may have been because these droplets were more susceptible to shear-induced fragmentation and coalescence.49–53
The location of the lipid droplets relative to the plant tissues in the stomach phase was established by comparing confocal fluorescence and optical microscopy images on the same samples (Fig. 4). For the fine and medium emulsions, there appeared to be some lipid droplets within the carrot tissues, but also some large aggregates of lipid droplets outside the tissues. On the other hand, there appeared to be fairly large oil droplets outside of the carrot tissue for the large emulsion and bulk oil samples. Again, these results suggest that small lipid droplets can penetrate into the carrot tissue, but that larger particles cannot.
The ζ-potential of the particles in all of the emulsions was close to zero after they were exposed to simulated stomach conditions (Fig. 5). One might have expected that the charge on the protein-coated lipid droplets would be strongly negative under highly acidic conditions, because pH 2.5 is well below the isoelectric point of the proteins (pI ≈ 5). The most likely reason that the droplet charge was close to zero is that the adsorption of anionic mucin molecules onto the surfaces of the cationic protein-coated lipid droplets led to charge neutralization.36,47,48
The optical microscopy images indicated that the carrot tissue appeared to remain intact after the emulsion/carrot mixtures were exposed to the small intestine phase (Fig. 4), suggesting that they were not fully disintegrated by the mechanical, chemical or enzymatic treatments used in the simulated GIT. Nevertheless, the lipid droplets appeared to be fully digested after exposure to the intestine phase for the fine and medium emulsions, and almost fully digested for the large emulsions and bulk oil (Fig. 4). This result suggests that the digestive enzymes (lipases) were able to hydrolyze the triacylglycerol molecules even in the presence of carrot tissue.
The ζ-potential became highly negative in all of the samples after exposure to the simulated small intestinal phase (Fig. 5), which has been reported in previous studies using emulsion-based delivery systems.33,38 This negative charge can be attributed to the presence of various types of anionic colloidal particles present in the system after lipid digestion, such as bile salts, phospholipids, free fatty acids, and peptides. All of the samples initially containing excipient emulsions had similar negative charges after digestion, but the samples containing bulk oil had an appreciably lower negative charge. The difference between the samples may have due to the absence of whey protein in the bulk oil, or due to the formation of fewer lipid digestion products for the bulk oil e.g., anionic free fatty acids.
3.3. Influence of particle size on digestion properties of excipient emulsion
The impact of the initial lipid droplet dimensions on the rate and extent of lipid digestion was monitored using an automatic titration method. The volume of alkaline solution (250 mM NaOH) titrated into the samples to maintain a constant pH (7.0) was measured throughout the small intestine phase, and the amount of free fatty acids (FFAs) released over time was calculated from this data (Fig. 6). The FFA release profiles depended strongly on the initial dimensions of the lipid droplets in the carrot samples.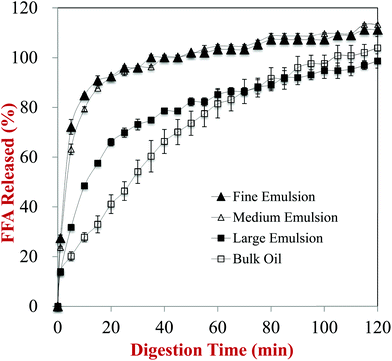 | ||
| Fig. 6 Amount of fatty acids released from carrot/emulsion mixtures with different lipid particle size as measured using a pH-stat method. | ||
In general, there was a fairly rapid increase in FFAs during the first few minutes of digestion, followed by a more gradual increase at longer incubation times. Nevertheless, the initial rate of lipid digestion decreased in the following trend: fine emulsion > medium emulsion > large emulsion > bulk oil (Fig. 6). This effect can be attributed to changes in the surface area of lipid exposed to the digestive enzymes, which is inversely proportional to the mean droplet diameter (d32).29,33 This effect is described by the following equation, originally derived by Li and McClements54 and then corrected by Gaucel et al.,55 which describes the relationship between the fraction of free fatty acids released (Φ) during lipid digestion and incubation time:
It should be stressed that the most appropriate lipid droplet dimensions to consider are those of the samples when they are first exposed to lipase, not the initial droplet dimensions. This is because changes in lipid droplet dimensions due to fragmentation or aggregation within the GIT will alter the surface area of the lipid phase exposed to the digestive enzymes. One might therefore expect that the most appropriate particle size to use to interpret the pH stat results would be the one measured after the samples were exposed to the stomach phase. Nevertheless, we observed that the particle size measured after exposure to stomach conditions actually decreased in the following order: fine emulsion > medium emulsion > large emulsion (Fig. 1). The reason for this apparent discrepancy can be attributed to the fact that the droplets in the fine and medium emulsions were highly flocculated after exposure to acidic gastric conditions, but that these flocs were disrupted when they were exposed to neutral intestinal conditions. Presumably, the change in the ζ-potential on the protein-coated lipid droplets from positive to negative when the pH was raised led to desorption of the anionic mucin molecules, thereby disrupting the tendency for bridging flocculation to occur. As a result, relatively small lipid droplets were released in the small intestine that had a high specific surface area, and therefore led to rapid lipid digestion (Fig. 6).
3.4. Carotenoid bioaccessibility
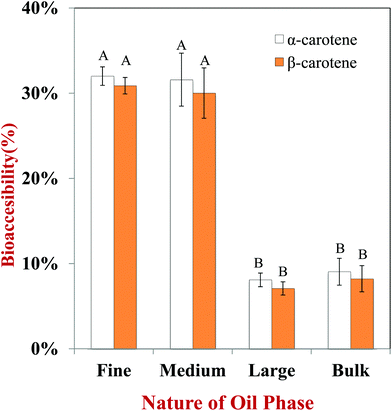
In this section, we investigated the impact of initial droplet dimensions in the excipient emulsions on carotenoid bioaccessibility from carrots. The bioaccessibilities of α-carotene and β-carotene were measured because they are the major carotenoids within carrots. Overall, the bioaccessibility of the α-carotenoids was fairly similar to that of the β-carotenoids, which suggests that the slight differences in molecular structure of these two carotenoids does not play a major role in determining their bioaccessibility.The bioaccessibility of the carotenoids was significantly higher for emulsions initially containing small droplets (fine and medium emulsions) than those containing large droplets (large emulsion and bulk oil) (Fig. 7). For example, the bioaccessibility of α-carotene was 32.0%, 31.6%, 6.5% and 7.1% for carrot puree containing fine emulsions, medium emulsions, large emulsions, and bulk oil, respectively. Surprisingly, there was not a large difference in bioaccessibility for the large emulsions and bulk oil. Initially, we believed that the bioaccessibility would have been higher for the emulsion than the bulk oil. This effect may have occurred because the bulk oil was partly homogenized as it passed through the simulated GIT, and so the droplet size was not too different from the large emulsion (Fig. 3). In addition, the digestion of the large emulsion may have occurred relatively slowly, which meant that any carotenoid molecules released from the carrot tissue precipitated with each other before they had a chance of being incorporated into mixed micelles. Overall, these results suggested that the initial size of the lipid droplets plays an important role in determining carotenoid bioaccessibility, with small droplets being more effective at promoting bioaccessibility than large ones. This result has important consequences for designing excipient foods to increase carotenoid bioavailability from fruits and vegetables. Emulsion-based products such as dressings, dips, creams, or sauces containing smaller droplets should be more effective at enhancing the potential health promoting effects of carotenoid-rich produce.
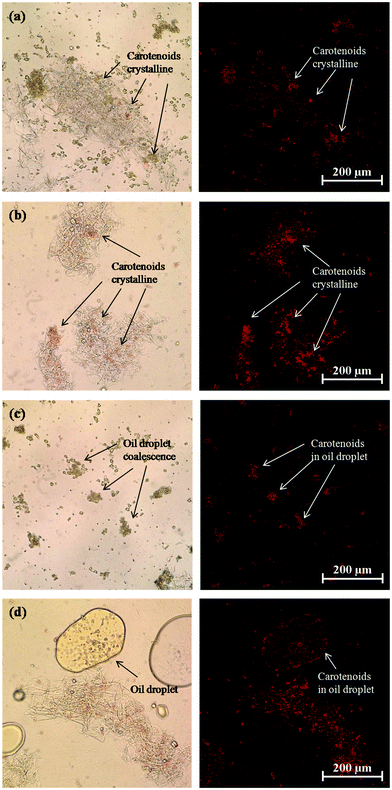
An increase in carotenoid bioaccessibility with decreasing lipid droplet size has also been reported in studies where β-carotene was encapsulated in emulsion-based delivery systems.33 However, carotenoids present within natural fruits and vegetables tend to be less bioaccessible than those encapsulated within emulsion-based delivery systems because they are trapped within specialized structures in the plant tissue. Consequently, they must first be released from the plant tissue matrix and incorporated into the lipid phase or mixed micelle phase before they can be absorbed. Carotenoids are stored in many plant tissues as crystals located within chromoplasts that can be directly visualized by optical microscopy.56 In addition, studies have shown that β-carotene crystals present within chromoplasts naturally have a weak fluorescence signal that can be detected by fluorescence microscopy.57 We therefore used optical and confocal fluorescence microscopy to study the microstructure of the carrot tissue after passing through the stomach stage (Fig. 8). We compared the microstructure of pureed carrot samples to which either a fine emulsion or bulk oil had been added because these treatments gave the biggest differences in bioaccessibility. The microscopy images clearly show that there were orange colored carotenoid crystals trapped within the carrot tissue matrix that were fluorescent (Fig. 8a and b). These images also suggested that there were more carotenoids remaining within the plant tissues mixed with the bulk oil than those mixed with the fine emulsion. This suggests that the small droplets in the fine emulsion may have been more effective at penetrating into the plant tissue and solubilizing some of the carotenoids. Indeed, observations of the lipid droplets themselves in the two different systems showed that there was more orange color and fluorescence in the small lipid droplets than in the large ones (Fig. 8c and d), supporting this hypothesis.
Studies with orange and tomato juices have reported that carotenoid bioaccessibility increases after processing, which was attributed to a reduction in the size of the pulp particles.58,59 This effect was related to an increase in the surface area of the pulp particles, which facilitated transfer of the large hydrophobic carotenoid molecules into the mixed micelle phase.
4. Conclusions
This study has shown that excipient emulsions containing small droplets may be particularly effective at increasing the bioaccessibility of carotenoids from carrots. This effect may be because the small lipid droplets can penetrate into the pores in the plant tissue and solubilize some of the carotenoids and/or because they are rapidly digested and form mixed micelles capable of solubilizing the carotenoids in the intestinal fluids. This information could be used to design excipient foods (such as dressings, dips, creams and sauces) that are more effective at enhancing the bioaccessibility of carotenoids from fruits and vegetables.Nevertheless, there are a number of other important factors that should be taken into account when designing excipient emulsions. First, the nature of any processing treatments applied to the fruits or vegetables may influence the bioaccessibility of the carotenoids, such as mechanical forces and thermal processing. Second, the point where the excipient emulsions are mixed with the produce may be important (e.g. before or after processing), since this may affect the size of the lipid droplets. Third, the nature of the emulsifier used to coat the lipid droplets will influence their stability within the GIT and therefore their particle size and aggregation state. The size and aggregation state of the lipid droplets will impact their ability to penetrate into the plant tissues, as well as the rate and extent of lipid digestion and mixed micelle formation. Finally, a relatively simple in vitro gastrointestinal model was used in this study, which is useful for screening different samples and for providing information about the physicochemical mechanisms involved, but that cannot mimic the complexity of the human GIT. It is likely that excipient emulsions will behave different under real conditions than in simple in vitro models. Consequently, it will be important to test excipient emulsions with different properties using animal or human feeding studies to demonstrate their efficacy.
Acknowledgements
This material is based upon work supported by the Cooperative State Research, Extension, Education Service, United State Department of Agriculture, Massachusetts Agricultural Experiment Station and by the United States Department of Agriculture, NRI grants (2013-03795, 2011-67021, and 2013-03795). This project was also partly supported by the National Natural Science Foundation of China (NSFC31428017). This project was also partly funded by the Deanship of Scientific Research (DSR), King Abdulaziz University, Jeddah, under grant numbers 330-130-1435-DSR, 299-130-1435-DSR, 87-130-35-HiCi. The authors, therefore, acknowledge with thanks DSR technical and financial support.References
- H. D. Belitz, W. Grosch and P. Schieberle, Food Chemistry, Springer, Berlin, Germany, 4th edn, 2009 Search PubMed.
- J. W. Brady, Introductory Food Chemistry, Cornell University Press, Ithaca, N.Y., 2013 Search PubMed.
- K. K. Namitha and P. S. Negi, Crit. Rev. Food Sci. Nutr., 2010, 50, 728–760 CrossRef CAS PubMed.
- J. A. Olson, J. Nutr., 1989, 119, 105–108 CAS.
- J. J. M. Castenmiller and C. E. West, Annu. Rev. Nutr., 1998, 18, 19–38 CrossRef CAS PubMed.
- R. G. Ziegler, J. Nutr., 1989, 119, 116–122 CAS.
- E. Giovannucci, A. Ascherio, E. B. Rimm, M. J. Stampfer, G. A. Colditz and W. C. Willett, J. Natl. Cancer Inst., 1995, 87, 1767–1776 CrossRef CAS PubMed.
- P. Astorg, Trends Food Sci. Technol., 1997, 8, 406–413 CrossRef CAS.
- G. S. Omenn, G. E. Goodman, M. D. Thornquist, J. Balmes, M. R. Cullen, A. Glass, J. P. Keogh, F. L. Meyskens Jr., B. Valanis and J. H. Williams Jr., N. Engl. J. Med., 1996, 334, 1150–1155 CrossRef CAS PubMed.
- A. V. Rao and S. Agarwal, Nutr. Res., 1999, 19, 305–323 CrossRef CAS.
- P. D. Fraser and P. M. Bramley, Prog. Lipid Res., 2004, 43, 228–265 CrossRef CAS.
- M. L. Bonet, J. A. Canas, J. Ribot and A. Palou, Arch. Biochem. Biophys., 2015, 572, 112–125 CrossRef PubMed.
- A. V. Rao and L. G. Rao, Pharmacol. Res., 2007, 55, 207–216 CrossRef CAS PubMed.
- R. E. C. Wildman, R. Wildman and T. C. Wallace, Handbook of nutraceuticals and functional foods, CRC Press, 2006 Search PubMed.
- E. Reboul, M. Richelle, E. Perrot, C. Desmoulins-Malezet, V. Pirisi and P. Borel, J. Agric. Food Chem., 2006, 54, 8749–8755 CrossRef CAS PubMed.
- A. Nagao, JARQ, 2014, 48, 385–391 CrossRef.
- L. Lemmens, I. Colle, S. Van Buggenhout, P. Palmero, A. Van Loey and M. Hendrickx, Trends Food Sci. Technol., 2014, 38, 125–135 CrossRef CAS.
- D. J. McClements, F. Li and H. Xiao, Annu. Rev. Food Sci. Technol., 2015, 6, 299–327 CrossRef CAS PubMed.
- R. M. Schweiggert, D. Mezger, F. Schimpf, C. B. Steingass and R. Carle, Food Chem., 2012, 135, 2736–2742 CrossRef CAS PubMed.
- M. L. Failla, C. Chitchumronchokchai, M. G. Ferruzzi, S. R. Goltz and W. W. Campbell, Food Funct., 2014, 5, 1101–1112 CAS.
- S. R. Goltz, W. W. Campbell, C. Chitchumroonchokchai, M. L. Failla and M. G. Ferruzzi, Mol. Nutr. Food Res., 2012, 56, 866–877 CAS.
- S. R. Goltz, T. N. Sapper, M. L. Failla, W. W. Campbell and M. G. Ferruzzi, Nutr. Res., 2013, 33, 358–366 CrossRef CAS.
- M. J. Brown, M. G. Ferruzzi, M. L. Nguyen, D. A. Cooper, A. L. Eldridge, S. J. Schwartz and W. S. White, Am. J. Clin. Nutr., 2004, 80, 396–403 CAS.
- M. G. Ferruzzi, J. L. Lumpkin, S. J. Schwartz and M. Failla, J. Agric. Food Chem., 2006, 54, 2780–2785 CrossRef CAS PubMed.
- D. J. McClements and H. Xiao, Food Funct., 2014, 5, 1320–1333 CAS.
- I. J. P. Colle, S. Van Buggenhout, L. Lemmens, A. M. Van Loey and M. E. Hendrickx, Food Res. Int., 2012, 45, 250–255 CrossRef CAS.
- P. Palmero, A. Panozzo, D. Simatupang, M. Hendrickx and A. Van Loey, Food Res. Int., 2014, 64, 831–838 CrossRef CAS.
- L. Zou, W. Liu, C. Liu, H. Xiao and D. J. McClements, J. Agric. Food Chem., 2015, 63, 2052–2062 CrossRef CAS PubMed.
- L. Zou, B. Zheng, W. Liu, C. Liu, H. Xiao and D. J. McClements, J. Funct. Foods, 2015, 15, 72–83 CrossRef CAS.
- L. Zou, W. Liu, C. Liu, H. Xiao and D. J. McClements, Food Funct., 2015, 6, 2475–2486 CAS.
- X. Liu, J. Bi, H. Xiao and D. J. McClements, J. Agric. Food Chem., 2016, 63, 8534–8543 CrossRef PubMed.
- R. Zhang, Z. Zhang, L. Zou, H. Xiao, E. A. Decker and D. J. McClements, J. Agric. Food Chem., 2016 Search PubMed , Submitted.
- L. Salvia-Trujillo, C. Qian, O. Martin-Belloso and D. J. McClements, Food Chem., 2013, 141, 1472–1480 CrossRef CAS PubMed.
- D. J. McClements and Y. Li, Food Funct., 2010, 1, 32–59 CAS.
- M. Minekus, M. Alminger, P. Alvito, S. Ballance, T. Bohn, C. Bourlieu, F. Carriere, R. Boutrou, M. Corredig, D. Dupont, C. Dufour, L. Egger, M. Golding, S. Karakaya, B. Kirkhus, S. Le Feunteun, U. Lesmes, A. Macierzanka, A. Mackie, S. Marze, D. J. McClements, O. Menard, I. Recio, C. N. Santos, R. P. Singh, G. E. Vegarud, M. S. J. Wickham, W. Weitschies and A. Brodkorb, Food Funct., 2014, 5, 1113–1124 CAS.
- R. Zhang, Z. Zhang, H. Zhang, E. A. Decker and D. J. McClements, Food Hydrocolloids, 2015, 45, 175–185 CrossRef CAS.
- D. J. McClements and Y. Li, Adv. Colloid Interface Sci., 2010, 159, 213–228 CrossRef CAS PubMed.
- C. Qian, E. A. Decker, H. Xiao and D. J. McClements, Food Chem., 2012, 135, 1440–1447 CrossRef CAS PubMed.
- E. Biehler, F. Mayer, L. Hoffmann, E. Krause and T. Bohn, J. Food Sci., 2010, 75, C55–C61 CrossRef CAS.
- R. Delahaije, H. Gruppen, M. L. F. Giuseppin and P. A. Wierenga, Adv. Colloid Interface Sci., 2015, 219, 1–9 CrossRef CAS PubMed.
- J. Israelachvili, Intermolecular and Surface Forces, Academic Press, London, UK, 3rd edn, 2011 Search PubMed.
- R. J. Hunter, Foundations of Colloid Science, Oxford University Press, Oxford, 1986 Search PubMed.
- E. Silletti, M. H. Vingerhoeds, W. Norde and G. A. Van Aken, Food Hydrocolloids, 2007, 21, 596–606 CrossRef CAS.
- M. H. Vingerhoeds, T. B. J. Blijdenstein, F. D. Zoet and G. A. van Aken, Food Hydrocolloids, 2005, 19, 915–922 CrossRef CAS.
- M. Armand, B. Pasquier, M. Andre, P. Borel, M. Senft, J. Peyrot, J. Salducci, H. Portugal, V. Jaussan and D. Lairon, Am. J. Clin. Nutr., 1999, 70, 1096–1106 CAS.
- R. Zhang, Z. Zhang, H. Zhang, E. A. Decker and D. J. McClements, Food Res. Int., 2015, 75, 71–78 CrossRef CAS.
- H. Singh and A. Sarkar, Adv. Colloid Interface Sci., 2011, 165, 47–57 CrossRef CAS PubMed.
- H. Singh, A. Ye and D. Horne, Prog. Lipid Res., 2009, 48, 92–100 CrossRef CAS PubMed.
- S. J. Hur, E. A. Decker and D. J. McClements, Food Chem., 2009, 114, 253–262 CrossRef CAS.
- M. Armand, B. Pasquier, P. Borel, M. Andre, M. Senft, J. Peyrot, J. Salducci and D. Lairon, Ol., Corps Gras, Lipides, 1997, 4, 178–185 CAS.
- M. Armand, B. Pasquier, M. André, P. Borel, M. Senft, J. Peyrot, J. Salducci, H. Portugal, V. Jaussan and D. Lairon, Am. J. Clin. Nutr., 1999, 70, 1096–1106 CAS.
- E. Bauer, S. Jakob and R. Mosenthin, Asian-Australas. J. Anim. Sci., 2005, 18, 282–295 CrossRef CAS.
- G. Fave, T. C. Coste and M. Armand, Cell. Mol. Biol., 2004, 50, 815–832 CAS.
- Y. Li and D. J. McClements, J. Agric. Food Chem., 2010, 58, 8085–8092 CrossRef CAS PubMed.
- S. Gaucel, I. C. Trelea, S. L. Feunteun, Y. Li and M. D. J. McClements, J. Agric. Food Chem., 2016 Search PubMed , in press.
- E. A. Tydeman, M. L. Parker, R. M. Faulks, K. L. Cross, A. Fillery-Travis, M. J. Gidley, G. T. Rich and K. W. Waldron, J. Agric. Food Chem., 2010, 58, 9855–9860 CrossRef CAS PubMed.
- R. J. Cherry, D. Chapman and J. Langelaar, Trans. Faraday Soc., 1968, 64, 2304–2307 RSC.
- C. M. Stinco, R. Fernandez-Vazquez, M. L. Escudero-Gilete, F. J. Heredia, A. J. Melendez-Martinez and I. M. Vicario, J. Agric. Food Chem., 2012, 60, 1447–1455 CrossRef CAS PubMed.
- E. A. Tydeman, M. L. Parker, M. S. J. Wickham, G. T. Rich, R. M. Faulks, M. J. Gidley, A. Fillery-Travis and K. W. Waldron, J. Agric. Food Chem., 2010, 58, 9847–9854 CrossRef CAS.
| This journal is © The Royal Society of Chemistry 2016 |


