
Helix aspersa gelatin as an emulsifier and emulsion stabilizer: functional properties and effects on pancreatic lipolysis
Zied
Zarai
*a,
Rafik
Balti
 b,
Assaâd
Sila
b,
Yassine
Ben Ali
a and
Youssef
Gargouri
a
b,
Assaâd
Sila
b,
Yassine
Ben Ali
a and
Youssef
Gargouri
a
aLaboratory of Biochemistry and Enzymatic Engineering of Lipases, National School of Engineers of Sfax, University of Sfax, PB 1173, Km 4 Road Soukra, 3038 Sfax, Tunisia. E-mail: zaraizied@hotmail.fr; Fax: +216 74 675 055; Tel: +216 74 675 055
bEnzymes & Bioconversion Unit, National School of Engineers of Sfax, University of Sfax, PB 1173, Km 4 Road Soukra, 3038 Sfax, Tunisia
First published on 5th October 2015
Abstract
Emulsions are widely used in food and pharmaceutical applications for the encapsulation, solubilization, entrapment, and controlled delivery of active ingredients. In order to fulfill the increasing demand for clean label excipients, natural polymers could be used to replace the potentially irritative synthetic surfactants used in emulsion formulation. In the present study, we have studied the properties of oil-in-water emulsions prepared with land snail gelatin (LSG) as the sole emulsifying agent, extracted and described for the first time. LSG was evaluated in terms of proximate composition, oil and water holding capacity, emulsifying and foaming properties, color and amino acid composition. Emulsions of trioctanoylglycerol (TC8) and olive oil were made at different gelatin/oil ratios and changes in droplet-size distribution were determined. The superior emulsifying properties of LSG, the susceptibility of gelatin protein emulsions increasing flocculation on storage, and the coalescence of gelatin emulsions following centrifugation were demonstrated. Furthermore, the effect of LSG on the activity of turkey pancreatic lipase (TPL) was evaluated through the pH-stat methodology with TC8 and olive oil emulsions. The LSG affected the TPL activity in a concentration-dependent way. Our results showed that LSG, comparably to gum arabic, increases the pancreatic lipase activity and improves its stability at the oil–water interface.
1. Introduction
Emulsification has been the subject of extensive research over the last few decades.1–4 There are numerous examples of its applications in cosmetics,5 pharmaceutical industries6 and food industries.2,7An emulsion could be simply defined as “a system comprised of two immiscible liquids, one of which is dispersed as droplets (the dispersed or internal phase) throughout the other (the continuous or external phase)”.8 Consequently, the stabilization and the emulsion formation become easier using an emulsifier, which would be adsorbed at the interface between oil and water and could decrease the interfacial tension and prevent coalescence of droplets by increasing repulsion forces between these droplets.9
The most common biopolymers used, such as proteins and polysaccharides, are good examples of natural emulsifiers and stabilizers. The latter are currently encountered in food industries and could be used to stabilize pharmaceutical emulsions. In the pharmaceutical field, these natural polymers are already used for other applications such as in capsule formation (gelatin), as tablet binders (gum arabic, chitosan, hypromellose), as suspending agents (gum arabic, hypromellose), etc.10 Many proteins could act as emulsifiers due to their ability to absorb at the oil–water interface11 and to increase the emulsion stability.12 The most recent studies on emulsion formulation and stabilization by proteins in the food industry are presented below. The examples of biopolymers presented below are mainly those already used in pharmaceutical applications other than emulsion formulation. Gelatin is really the only protein that could be properly categorized as a hydrocolloid, due to its unique hydrophilic character. Generally, gelatin has some emulsifying ability, but its best roles are as a colloid stabilizer and gelling agent.
Gelatin, a relatively high molecular weight protein, is derived from animal collagen, e.g. pig, cow or fish.13 The latter is often the most preferred due to its low contamination by bovine spongiform encephalitis. Collagen is hydrolyzed by boiling in the presence of an acid (Type A gelatin, pI ∼ 7–9) or alkali (Type B gelatin, pI ∼ 5).14
Gelatin is slightly surface active and could act as an emulsifier in oil-in-water emulsions.15 Surh et al.3 confirmed that a physically stable oil-in-water emulsion could be obtained with fish gelatin at concentrations equal to or above 4.0 wt%. However, these authors observed a small fraction of relatively large droplets (>10 μm). These results were explained by the relatively low surface activity of fish gelatin compared to β-lactoglobulin.
Nevertheless, it is important to determine whether gelatin could be used to prepare emulsions that are physically stable. Some previous studies showed that gelatin is surface active and is capable of acting as an emulsifier in oil-in-water emulsion.15
Therefore, the aim of this investigation was to extract gelatin from land snails (Helix aspersa) as a novel source, to study its physicochemical characteristics as well as its functional properties, and to evaluate its effect on interfacial binding and the lipase activity at the lipid–water interface.
2. Materials and methods
2.1. Chemicals and enzymes
Crude olive oil (O.O) was purchased from Sfax city (Tunisia) market. Other chemicals and reagents used were of analytical grade. The purification of turkey pancreatic lipase (TPL)16 and chicken pancreatic colipase17 was performed in our laboratory (LBGEL-Sfax) according to the method previously described.2.2. Gelatin extraction procedure and proximate composition
Gelatin was extracted from land snail (H. aspersa) meat according to the Zarai et al.18 method with few modifications. Meat was previously soaked in 0.02 M NaOH (1![[thin space (1/6-em)]](https://www.rsc.org/images/entities/char_2009.gif) :6 w/v). The mixture was stirred for 2 h at room temperature, and the alkaline solution was changed every 30 min. The alkaline-treated meat was then washed with distilled water until neutral pH was obtained. The gelatin was extracted from the washed pelleted tissue with 3% acetic acid pH 4.0 (1:6 (w/v)) for 18 h at 60 °C with gentle stirring. The mixtures were centrifuged for 30 min at 10000g using a refrigerated centrifuge to remove the insoluble material. The supernatant was collected, dialysed and lyophilized. The powder obtained was referred to as land snail gelatin (LSG).
:6 w/v). The mixture was stirred for 2 h at room temperature, and the alkaline solution was changed every 30 min. The alkaline-treated meat was then washed with distilled water until neutral pH was obtained. The gelatin was extracted from the washed pelleted tissue with 3% acetic acid pH 4.0 (1:6 (w/v)) for 18 h at 60 °C with gentle stirring. The mixtures were centrifuged for 30 min at 10000g using a refrigerated centrifuge to remove the insoluble material. The supernatant was collected, dialysed and lyophilized. The powder obtained was referred to as land snail gelatin (LSG).
The protein content was determined by estimating its total nitrogen content by the Kjeldahl method according to the AOAC method number 984.13.19
The moisture, ash and fat contents of the gelatin powder were determined according to the AOAC method numbers 927.05, 942.05 and 920.39 B, respectively.19 All measurements were performed in triplicate.
2.3. Amino acid analysis and molecular weight distribution
Gelatin solutions were hydrolysed in a vacuum in 6 mol L−1 HCl at 110 °C for 24 h in the presence of 0.1% phenol (v/v), and the hydrolysates were analysed using a Biochrom 20 amino acid analyser (Pharmacia, Barcelona, Spain). The results were expressed as the number of residues per 1000 residues.SDS–PAGE was performed as described by Laemmli20 using 70 g L−1 resolving gel and 40 g l−1 stacking gel.
2.4. Fourier transform infrared (FTIR) spectra analysis
FTIR spectra of gelatin samples were recorded using a Nicolet Nexus FT-IR spectrometer (Thermo Electron Corporation). The LSG was tested by infrared analysis with the KBr method.2.5. Water holding capacity (WHC) and fat binding capacity (FBC)
WHC was determined using the method outlined by Zarai et al.18 with slight modification. One gram of the samples was weighed into a preweighed 50 mL centrifuge tube and was mixed with 50 mL of distilled water. The samples were then allowed to stand at 30 ± 2 °C for 1 h before centrifugation at 450g for 20 min. After that, the supernatant was decanted and the centrifuge tube was drained for 30 min and weighed after that. The WHC was expressed as grams of water held by 100 g of gelatin.The above method was used for measuring the FBC, but instead of 50 mL distilled water, 10 mL of corn oil was added to the samples. The fat binding capacity was expressed as grams of oil held by 100 g of gelatin.
2.6. Determination of emulsifying properties
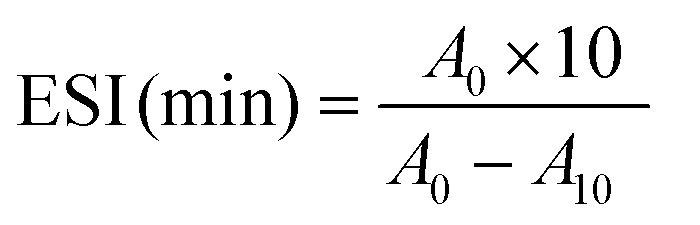
The emulsifying activity index (EAI) and the emulsion stability index (ESI) of gelatin were determined according to the method of Pearce et al.21 The gelatin solutions were prepared by dissolving dry gelatin in distilled water at 60 °C for 30 min. Thirty millilitres of gelatin solutions, in different concentrations from 1 to 4% (w/v), were homogenized with 10 ml of soybean oil for 1 min at room temperature (22 ± 1 °C) using a Moulinex® R62 homogenizer. Aliquots of the emulsion (50 μl) were taken from the bottom of the container at 0 and 10 min after homogenization, and diluted 100-fold with a 0.1% SDS solution. The mixtures were mixed thoroughly for 10 s using a vortex. The absorbance of the diluted solutions was measured at 500 nm using a spectrophotometer (T70, UV/VIS spectrometer, PG Instruments Ltd, China). Absorbances measured immediately (A0) and 10 min (A10) after emulsion formation were used to calculate the emulsifying activity index (EAI) and the emulsion stability index (ESI) according to the following equations:21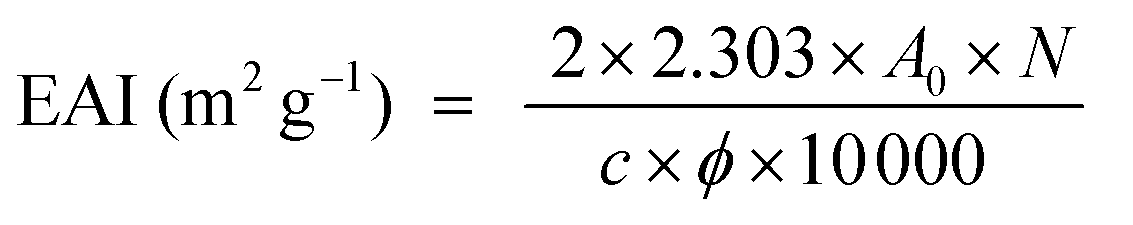
where N refers to the dilution factor, c refers to the weight of protein per unit volume (g ml−1), and ϕ refers to the oil volumetric fraction (0.25). All determinations are means of at least three measurements.
2.7. Determination of foaming properties
The foam expansion (FE) and foam stability (FS) of gelatin solutions were tested according to the Shahidi et al.22 method. Twenty millilitres of gelatin solutions (from 1 to 4% (w/v)) were homogenized using a Moulinex® R62 homogenizer to incorporate air for 1 min at room temperature (25 ± 1 °C). The whipped sample was then immediately transferred into a 50 ml graduated cylinder, and the total volume was measured at 0 and 60 min after whipping. Foam capacity was expressed as foam expansion at 0 min, which was calculated according to the following equation.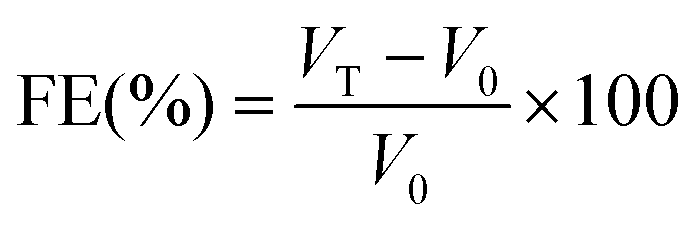
Foam stability was calculated as the volume of foam remaining after 60 min.
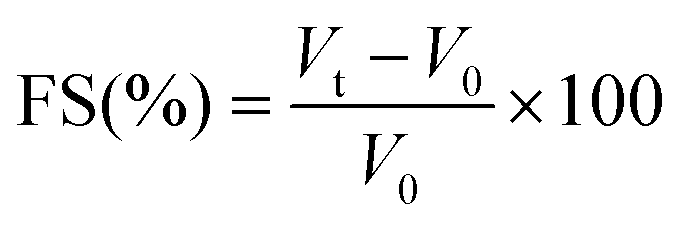
where VT is the total volume after whipping (ml); V0 is the volume before whipping; Vt is the total volume after leaving at room temperature for 60 min. All determinations are means of at least three measurements.
2.8. In vitro lipolysis model: pH-stat method
The pH-stat method is an analytical tool widely used in pharmaceutical and food research for the in vitro characterization of lipid digestion under simulated small intestinal conditions.23,24 It is based on the measurement of the free fatty acid amount released from lipids, usually triacylglycerols, after lipase addition at pH values close to neutral. It should be noted that the pH used was carefully selected since the ionization and the solubility of fatty acids, as well as the lipase activity, depend on pH in this region.25,26 The analyzed sample is placed in a controlled temperature reaction chamber that contains the substrate and the appropriate concentration of the major digestive components known to influence lipid digestion, such as lipase, co-lipase, bile salts, phospholipids, and mineral ions. The lipase in the reaction chamber catalyzes lipid digestion leading to the generation of two FFAs and one MAG per TAG molecule. The concentration of alkali (NaOH) that must then be added to the digestion cell to neutralize the FFAs produced by lipid digestion, and thereby maintain the pH at the initially pre-set value (pH 8.5), is recorded versus time. The pH-stat method is relatively simple and rapid to carry out and enables comparison of different emulsion based delivery systems under similar experimental conditions. This technique can therefore be used to rapidly screen the impact of different physicochemical factors expected to affect lipid digestion. Nevertheless, it is important to select an appropriate reaction chamber composition to obtain results that are comparable to the data obtained from in vivo studies.2.9. Preparation of emulsion and microscopic observation
To study the effect of emulsifier and concentrations on the uniformity of emulsions, the emulsions were prepared by homogenizing 50 wt% oil phase with 50 wt% aqueous phase (0.5–3 wt% LSG) using a Waring blender (3 × 30 s). Samples were transferred into glass tubes and stored for 12 h at room temperature, and then appreciable phase separation was observed in some of the systems. Photographic observation of emulsions was made during this time using a digital camera.A drop of the emulsions prepared for evaluating the emulsifying properties of the gelatin was placed on a microscope slide and covered by a cover slip. The emulsion structure was observed using an optical microscope (Olympus CX41, Japan) with a 40× objective; images were captured with the attached camera (QImaging MicroPublisher 3.3 RTV, Canada).
To study the possible location and functionality of particles in emulsions, the emulsions prepared for evaluating the emulsifying properties of the gelatin were transferred in 24-well microplates and were evaluated microscopically with an inverted phase contrast microscope.
2.10. Statistical analysis
All data were analyzed using the analysis of variance (ANOVA) and Duncan's multiple range tests to determine the significant differences between the means. The SPSS statistic program (Version 10.0) (SPSS, 1.2, 1998) was used for data analysis.3. Results and discussion
3.1. Proximate composition of raw materials and gelatin
Analysis of the LSG and the land snail meat proximate composition (Table 1) showed that the extracted gelatin has proteins as the major component (87.61 ± 0.35 g per 100 g), but they are almost free of fat. Jongjareonrak et al. (2006)27 reported that gelatins derived from the skin of bigeye snapper and brownstripe red snapper had protein contents of 87.9 g per 100 g and 88.6 g per 100 g respectively. Additionally, gelatins from the skin of grey triggerfish and cuttlefish had protein contents of 89.94 g per 100 g and 91.35 g per 100 g, respectively.28,29| Composition | Land snail meat | Land snail gelatin (LSG) |
|---|---|---|
| Asx = Asp + Asn; Glx = Glu + Gln. TEAA = total essential amino acids: ∑Ile + Leu + Lys + Met + Phe + Thr + Val + His. THAA = total hydrophobic amino acids: ∑Pro + Ala + Val + Met + Gly + Ile + Leu + Phe. Imino acids = Pro + Hyp.Values in the same row with different letters (a, b) differed significantly (p < 0.05). Values are given as mean ± SD from triplicate determination.a,b Different superscript letters in the same line indicate the significant differences (p < 0.05) (a > b). | ||
| Moisturea | 81.370 ± 0.580a | 9.85 ± 0.421b |
| Proteina | 14.654 ± 0.82a | 87.61 ± 0.35b |
| Asha | 1.32 ± 0.190a | 0.33 ± 0.012b |
| Fata | 0.168 ± 0.001a | 0.018 ± 0.002b |
| Colour | ||
| L* | — | 45.3 ± 1.103a |
| a* | — | 2.95 ± 0.275a |
| b* | — | 24.75 ± 1.262a |
| Amino acids | Number of residues/1000 | |
| Aspartic acid (Asx) | 80 | |
| Serine (Ser) | 70 | |
| Threonine (Thr) | 36 | |
| Glycine (Gly) | 224 | |
| Glutamic acid (Glx) | 118 | |
| Valine (Val) | 36 | |
| Alanine (Ala) | 72 | |
| Cysteine (Cys) | 4 | |
| Leucine (Leu) | 42 | |
| Methionine (Met) | 8 | |
| Isoleucine (Ile) | 21 | |
| Phenylalanine (Phe) | 19 | |
| Tyrosine (Tyr) | 13 | |
| Lysine (Lys) | 36 | |
| Hydroxylysine (Hyl) | 9 | |
| Histidine (His) | 10 | |
| Proline (Pro) | 82 | |
| Arginine (Arg) | 52 | |
| Hydroxyproline | 71 | |
| THAA | 504 | |
| Imino acids (Pro + Hyp) | 153 | |
The gelatin was found to be poor in ash (0.33 ± 0.01 g per 100 g) and moisture (9.85 ± 0.42 g per 100 g) contents. The ash content of LSG was lower than those of gelatin from other species including thornback ray skin gelatin (4.87 g per 100 g),30 sin croaker skin gelatin (1.49 g per 100 g) and shortfin scad skin gelatin (1.15 g per 100 g).31
These proportions indicate that the extracted gelatin was of high quality, knowing that the ash good quality gelatin content should be lower than 0.5%.32
The yield of gelatin extracted from land snail (4%) on the basis of wet weight was similar to the yields previously reported from several fish and mollusk species, including channel catfish (3.9%),33 mackerel (3.5%)34 and marine snail (4%).18
3.2. Amino acid analysis
Table 1 shows the amino acid composition of the land snail gelatin (LSG). The LSG has a lower molar content of imino acids (Pro + Hyp) (∼15%) than those previously reported for cuttlefish (Sepia officinalis) (∼18%),28 bigeye snapper (Priacanthus macracanthus) and brownstripe red snapper (Lutjanus vitta) (195% and 197%, respectively),27 marine snail (Hexaplex trunculus) (∼20.3%)18 and farmed giant catfish (Pangasianodon gigas) (∼21.1%).35The high content of proline (Pro) and hydroxyproline (Hyp) in samples was indicative of collagen and/or its derivatives.36
The LSG has a high molar content of serine (6.97%) and glycine (22.4%). Probably the hydroxyl side chains of serine and other hydroxylated amino acids play an important role in the generation of hydrogen bonds and helical structures during the storage for gel strengthening.
Hydroxyproline is expected to play a singular role in the stabilization of the triple stranded collagen helix due to its hydrogen bonding ability through its –OH group,37,38 indicating that the imino acids (proline and hydroxyproline) impart considerable rigidity to the collagen structure and that a relatively limited imino acid content should result in a less sterically hindered helix and may affect the dynamic properties of gelatin.34 Moreover, proline and glycine were the most predominant hydrophobic amino acids in the LSG, where the contents were 16.26% and 44.44%, respectively. Furthermore, the content of essential amino acids in LSG was calculated, and it was found to be 20.73%.
3.3. Molecular weight distribution
To characterize differences in molecular weight, gelatin preparation from land snail was analyzed by polyacrylamide gel electrophoresis in the presence of SDS (Fig. 1A). LSG demonstrated by sharp appearance in electrophoresis a notable amount of α-chains, but there was less content of β and γ-components, while a strong decrease of the β-component and a near disappearance of higher molecular weight polymers were observed.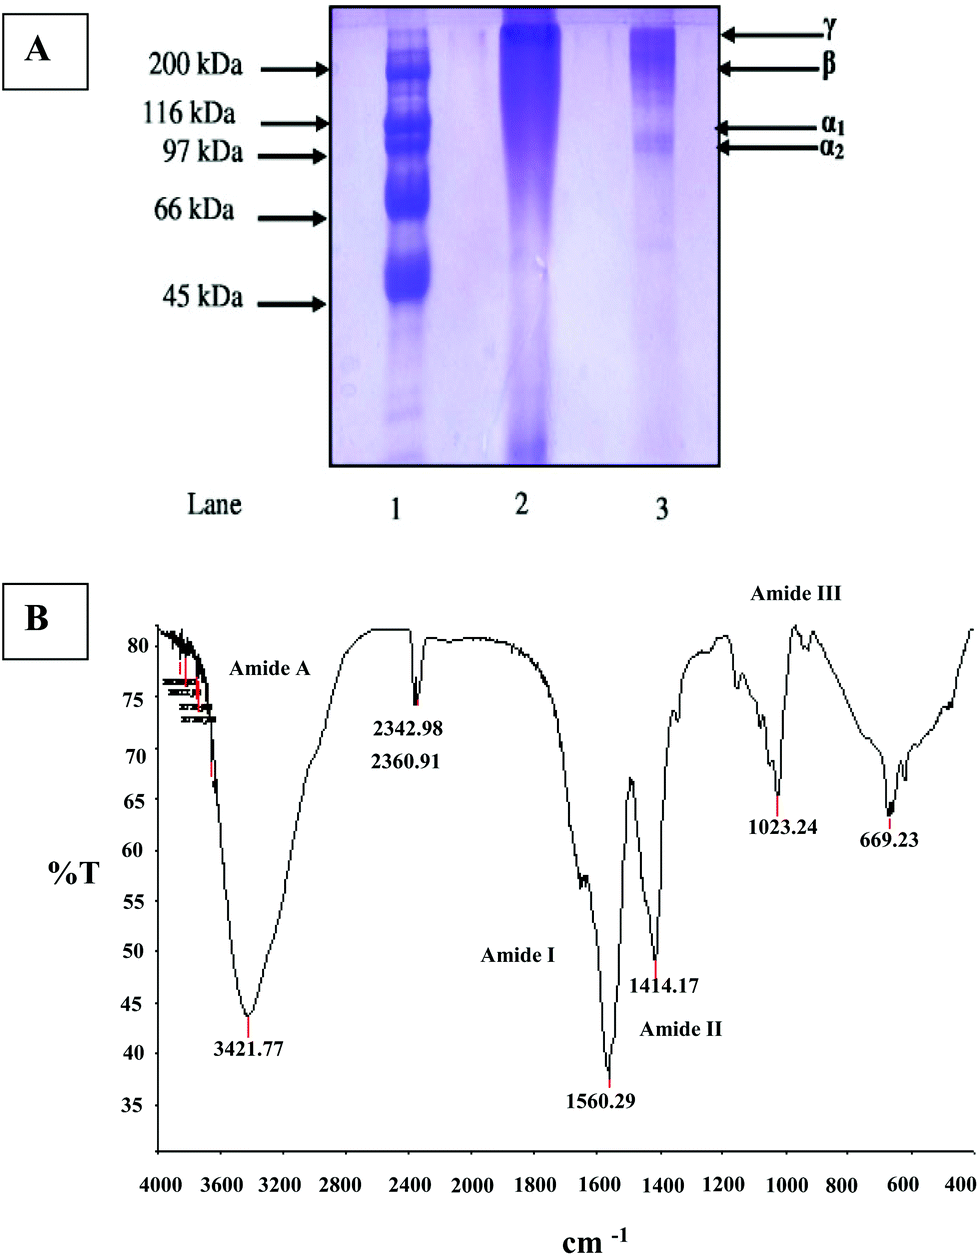 | ||
| Fig. 1 (A) SDS-PAGE analysis of LSG. γ, γ-chain; β, β-chain; α1, α1-chain; α2, α2-chain. Lane 1, protein markers; lane 2, crude LSG; lane 3, dialyzed LSG. (B) Fourier transform infrared (FTIR) spectra of land snail (H. aspersa) gelatin. | ||
As shown in Fig. 1A, LSG contained typical molecular distribution of collagen type I, where bands related to the α- (molecular weight around 100 kDa) and β- (molecular weight around 200 kDa) chains were found. However, the LSG presented the band corresponding to the γ-chain (molecular weight higher than 200 kDa).
Gelatin with high proportion of α and β chains has also been extracted from marine snail meat18 and cuttlefish.28
3.4. Fourier transform infrared (FTIR) spectrum
Frequencies at which major peaks appeared in the LSG FT-IR spectrum are shown in Fig. 1B. Four main regions were identified: 3600–2300 cm−1 (amide A), 1656–1644 cm−1 (amide I), 1560–1335 cm−1 (amide II) and 1240–670 cm−1 (amide III). The amide A peak absorption is due to N–H stretching, amide I peak is due to C![[double bond, length as m-dash]](https://www.rsc.org/images/entities/char_e001.gif) O stretching, amide II peak is due to N–H bending and C–N stretching vibrations, while the amide III peak is a complex system mainly associated with CH2 residual groups from glycine and proline.39 The absorption in the amide I region is probably the most useful for infrared spectroscopic analysis of proteins’ secondary structure. Its exact location depends on the hydrogen bonding and the conformation of the protein structure. In our study, the amide I band was observed at 1650 cm−1 with low intensity.
O stretching, amide II peak is due to N–H bending and C–N stretching vibrations, while the amide III peak is a complex system mainly associated with CH2 residual groups from glycine and proline.39 The absorption in the amide I region is probably the most useful for infrared spectroscopic analysis of proteins’ secondary structure. Its exact location depends on the hydrogen bonding and the conformation of the protein structure. In our study, the amide I band was observed at 1650 cm−1 with low intensity.
As most proteins have mixed secondary structures, the amide I band often shows several components or shoulders; consequently deconvoluting studies may be applied to further investigate conformation changes.
3.5. Colour measurement and gel clarity
The gelatin colour is an important physical property to report for extracted gelatins but does not influence the functional properties and is also important in the quality factor that is directly related to the acceptability of food products.The colour measurement of the LSG is presented in Table 1. LSG showed a high lightness (L*) value (45.3 ± 1.103). Generally, the gelatin manufacturer has a good process to clarify the impurities from the gelatin solution, such as chemical clarification and filtration processes. Lower a* and b* values (−0.23 ± 0.01 and 4.38 ± 0.02, respectively) were also found in LSG, when compared with other gelatins from cuttlefish (a* = −0.11 and b* = 11.77),28 marine snail (a* = −1.12 and b* = 48.77)18 and thornback ray (a* = 1.36 and b* = 15.75).30
The turbidity and dark colour of gelatin are commonly caused by inorganic, protein and mucosubstance contaminants, introduced or not removed during its extraction.
3.6. Water-holding and fat-binding capacities
Water-holding and fat binding capacities are functional properties. The latter are closely related to texture by the interaction between components such as water, oil and others. Water holding and fat binding capacities of LSG and commercial bovine gelatin were investigated. LSG showed a significantly higher fat binding capacity (6.5 ± 0.3 g oil per g protein) but lower water holding capacity (2.3 ± 0.1 g water per g protein) than that of commercial bovine gelatin (2.76 ± 0.17 g oil per g protein and 3.21 ± 0.46 g water per g protein, respectively). The obtained results were similar to those reported for skin gelatins from cuttlefish (3.25 g oil per g protein and 2.05 g water per g protein)28 and barbel (3.42 g oil per g protein and 2.98 g water per g protein).40 The fat-binding capacity of LSG seems to be dependent on the exposure degree of the hydrophobic residues in LSG, which is close to 504 residues per 1000 residues (Table 1). Lawal (2004)41 reported that this property is due to the presence of non-covalent bonds, such as hydrophobic, electrostatic and hydrogen bonding forces, that are involved in lipid–protein interactions. However, the water holding capacity seems to be affected by smaller amounts of hydrophilic amino acids in the gelatin structure.3.7. Emulsifying properties of gelatin
Gelatin is used as a foaming, emulsifying and wetting agent in food, pharmaceutical, medical and technical applications due to its surface-active properties.35 The emulsifying activity index (EAI) and emulsion stability index (ESI) of LSG at different concentrations are shown in Table 2. The EAI gelatin solution values increase with the increasing gelatin concentration (1 g per 100 mL to 4 g per 100 mL).| Concentration | 1% | 2% | 3% | 4% |
|---|---|---|---|---|
| FE = foam expansions, FS = foam stability, EAI = emulsifying activity index, ESI = emulsion stability index. | ||||
| FE (%) | 109.6 ± 0.33 | 120.2 ± 0.42 | 126.74 ± 2.19 | 131.55 ± 1.51 |
| FS (%) | 10.06 ± 0.58 | 18.12 ± 0.42 | 27.5 ± 1.11 | 38.24 ± 0.85 |
| EAI (m2 g−1) | 16.33 ± 2.2 | 24.4 ± 0.63 | 31.57 ± 1.04 | 40.08 ± 0.94 |
| ESI (min) | 48.26 ± 3.09 | 41.15 ± 1.25 | 33.69 ± 0.81 | 25.56 ± 2.68 |
At a concentration of 3 g per 100 mL, EAI of LSG was 31.57 ± 1.04 m2 g−1. This value was in accordance with those reported for gelatins from cuttlefish (38.43 ± 1.25 m2 g−1),28 smooth hound (32.39 ± 0.04 m2 g−1)42 and barbel (31.97 ± 0.74 m2 g−1).40 The amphoteric nature with the hydrophobic zones on the peptide chain makes gelatin behave as an emulsifier and it is being used in the manufacture of toffees and water-in-oil emulsions such as low fat margarine, salad dressings, and whipped cream.
Emulsions containing gelatin from land snails were very stable and the ESI at a concentration of 1 g per 100 ml was 48.26 ± 3.09 min (Table 2). Interestingly, the stability of these emulsions was higher than that of gelatins from zebra blenny (16.77 ± 2.05 min),43 smooth hound (41.30 ± 2.29 min),42 grey triggerfish (42.77 ± 0.74 min)29 and barbel (43.35 ± 0.98 min).40
This fact was ascribed to differences in the intrinsic properties, amino acid composition (content of hydrophobic amino acids) and protein conformation among the gelatins from different sources. Emulsion stability is related to the molecular weight of gelatin. Surh et al.3 reported that the oil-in-water emulsion prepared with high molecular weight fish gelatin (≈120 kDa) was more stable than that prepared with low molecular weight fish gelatin (≈50 kDa).
3.8. Foam capacity and foam stability
Foam capacity is another important property of gelatin for commonly used food applications. Foam expansion (FE) and foam stability (FS) of LSG are shown in Table 2. Foam expansion was determined at 0 and 60 min after whipping to evaluate the foam capacity and foam stability of LSG at different concentrations. As reported in Table 2, FE and FS of LSG increased with increasing gelatin concentrations. At 1 g per 100 mL and 4 g per 100 mL, the foam expansion values of land snail gelatin were 109.6 ± 0.33% and 131.55 ± 1.51%, respectively.Foam with a high concentration of proteins was denser and more stable because of an increase in the thickness of interfacial films. This is in line with the work of Balti et al. (2011)28 who reported that increasing cuttlefish skin gelatin and halal bovine gelatin concentrations leads to an increase of FE and FS.
However, FS of LSG decreased when the incubation time was increased. After 60 min of whipping, the amount of foam significantly decreased in the range between 70% and 90%, depending on the concentration used initially. The result suggested that during foam ageing, gravitational forces might cause water to drain and air cells came closer together.44 The foam stability of land snail gelatin (18.12 ± 0.42%) at 2 g per 100 mL was much lower than those of gelatins from smooth hound (49.83 ± 0.87%),42 barbel (87.5 ± 0.95%)40 and cuttlefish (100.35 ± 1.41%).28
The foam expansion and foam stability of LSG were expected to be affected by the amount of hydrophobic amino acids (about 50% in the total amino acids). Generally, foaming properties of gelatin might be influenced by the source of the protein, intrinsic properties of the protein, the compositions and conformations of the protein in solution and at the air/water interface.45
For adsorption at the air–water interface, molecules should contain hydrophobic regions which become more exposed upon protein unfolding, thus facilitating foam formation and stabilization.2
3.9. Effect of emulsifier and concentrations on the uniformity of emulsions
Land snail gelatin was used as an emulsifier in this study due to its nontoxic and safe use in food and cosmetic emulsions. Different concentrations of LSG in the water phase at 0.5, 1.0, 2.0, 3.0, and 4.0 wt% were used to prepare olive oil emulsions. The volume fraction of the dispersed oil phase is 50%. Photos of the vessel containing an olive oil-in-water (1:1) emulsion stabilized by increasing concentrations of gelatin (0.5 to 4%) are shown in Fig. 2A and B. These photos show a little phase separation when the concentration of LSG in the aqueous phase was lower than 1.0 wt%, highlighting the ability of gelatin particles to stabilize emulsions. However, upon a further increase of the incubation time at seven days particles, no stable emulsion could be formed. Instead, macroscopic phase separation occurred (Fig. 2B). It is likely that gelatin particles form large aggregates and agglomerates at high concentrations via hydrogen bonds among the particles, which sediment very quickly and subsequently obscure their surface activity.46
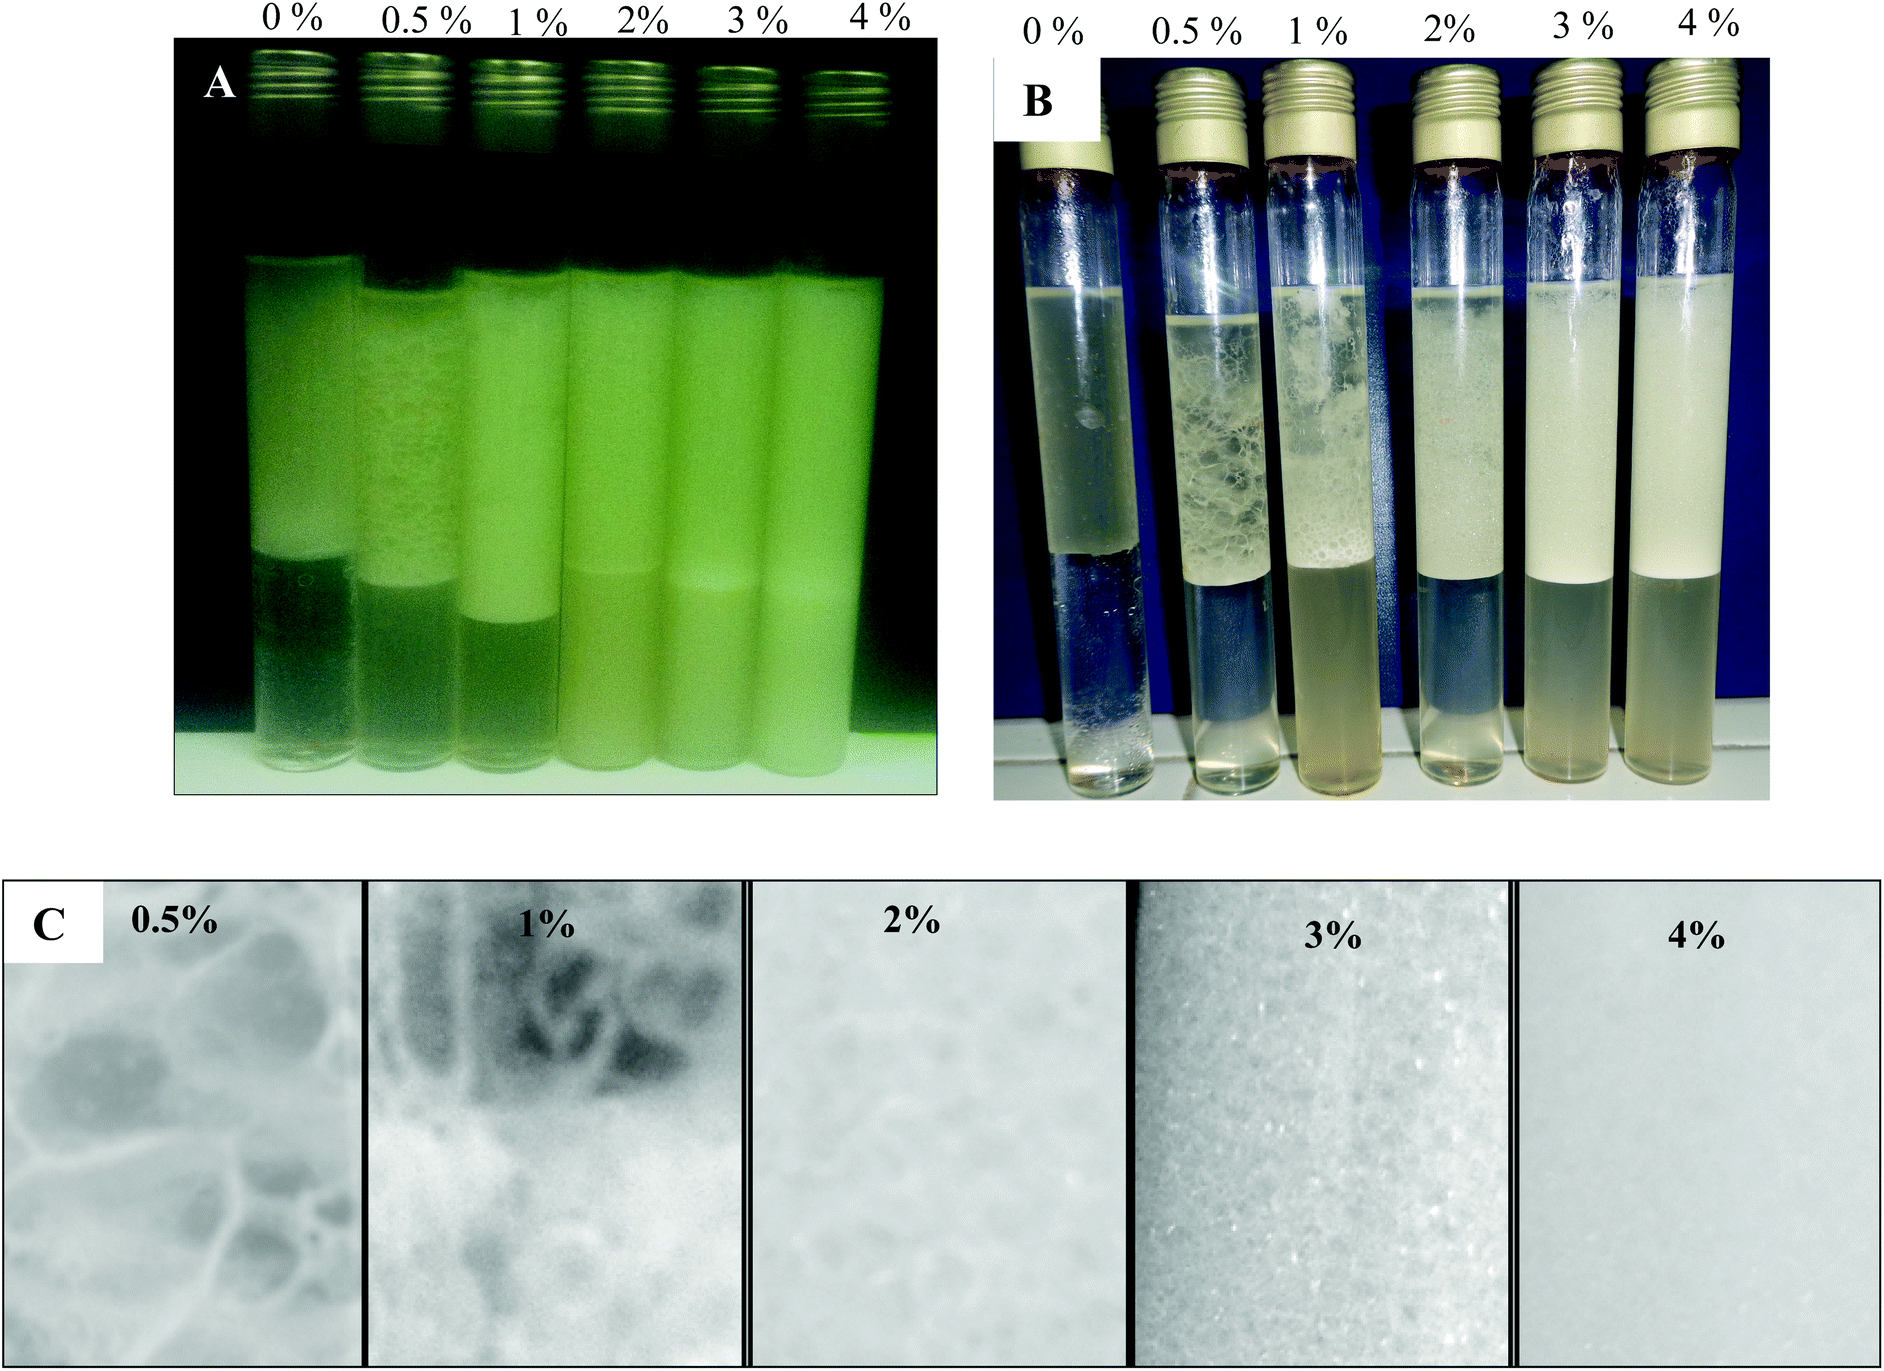 | ||
| Fig. 2 (A) Photograph of olive oil–water (1:1) emulsion stabilized by different concentrations of LSG (0.5 to 4%). The photograph was taken immediately after preparation. (B) The evolution of the olive oil–water emulsion at 25 °C with time for 2 different aqueous phases at pH 7, seven days after preparation by hand shaking and stored at room temperature. (C) The macroscopic images of olive oil–water (1:1). | ||
The uniformity of the prepared emulsions was improved by the increase of the LSG concentration in the aqueous phase. The reason was that the emulsifier content in the water phase was not enough to protect the droplet stability to result in coalescence of droplets when the concentration of LSG in the aqueous phase was lower than 1.0 wt%. When the concentration of LSG reached 2 wt%, droplets could be well protected, and therefore, the coalescence between droplets was avoided. However, when the amount of LSG reached 3.0, and 4.0 wt%, there were many small droplets detected as shown in Fig. 2C. This figure reveals macroscopic droplet size average distribution of the gelatin stabilized emulsion at various particle concentrations. As observed, the droplet decreases with the increasing particle concentration. At higher particle concentrations, we envisage that, in addition to adsorption at the interface, the particles in the aqueous phase are probably contiguous with those adsorbed, so the gelatin particles from different oil droplets are bound together in a three-dimensional network, which, in turn, traps the oil droplets in the gel matrix.47 Therefore, increasing the particle concentration leads to a stronger gel-like emulsion.
3.10. Microscopic observation of stabilization emulsion by LSG
The emulsions prepared with LSG (0.5 to 3 wt%) were compared with those prepared at the same concentrations, with lecithin, bovine serum albumin and Tween-20 (data not shown). The emulsion stability of gelatin was greater than that of other samples for all the concentrations used. Euston et al.48 reported that the heat-induced instability of emulsions appeared to proceed via the aggregation of adsorbed proteins at the surface of the emulsion droplets.Optical microscopy indicated that there were some large droplets in gelatin stabilized emulsions independent of the protein concentration or molecular weight. Nevertheless, the amounts of large droplets observed in emulsions tend to decrease as the land snail gelatin concentration increases (Fig. 3a– d). Moreover, it is interesting to see that the droplet size distribution is quite narrow; in particular, a high particle concentration is used to stabilize the emulsions.
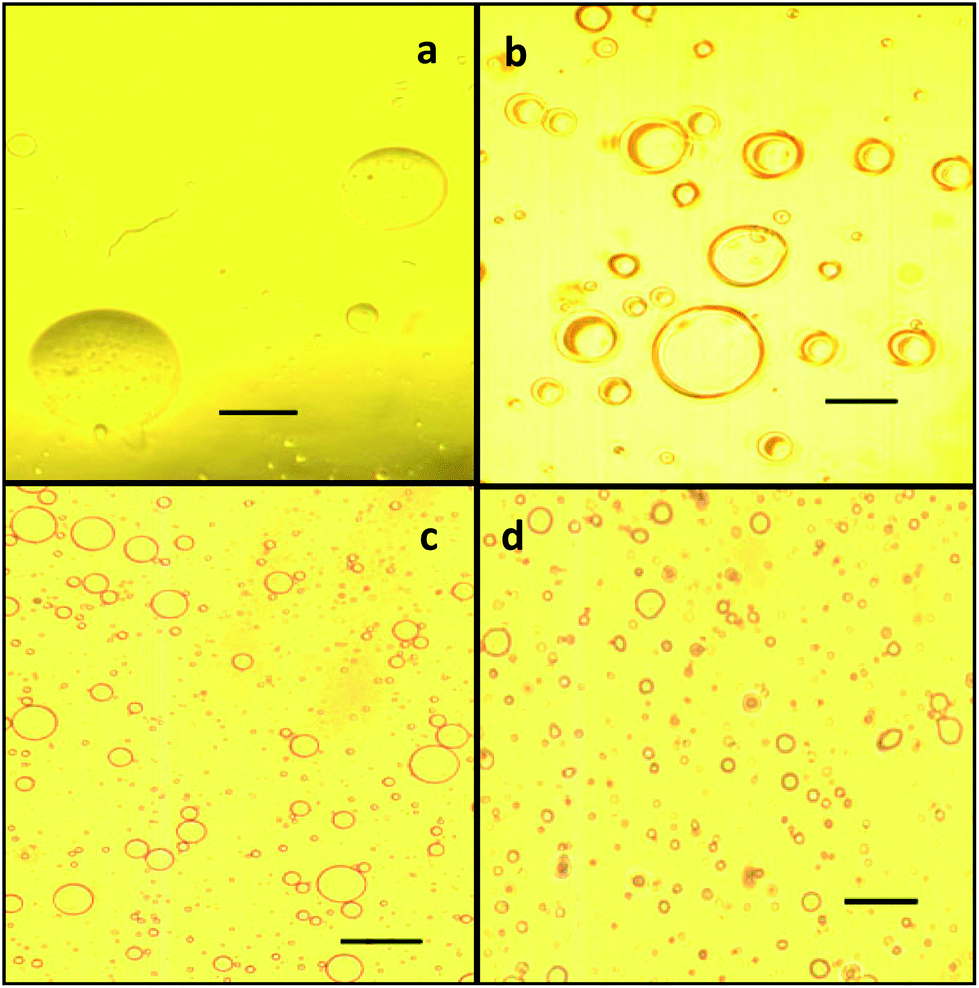 | ||
| Fig. 3 Optical micrographs of olive oil O/W emulsions prepared with different aqueous concentrations of land snail gelatin at (a) 0.5, (b) 1.0, (c) 2.0 and (d) 3 wt%. (Scale bar) 100 μm. | ||
These observations were generally in accordance with the emulsion stability results. According to Lee et al.49 the emulsifying layer of an excellent emulsifier formed a very thick and rough film that surrounded the oil droplets, whereas the emulsifying layer evidenced low emulsifying properties, and formed a thin and smooth film. Therefore, according to our data, gelatin is the best emulsifier among the examined samples.
The study on biologically derived stabilizers began with analysis of the specific properties desired from these particles. Since the beginning of the 20th century, scientists have known about the ability of partially hydrophobic particles to impart greater stability to emulsions than molecular surfactant stabilizers.50,51 However, not all particles, served as good stabilizers in many cases. Their surfaces need to be modified to adsorb in fluid interfaces. Particles with specific surface properties could irreversibly adsorb at the liquid–liquid interface with high energy gain. The particle could not be displaced from the interface by random fluctuations and adsorbed more or less irreversibly at the O/W interface. Particles could stabilize biphasic systems not only by adsorbing and packing at the liquid–liquid interface, but also by structuring in the continuous phase (Fig. 4). In Fig. 4(a–c), we show that in emulsions, particles could also be encapsulated in the dispersed phase. Emulsion stabilization by particles is discussed in multiple literature sources.52,53
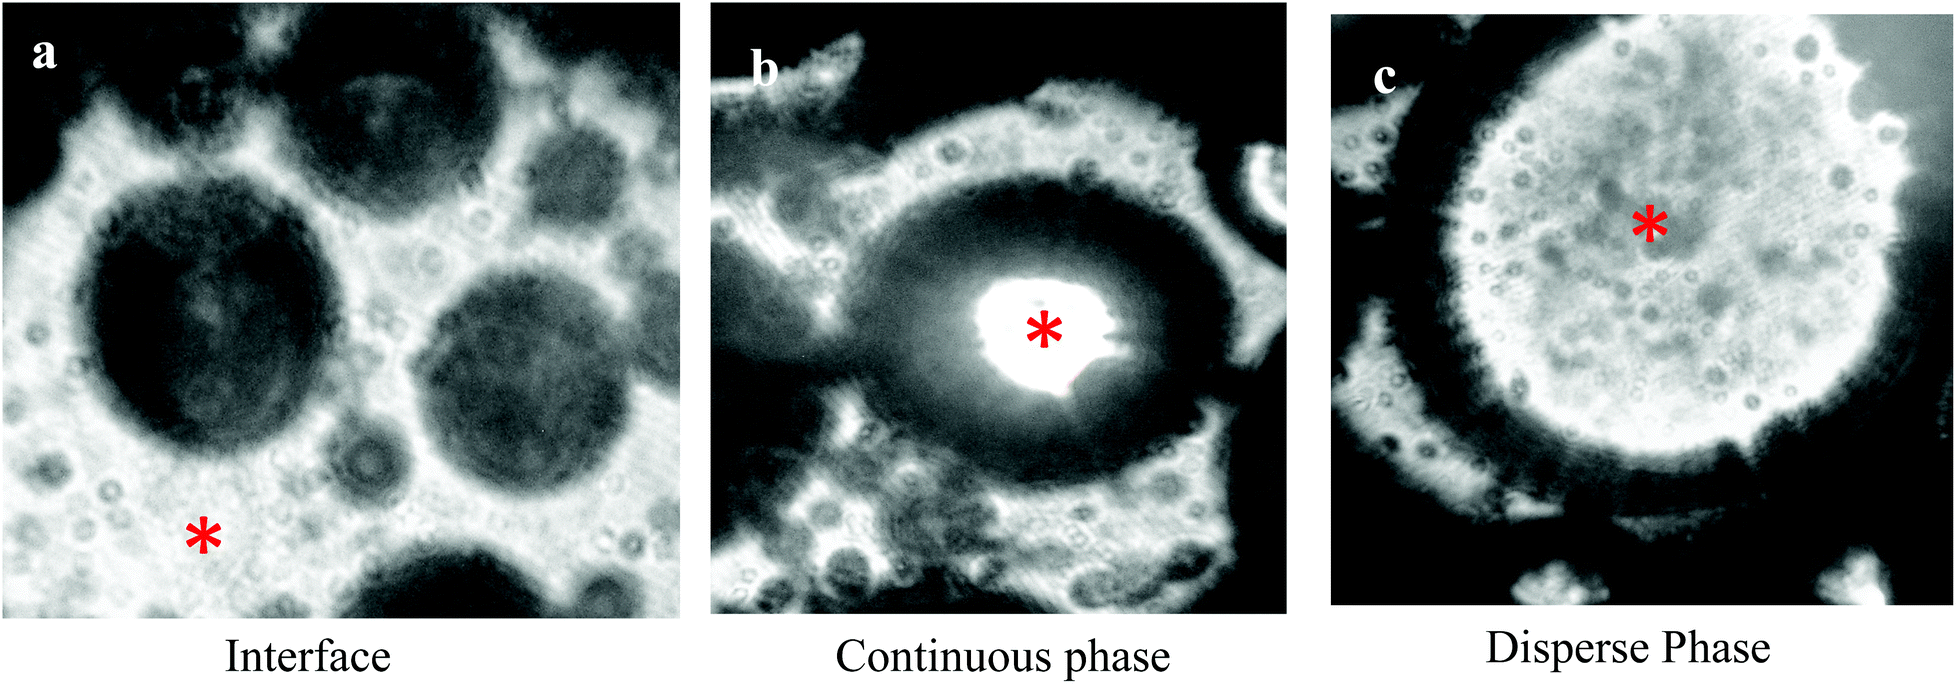 | ||
| Fig. 4 Possible location and functionality of particles in emulsions. (a) At the interface; (b) in the continuous phase; and (c) in the disperse phase. The second phase (not labeled as “H2O”) is the oil phase of the dispersion. *: H2O. | ||
3.11. Effects of LSG stabilized emulsion on pancreatic lipase activity
There are various kinds of enzymes in the mouth, stomach and small intestine that could digest food components, such as lipids (lipases), phospholipids (phospholipases), proteins (proteases), and starch (amylases).54 The ability of these enzymes to interact with their specific substrates within a delivery system may impact the lipid digestibility, and therefore the absorption of any encapsulated lipophilic active components. Enzyme accessibility to a substrate may be controlled by creating physical barriers between the encapsulated substrate and the surrounding aqueous phase where the digestive enzymes are normally located, e.g. coating a lipid droplet with a dietary fiber layer, trapping droplets within a floc, or encapsulating droplets within a hydrogel particle.55In this study, olive oil was hydrolyzed by turkey pancreatic lipase (TPL) in an olive oil-in-water emulsion system in an effort to improve the functional properties of land snail gelatin as an emulsifying agent. The hydrolytic activity of TPL was investigated, using olive oil in the presence or absence of 0.5% (w/v) LSG.
The TPL activity was measured under conditions of temperature and pH in the absence (Fig. 5A) and in the presence of emulsifiers (Fig. 5B). Our results showed clearly that in the absence of an emulsifier, the TPL loses its activity after about 4 min of hydrolysis (Fig. 5A). Whereas, when we added LSG or gum arabic at 0.5% (used as a control) as emulsifiers in the reaction vessel, TPL is extensively expressed, and linear kinetics of TAG hydrolysis were recorded in more than ten minutes (Fig. 5B).
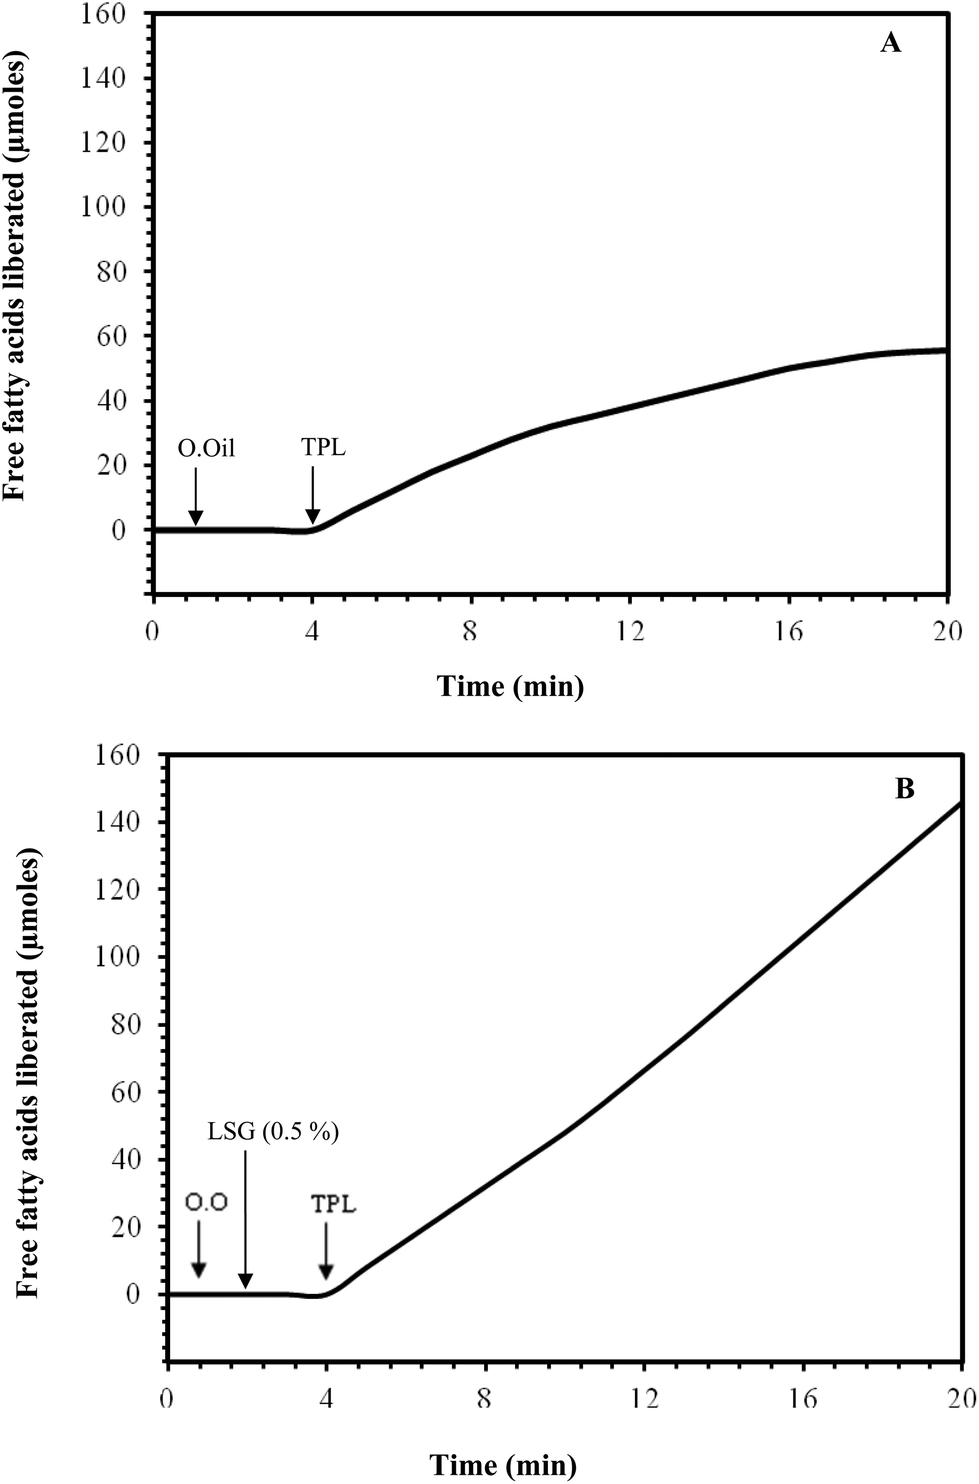 | ||
| Fig. 5 Effect of the gelatin on the lipolytic activity of turkey pancreatic lipase (TPL). The TPL activity was measured under conditions of temperature and pH in the absence of emulsifiers (A) and in the presence of LSG (0.5%), used as an emulsifier (B). | ||
In the case of the turkey pancreatic lipase, the degree of olive oil hydrolysis in the emulsion system was higher than that observed in the non-emulsion system. Seameariva and Desnuelle56 previously reported that the lipase-catalyzed hydrolysis of an emulsified substrate depends on the area and properties of the substrate/water interface. Lipases are enzymes that operate at the phase interface in a heterogeneous system, thus the use of surface active agents that form microemulsions or the use of a reverse micellar system may substantially augment lipase activity.57 It has been clearly established that the land snail gelatin, when used as an emulsifier during olive oil hydrolysis by the turkey pancreatic lipase, seems to stabilize the emulsion and represents a suitable interfacial component for lipases to adsorb.
3.11. Enzymatic hydrolysis of TC8 in emulsion system: effects of the LSG, NaTDC and colipase on the TPL activity
The effect of 1% (w/v) LSG on the hydrolytic activity of TPL was investigated, using a medium-chain trioctanoylglycerol (TC8) emulsion in the presence of colipase and in the presence or absence of various amounts of bile salts. It can be seen from Fig. 6B that in the presence of 1% (w/v) LSG, the TPL alone shows a very low activity and in the absence of NaTDC, the colipase addition activates slightly the TPL. However, a reactivation of TPL by colipase was observed when NaTDC was initially present in the pH-stat vessel, there was an absolute requirement of bile salt to relieve inhibition of the lipase/colipase system by protein.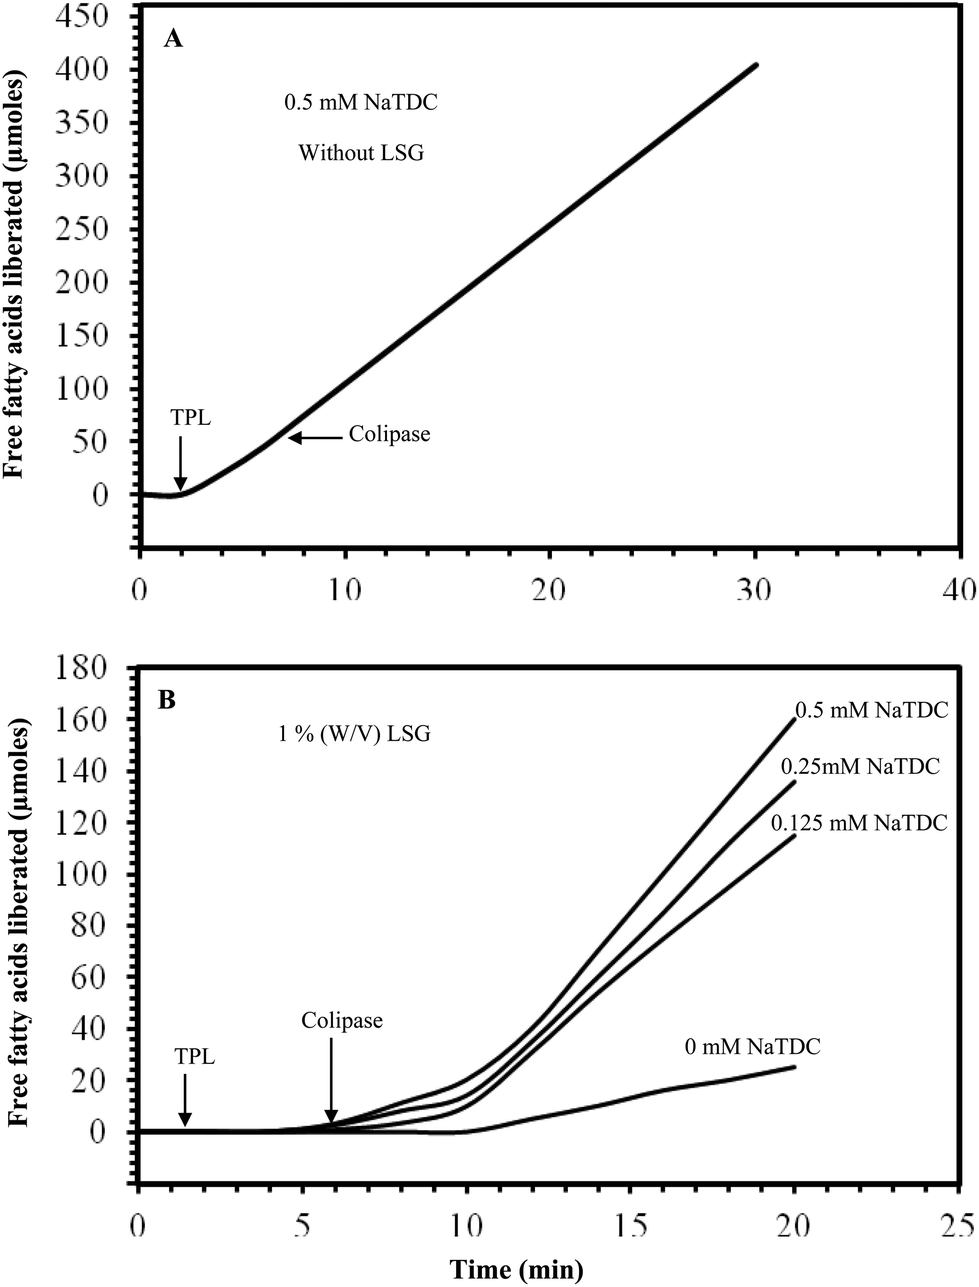 | ||
| Fig. 6 Effects of LSG, NaTDC, and colipase on TPL activity measured on TC8 emulsion. (A) Kinetics recordings of the hydrolysis of TC8 emulsion by TPL in the absence of LSG and in the presence of 0.5 mM NaTDC, using the pH-stat technique. (B) Kinetics recordings of the hydrolysis of TC8 emulsion by TPL in the presence of 1% (w/v) LSG and various concentrations of NaTDC. Kinetics recordings are representative of three independent experiments. | ||
At 0.5 mM NaTDC, the TPL activity was immediately restored when colipase was added. The specific activity of TPL reached the maximum value measured in the absence of LSG, as shown in Fig. 6A and it is extensively expressed, and linear kinetics of TC8 hydrolysis were recorded in the presence of LSG (1%) and various amounts of bile salts but we found an increase of lag time in this experiment.
The experiments reported here show that lipolysis is regulated by the presence of amphiphilic compounds such as bile salts and gelatin, which are adsorbed at the triglyceride–water interface and therefore influence the approach of water-soluble pancreatic lipase to its insoluble substrate (emulsified trioctanoylglycerol). The partition of bile salts between the lipid and the aqueous phase is of prime importance in the expression of lipase activity.58 Lipase activities were determined as a function of different combinations of concentrations of bile salts and gelatin (1%). From the lipase activity measurements using a medium-chain trioctanoylglycerol (TC8) emulsion, our results indicate that gelatin cannot be classified a priori as an inhibitor or an activator of pancreatic lipase. As an amphiphilic compound, gelatin may exert a synergistic effect with bile salts via the formation of mixed micelles. Similar results were obtained by Lykidis et al. (1997)58 when he studied the combined effect of a lecithin and a bile salt on pancreatic lipase activity.
4. Conclusions
The present work reported the first extraction process of gelatin from land snails (H. aspersa), the functional and the emulsifying properties and the effect on pancreatic lipase activity. Our results show that one of the key functional roles of gelatins is in the preparation of emulsions and in the control of emulsion shelf life. The gelatin could act as an emulsifier (emulsifying agents) and as a stabilizer (stabilizing agents) of oil-in-water emulsions. The latter functionality requires a substantial surface activity at the oil–water interface, and hence the ability to facilitate the formation and stabilization of fine droplets during and after emulsification. Comparably to gum arabic, used as an emulsifier reference, the LSG increases the TPL activity and improves its stability at the oil–water interface. In this respect, the information generated in the present study will be useful for designing stable colloidal dispersions based on lipids for a variety of innovative food applications.Disclosure
The authors declare no conflict of interest.Acknowledgements
This work was funded by the Ministry of Higher Education and Scientific Research, Tunisia.References
- E. Dickinson, Food Hydrocolloids, 2009, 23, 1473–1482 CrossRef CAS PubMed.
- E. Dickinson, J. Colloid Interface Sci., 2015, 449, 38–45 CrossRef CAS PubMed.
- J. Surh, E. A. Decker and D. J. McClements, Food Hydrocolloids, 2006, 20, 596–606 CrossRef CAS PubMed.
- N. H. Magnus, J. D. Morten, S. Tore and I. D. Kurt, Food Hydrocolloids, 2014, 37, 77–85 CrossRef PubMed.
- S. Raynal, J. L. Grossiord, M. Seiller and D. Clausse, J. Controlled Release, 1993, 26(2), 129–140 CrossRef CAS.
- B. Eleonore, M. Ghozlene, R. Veronique, G. Jean-Louis and A. Florence, Int. J. Pharm., 2012, 436, 359–378 CrossRef PubMed.
- E. Scholten, T. Moschakis and C. G. Biliaderis, Food Struct., 2014, 1, 39–54 CrossRef PubMed.
- S. M. Jafari, E. H. Y. Assadpoor and B. Bhandari, Food Hydrocolloids, 2008, 22(7), 1191–1202 CrossRef CAS PubMed.
- D. J. McClements, Food emulsions: Principles, practice, and techniques, CRC press, 1998 Search PubMed.
- R. C. Rowe, P. J. Sheskey and S. C. Owen, Handbook of Pharmaceutical Excipients, Pharmaceutical Press and the American Pharmacists Association, London, 5th edition, 2006 Search PubMed.
- D. Mobius and R. Miller, Proteins at Liquid Interfaces, Elsevier, Amsterdam, 1998 Search PubMed.
- D. J. McClements, Curr. Opin. Colloid Interface Sci., 2004, 9, 305–313 CrossRef CAS PubMed.
- D. A. Ledward, in: Functional Properties of Food Macromolecules, ed. J. R. Mitchel and D. A. Ledward, Elsevier, London, 1986 Search PubMed.
- A. R. Taherian, M. Britten, H. Sabik and P. Fustier, Food Hydrocolloids, 2011, 25, 868–878 CrossRef CAS PubMed.
- L. Lobo, J. Colloid Interface Sci., 2002, 254, 165–174 CAS.
- A. Sayari, H. Mejdoub and Y. Gargouri, Biochimie, 2002, 82(2), 153–159 CrossRef.
- A. Gannouchi Ben Becha, F. Frikha, I. Djemal, A. Fendri, N. Miled, Y. Gargouri and H. Mejdoub, J. Lipid Res., 2006, 47, 2701–2711 CrossRef PubMed.
- Z. Zarai, R. Balti, H. Mejdoub, Y. Gargouri and A. Sayari, Process Biochem., 2012, 47(12), 1779–1784 CrossRef CAS PubMed.
- AOAC, Official methods of analysis, Association of Official Analytical Chemists, Washington, DC, 17th edn, 2000 Search PubMed.
- U. K. Laemmli, Nature, 1970, 227, 680–685 CrossRef CAS PubMed.
- K. N. Pearce and J. E. Kinsella, J. Agric. Food Chem., 1978, 26, 716–723 CrossRef CAS.
- F. Shahidi, H. Xiao-Qing and J. Synowiecki, Food Chem., 1995, 53, 285–293 CrossRef CAS.
- M. Armand, P. Borel, P. Ythier, G. Dutot, C. Melin, M. Senft, H. Lafont and D. Lairon, J. Nutr. Biochem., 1992, 3(7), 333–341 CrossRef CAS.
- A. Dahan and A. Hoffman, J. Controlled Release, 2008, 129(1), 1–10 CrossRef CAS PubMed.
- H. Ali, A. Siddiqui and S. Nazzal, J. Dispersion Sci. Technol., 2010, 31(2), 226–232 CrossRef CAS PubMed.
- E. Bauer, S. Jakob and R. Mosenthin, Asian-Australas. J. Anim. Sci., 2005, 18(2), 282–295 CrossRef CAS.
- A. Jongjareonrak, S. Benjakul, W. Visessanguan and M. Tanaka, Food Hydrocolloids, 2006, 20, 1216–1222 CrossRef CAS PubMed.
- R. Balti, M. Jridi, A. Sila, N. Souissi, N. Nedjar-Arroume, D. Guillochon and M. Nasri, Food Hydrocolloids, 2011, 25, 943–950 CrossRef CAS PubMed.
- K. Jellouli, R. Balti, A. Bougatif, N. Hmidet, A. Barkia and M. Nasri, LWT–Food Sci. Technol., 2011, 44, 1965–1970 CrossRef CAS PubMed.
- I. Lassoued, M. Jridi, R. Nasri, A. Dammak, M. Hajji, M. Nasri and A. Barkia, Food Hydrocolloids, 2014, 41, 309–318 CrossRef CAS PubMed.
- C. S. Cheow, M. S. Norizah, Z. Y. Kyaw and N. K. Howell, Food Chem., 2007, 101, 386–391 CrossRef CAS PubMed.
- S. Benjakul, K. Oungbho, W. Visessanguan, Y. Thiansilakul and S. Roytrakul, Food Chem., 2009, 116, 445–451 CrossRef CAS PubMed.
- K. Osborne, M. N. Voight and D. E. Hall, Utilisation of lumpfish carcasses for production of gelatin, in Advances in Fisheries Technology and Biotechnology for Increased Profitability, ed. M. N. Voight and J. K. Botta, Technomic Publishing Co., Lancaster, PA, USA., 1990, pp. 143–153 Search PubMed.
- Z. Khiari, D. Rico, A. B. Martin-Diana and C. Barry-Ryan, J. Fish. Aquat. Sci., 2011, 5, 52–63 CAS.
- A. ongjareonrak, S. Rawdkuen, M. Chaijan, S. Benjakul, K. Osako and M. Tanaka, LWT–Food Sci. Technol., 2010, 43, 161–165 CrossRef PubMed.
- O. F. Vázquez, F. O. E. Moron and M. N. F. Gonzalez, J. Liq. Chromatogr. Relat. Technol., 2004, 27, 2771–2780 CrossRef PubMed.
- D. Ledward, in: A Gelation of gelatin, ed. J. R. Mitchell, & and D. A. Ledward, Elsevier Applied Science Publishers, London, 1986 Search PubMed.
- F. A. Johnston-Banks, in Food gels, ed. P. Harris, Elsevier Science, London, 1990, pp. 233–289 Search PubMed.
- F. Badii and N. K. Howell, Food Hydrocolloids, 2006, 20, 630–640 CrossRef CAS PubMed.
- A. Sila, O. Martinez-Alvarez, A. Haddar, M. C. Gómez-Guillén, M. Nasri, M. P. Montero and A. Bougatef, Food Chem., 2015, 168, 478–486 CrossRef CAS PubMed.
- O. S. Lawal, Food Chem., 2006, 86, 345–355 CrossRef PubMed.
- A. Bougatef, R. Balti, A. Sila, R. Nasri, G. Graiaa and M. Nasri, LWT–Food Sci. Technol., 2012, 48, 248–254 CrossRef CAS PubMed.
- N. Ktari, M. Jridi, R. Nasri, I. Lassoued, H. Ben Ayed, A. Barkia and M. Nasri, LWT–Food Sci. Technol., 2014, 58(2), 602–608 CrossRef CAS PubMed.
- J. F. Zayas, Solubility of proteins, in Functionality of proteins in food, Springer-Verlag, Berlin, 1997, pp. 6–22 Search PubMed.
- P. J. Wilde and D. C. Clark, Foam formation and stability in: Methods of Testing Protein Functionality, ed. G.M. Hall, Bury St. Edmunds: St Edmunds bury Press, 1st edition, 1996, pp. 110–152 Search PubMed.
- B. P. Binks, J. Philip and J. A. Rodrigues, Langmuir, 2005, 21, 3296–3302 CrossRef CAS PubMed.
- H. Tan, G. Sun, W. Lin, C. Mu and T. Ngai, ACS Appl. Mater. Interfaces, 2014, 6, 13977–13984 CAS.
- S. R. Euston, S. R. Finnigan and R. L. Hirst, Food Hydrocolloids, 2000, 14, 155–161 CrossRef CAS.
- S. W. Lee, M. Shimizu, S. Kaminogawa and K. Yamauchi, Agric. Biol. Chem., 1987, 51, 1535–1540 CrossRef CAS.
- W. Ramsden, Proc. R. Soc. London, 1903, 72, 156 CrossRef CAS.
- S. U. Pickering, J. Chem. Soc., 1907, 91, 2001–2021 RSC.
- T. N. Hunter, R. J. Pugh, G. V. Franks and G. J. Jameson, Adv. Colloid Interface Sci., 2008, 137, 57 CrossRef CAS PubMed.
- K. P. Velikov and O. D. Velev, in Colloid stability and application in pharmacy, ed. T. F. Tadros, Wiley-VCH Publ, Weinheim, 2007, p. 277 Search PubMed.
- P. Tso, Overview of digestion and absorption, in Biochemical and Physiological Aspects of Human Nutrition, ed. K. D. Crissinger and M. H. Stipanuk, W.B. Saunders Company, Philadelphia, Pennsylvania, 2000, pp. 75–90 Search PubMed.
- S. Mun, E. A. Decker, Y. Park, J. Weiss and D. J. McClements, Food Biophys., 2006, 1(1), 21–29 CrossRef.
- M. Seameariva and P. Desnuelle, Adv. Enzymol. Relat. Areas Mol. Biol., 1979, 48, 319–370 Search PubMed.
- Z. Knezevic, L. Mojovic and B. Adnadjevic, Enzyme Microb. Technol., 1998, 22, 275–280 CrossRef CAS.
- A. Lykidis, A. Avranas and P. Arzoglou, Comp. Biochem. Physiol., B: Biochem. Mol. Biol., 1997, 116(1), 51–55 CrossRef CAS.
| This journal is © The Royal Society of Chemistry 2016 |