 Open Access Article
Creative Commons Attribution 3.0 Unported Licence
Design and stabilisation of a high area iron molybdate surface for the selective oxidation of methanol to formaldehyde
Stephanie
Chapman
ab,
Catherine
Brookes
bc,
Michael
Bowker
bc,
Emma K.
Gibson
bd and
Peter P.
Wells
*bd
aUniversity of Southampton, Southampton, SO17 1BJ, UK
bUK Catalysis Hub, Research Complex at Harwell, RAL, Oxford, OX11 0FA, UK. E-mail: peter.wells@rc-harwell.ac.uk
cCardiff University, Cardiff, CF10 3XQ, UK
dUniversity College London, London, WC1H 0AJ, UK
First published on 8th December 2015
Abstract
The performance of Mo-enriched, bulk ferric molybdate, employed commercially for the industrially important reaction of the selective oxidation of methanol to formaldehyde, is limited by a low surface area, typically 5–8 m2 g−1. Recent advances in the understanding of the iron molybdate catalyst have focused on the study of MoOx@Fe2O3 (MoOx shell, Fe2O3 core) systems, where only a few overlayers of Mo are present on the surface. This method of preparing MoOx@Fe2O3 catalysts was shown to support an iron molybdate surface of higher surface area than the industrially-favoured bulk phase. In this research, a MoOx@Fe2O3 catalyst of even higher surface area was stabilised by modifying a haematite support containing 5 wt% Al dopant. The addition of Al was an important factor for stabilising the haematite surface area and resulted in an iron molybdate surface area of ∼35 m2 g−1, around a 5 fold increase on the bulk catalyst. XPS confirmed Mo surface-enrichment, whilst Mo XANES resolved an amorphous MoOx surface monolayer supported on a sublayer of Fe2(MoO4)3 that became increasingly extensive with initial Mo surface loading. The high surface area MoOx@Fe2O3 catalyst proved amenable to bulk characterisation techniques; contributions from Fe2(MoO4)3 were detectable by Raman, XAFS, ATR-IR and XRD spectroscopies. The temperature-programmed pulsed flow reaction of methanol showed that this novel, high surface area catalyst (3ML-HSA) outperformed the undoped analogue (3ML-ISA), and a peak yield of 94% formaldehyde was obtained at ∼40 °C below that for the bulk Fe2(MoO4)3 phase. This work demonstrates how core–shell, multi-component oxides offer new routes for improving catalytic performance and understanding catalytic activity.
Introduction
Mixed-metal oxides are employed extensively as selective-oxidation catalysts and, in this capacity, iron and bismuth molybdates are a paragon. Whilst bismuth molybdate is a well-known catalyst for the oxidation and ammoxidation of olefins,1,2 iron molybdate is employed extensively for the selective oxidation of methanol to formaldehyde. The latter is a reaction of particular industrial importance, given that global demand for formaldehyde exceeds 30 million tonnes pa.3Despite their industrial significance, the application of iron and bismuth molybdates is hindered by low surface areas (typically < 6 m2 g−1),4,5 which limit the catalytic performance. Recent catalysis literature is largely devoted to the study of nanoparticle (NP) catalysts. Such systems can afford high mass activities and often exhibit exceptional properties compared to those materials prepared by conventional routes. Since nearly 50% of industrial formaldehyde production uses bulk-phase ferric molybdate,6 the development of nanoscale systems as a means of catalyst optimisation is hugely relevant.
Bowker,7 Brookes,8,9 and others10,11 have investigated haematite-supported molybdena, MoOx@Fe2O3, a shell@core system that comprises layers of molybdena deposited on haematite nanoparticles by thermal spreading,10 or incipient wetness impregnation.7–9,11 The shell@core catalyst was designed to isolate the catalytic contribution of surface molybdenum from that in the ferric molybdate bulk.8 By studying the model system, the catalyst activity has since been attributed to a well-dispersed layer of amorphous or low-dimensional crystalline molybdena (MoOx) at the surface.12 Notably, Brookes et al. reported improved catalytic activity using the MoOx@Fe2O3 catalyst, versus the ferric molybdate bulk phase, which was attributed to a 3–4-fold greater surface area in the former.9 It is thus proposed that by supporting the monolayer of catalytic molybdena at higher surface areas, an enhanced performance can be achieved.
Whilst dispersion of molybdena on inherently high surface area supports, such as alumina, titania and silica, has been documented,13 these materials favour inhomogeneous growth and distribution of molybdena. An exposed support reduces formaldehyde selectivity by promoting the formation of carbon monoxide and carbon dioxide by-products.14 In contrast, XAFS studies have shown that a solid state reaction between surface MoO3 crystallites and bulk haematite generates a subsurface layer of catalytic Fe2(MoO4)3.15 The interaction between the molybdena and ferric molybdate subsurface promotes high selectivity for formaldehyde; hence haematite is the favoured catalyst support.
In addition to applications as a support, nanoparticulate haematite finds widespread use in catalysis, including the oxidation of carbon monoxide,16 photocatalytic splitting of water,17 biomass conversion,18 and catalytic combustion.19 Although an inherently high energy of crystallisation of iron oxides affords surface areas in excess of 100 m2 g−1,20 high-temperature crystallisation of haematite leads to sintering and surface area losses.21
For the purpose of methanol oxidation, it is desirable to preserve the chemical properties of haematite and yet maintain higher surface areas to improve the catalyst performance. Herein, aluminium-doped haematite has been used as a support for a molybdena catalyst. The support has been found to retain the characteristics of hematite but a greater resistance to sintering has sustained a higher surface area of catalytic molybdena. Although the influence of the Al-dopant on the structure of iron oxide has been discussed extensively,22–24 to our knowledge, the application of such materials in the context of a catalyst support material is a novel application.
Experimental
Catalyst preparation
The bulk materials were synthesised by co-precipitation. Dilute HNO3 (70%, Sigma Aldrich) at pH 2 was maintained at 60 °C under stirring, whilst an aqueous solution of iron(III) nitrate nonahydrate (Sigma Aldrich) was added in a dropwise manner. The solution was then evaporated to dryness under stirring at 90 °C. The brick-red solid was dried at 120 °C for 24 hours before calcination in air at 500 °C for 24 hours. A 5 wt% aluminous haematite support was prepared by an analogous route, except that the aqueous iron nitrate solution was added dropwise to a stirred solution of aluminium(III) nitrate nonahydrate (Sigma Aldrich) at 60 °C.The shell@core catalysts were prepared by incipient wetness impregnation of haematite.7,9 An aqueous solution of ammonium heptamolybdate tetrahydrate (Sigma Aldrich) was prepared at a concentration to deliver the desired number of molybdena monolayer equivalents at the point of incipient wetness.
Characterization
Brunauer–Emmett–Teller (BET) surface area measurements were performed under nitrogen at 77 K using the Quantachrome quadrasorb SI gas sorption system. Samples were prepared by outgassing at 250 °C for 2 hours and then backfilled with nitrogen prior to analysis. Scanning electron microscopy energy dispersive X-ray (SEM-EDX) analysis was performed using the JEOL 6610LV apparatus, with solid samples adhered to a conductive carbon tab. EDX analysis was performed using AZtec software (Oxford Instruments plc) with the elemental composition determined under ‘Point and ID’ acquisition mode. Transmission electron microscopy (TEM)-EDX and scanning transmission electron microscopy (STEM) used the JEOL JEM 2100 EM system by dispersing the sample in ethanol before transfer to a lacey carbon-coated Cu grid. Raman spectroscopy was performed using the Renishaw inVia Raman microscope with laser irradiation at 830 nm. Data acquisition was performed at 1% maximal laser power, with four accumulations, each with 10 seconds exposure time. The Rigaku Miniflex goniometer was used to obtain powder X-ray diffraction (XRD) spectra, with analyses performed under continuous scan mode using Cu Kα radiation (λ = 1.5406 Å). Rietveld refinement was performed using CelRef software. X-ray absorption fine structure (XAFS) spectra were obtained on beamline B18 at the Diamond Light Source, UK. A QEXAFS setup was used for the measurements, performed using a fast-scanning Si(311) double crystal monochromator. Samples were diluted with cellulose and pelletised prior to analysis, which comprised six scans at the Mo K edge (20![[thin space (1/6-em)]](https://www.rsc.org/images/entities/char_2009.gif) 000 eV), each of 1 minute (Kmax = 15 Å−1). In situ diffuse reflectance infrared Fourier transform spectroscopy (DRIFTS) was performed in a Harrick high temperature DRIFTS cell fitted with ZnSe windows. The cell was attached to the Praying Mantis Optics and spectra collected with an Agilent Carey 680 FTIR spectrometer, taking 64 scans with a resolution of 4 cm−1 using the DTGS detector. X-ray photoelectron spectroscopy (XPS) spectra were collected using the ESCALAB 220 spectrometer equipped with Al and Mg Kα sources. Al Kα (1486.6 eV) irradiation was used to prevent Fe Auger peaks overlapping with the Fe 2p1/2 and Fe 2p3/2 peaks.
000 eV), each of 1 minute (Kmax = 15 Å−1). In situ diffuse reflectance infrared Fourier transform spectroscopy (DRIFTS) was performed in a Harrick high temperature DRIFTS cell fitted with ZnSe windows. The cell was attached to the Praying Mantis Optics and spectra collected with an Agilent Carey 680 FTIR spectrometer, taking 64 scans with a resolution of 4 cm−1 using the DTGS detector. X-ray photoelectron spectroscopy (XPS) spectra were collected using the ESCALAB 220 spectrometer equipped with Al and Mg Kα sources. Al Kα (1486.6 eV) irradiation was used to prevent Fe Auger peaks overlapping with the Fe 2p1/2 and Fe 2p3/2 peaks.
Catalyst testing
The catalyst reactivity was studied using the CATLAB combined microreactor–mass spectrometer setup (Hiden Ltd., Warrington, UK). For the temperature-programmed desorption (TPD) analysis, injections of methanol (1 μL) were dosed on to the catalyst at 40 °C, under He (30 mL min−1), until real-time mass spectroscopic monitoring showed saturation (∼8 injections). A temperature ramp of 8 °C min−1 was applied to 400 °C, which was then sustained for 10 minutes. The temperature-programmed pulsed flow reaction (TPPFR) involved injection of methanol (1 μL) at 2 minute intervals under a flow of 10% O2/He (30 mL min−1), during which time the temperature was ramped by 8 °C min−1 to 400 °C. In all analyses, the outlet gas was continuously monitored by mass spectrometry. Mass spectroscopic data has been corrected for spectrometer-induced processes. The formaldehyde signal (mass 30) is corrected for the contributions of methanol cracking (masses 28 and 29) and oxidation to CO2 (mass 44) on the mass spectrometer filament. The CO2 signal is adjusted for methanol (mass 31) and formaldehyde combustion on the filament. The CO (mass 28) signal is corrected for methanol and formaldehyde fragmentation and oxidation, and CO2 cracking.Results and discussion
In order to establish that the doped support retained the properties of the host compound, a commercially-sourced haematite nanopowder (<50 nm particle size (BET), Sigma Aldrich) was used as a reference. Gas sorption studies revealed that there was negligible decrease in the surface area (22 m2 g−1 to 21 m2 g−1) of the commercial haematite following a typical calcination protocol. However, by introducing 5 wt% Al dopant, the post-calcination surface area was doubled, to 46 m2 g−1 (from 111 m2 g−1 as-synthesised).The nature of the aluminium incorporation in AlxFe(2−x)O3 was investigated by XPS, and this was consistent with isomorphous substitution of Al into the bulk (Fig. 1). The XPS spectrum did not indicate any preferential segregation of Al. This contrasts with ferric molybdate systems (Mo/Fe < 1.5), for which segregation is apparent by a surface Mo loading 2–3 times the theoretical bulk phase.25 In addition to the Al3+ peak at 119 eV, Fe 2p3/2 and 2p1/2 peaks at 725 eV and 711 eV, respectively, are consistent with high-spin Fe3+ of haematite. Lattice oxygen at a binding energy of 530 eV was identified.26
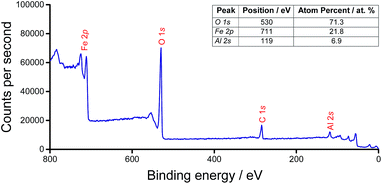 | ||
| Fig. 1 Widescan XPS spectrum of AlxFe(2−x)O3 and table, inset, of the associated surface composition. | ||
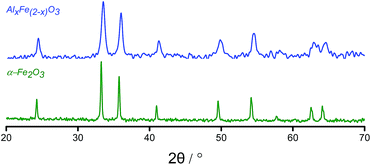
XRD analysis of AlxFe(2−x)O3 was similar to that of haematite except that the peaks for AlxFe(2−x)O3 were displaced to a higher angle than in commercial α-Fe2O3 (Fig. 2). Under Bragg's Law, this implied a reduction in the d-spacing on introducing aluminium.26
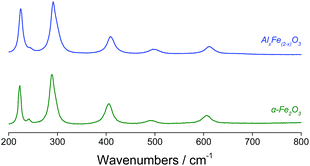
Changes in lattice parameters were quantified by Rietveld refinement in the space group R![[3 with combining macron]](https://www.rsc.org/images/entities/char_0033_0304.gif) cH (Table 1), which indicated reductions along both the a- and c-axes. Suppressed unit cell growth in aluminous haematite has been documented previously.23,27 Where α-Al2O3 and α-Fe2O3 share the corundum crystal structure, the formation of a solid solution of trivalent cations is relatively facile. In affecting isomorphous substitution of Fe3+ (r = 0.645 Å) by the smaller Al3+ ion (r = 0.535 Å),28 atomic displacement and altered electrostatic interactions introduce lattice strain. This is manifested as smaller crystallites and an enhanced surface area in Al-doped haematites.22,26 Raman spectroscopy confirmed the reduced particle dimensions of AlxFe(2−x)O3versus commercial haematite through a blue shift in the excitation bands originating from quantum confinement effects (Fig. 3).29 Additionally, where the substitution of Fe3+ with smaller Al3+ centres decreases atomic separation and concomitantly increases bond force constants, Raman bands have been shifted to a higher energy.23,30 Another consequence of the reduced grain size is peak broadening, since phonon confinement necessitates an increase in photon momentum distribution. Some loss of crystallinity on the introduction of Al (supported by a less intense XRD pattern) may have contributed to the broadened Raman bands.23,30–32
cH (Table 1), which indicated reductions along both the a- and c-axes. Suppressed unit cell growth in aluminous haematite has been documented previously.23,27 Where α-Al2O3 and α-Fe2O3 share the corundum crystal structure, the formation of a solid solution of trivalent cations is relatively facile. In affecting isomorphous substitution of Fe3+ (r = 0.645 Å) by the smaller Al3+ ion (r = 0.535 Å),28 atomic displacement and altered electrostatic interactions introduce lattice strain. This is manifested as smaller crystallites and an enhanced surface area in Al-doped haematites.22,26 Raman spectroscopy confirmed the reduced particle dimensions of AlxFe(2−x)O3versus commercial haematite through a blue shift in the excitation bands originating from quantum confinement effects (Fig. 3).29 Additionally, where the substitution of Fe3+ with smaller Al3+ centres decreases atomic separation and concomitantly increases bond force constants, Raman bands have been shifted to a higher energy.23,30 Another consequence of the reduced grain size is peak broadening, since phonon confinement necessitates an increase in photon momentum distribution. Some loss of crystallinity on the introduction of Al (supported by a less intense XRD pattern) may have contributed to the broadened Raman bands.23,30–32
![[3 with combining macron]](https://www.rsc.org/images/entities/char_0033_0304.gif) cH, and Scherrer crystallite sizes for the haematite supports
cH, and Scherrer crystallite sizes for the haematite supports
| Haematite support | BET multipoint surface area/m2 g−1 | Optimised lattice parameters/Å | Optimised cell volume/Å3 | Scherrer crystallite size/nm | E a (CO2)/kJ mol−1 | |
|---|---|---|---|---|---|---|
| a | c | |||||
| Theoretical34 | — | 5.0382 | 13.7721 | 302.7 | — | — |
| Commercial | 21 | 5.0273 | 13.7245 | 300.4 | 37 | 182 |
| AlxFe(2−x)O3 | 45 | 4.9933 | 13.6266 | 294.2 | 14 | 186 |
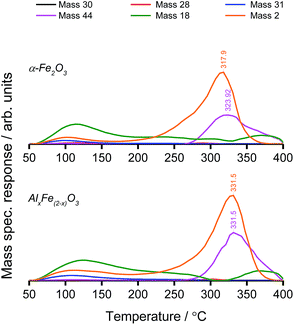
TPD analysis was used to compare the reaction profile of Al-doped haematite with that of phase-pure haematite. Mass spectrometric measurements revealed high-temperature CO2 and H2 production, which was attributed to methanol decomposition via the formate intermediate. Water was desorbed in two peaks, the first coincident with methanol (an aqueous solution), and the second high-temperature desorption was accompanied by CO2 as a product of combustion.
The combustion of methanol under oxidative conditions is typical of haematite catalysis.6 However, methanol TPD reveals a notable distinction between the behaviour of AlxFe(2−x)O3 and that of commercial haematite (Fig. 4). For the Al-doped sample, CO2 evolution is shifted to a higher temperature, which is consistent with the smaller particle size, noted previously. The decreased grain size leads to a concomitant increase in the surface free energy due to more acute curvature of the surface and a prevalence of low-coordinate sites. Where the adsorption of the bidentate formate intermediate satisfies surface valencies, mutual stabilisation yields stronger surface–adsorbate interactions that compel a larger energy input to initiate the reaction. Based on first order CO2 production,26 the Redhead equation has been used to approximate the activation energy of formate decomposition from the peak desorption temperature of CO2 (Table 1).33
Characterisation of the shell@core catalysts
The commercial haematite (ISA) and the Al-doped haematite (HSA) support materials were coated with molybdena to produce shell@core catalysts. Methanol TPD performed on the theoretical one monolayer (ML) catalysts showed high-temperature CO2 production, indicative of exposed iron clusters.8,25 Since 1 ML molybdena did not provide full surface coverage, catalysts of theoretical 3 ML coverage were studied.Relative to the haematite supports, α-MoO3 has an exceptionally low surface area (<1 m2 g−1). Whilst our own work shows that the surface area of the shell@core catalyst is diminished with increasing monolayer coverage (Table 2),9 these systems still offer a higher surface area than bulk Fe2(MoO4)3; one of their principal advantages.
| Theoretical number of MoOx-monolayers on the AlxFe(2−x)O3 support/ML | Surface area/m2 g−1 |
|---|---|
| 0 | 46 |
| 1 | 45 |
| 3 | 35 |
| 6 | 30 |
The Mo content of 3 ML systems, determined by SEM-EDX analysis, correlated with their theoretical values (Table 3). XPS analyses provided evidence of surface segregation, with Mo loading in vast excess of a theoretical bulk phase (Table 3). If XPS was completely surface-specific, the 3 ML catalysts should show the same atom percent Mo, corresponding to the MoOx surface monolayer. However, XPS does, to some extent, penetrate the surface (∼1 nm depth).6 At a higher surface area, conversion of haematite to Fe2(MoO4)3 is more extensive and hence there is a greater concentration of Mo at the surface. Electron binding energies from XPS affirmed that Al, Fe and Mo cations were in their maximum oxidation states of +3, +3 and +6, respectively.35
| Material | Surface area/m2 g−1 | SEM Mo content/wt% | XPS | ||||
|---|---|---|---|---|---|---|---|
| Theoretical | SEM-EDX | σ | Mo 3d peak position/eV | XPS Mo content/atom% | Mo content of theoretical bulk phase/atom% | ||
| α-MoO3 | 1 | 66.7 | 62.2 | 0.4 | — | — | — |
| Fe2(MoO4)3 | 3 | 48.7 | 46.1 | 0.4 | — | — | — |
| 3 ML MoOx@ISA | 15 | 3.0 | 2.8 | 0.1 | 232.065 | 5.12 | 1.1 |
| 3 ML MoOx@HSA | 35 | 7.3 | 7.6 | 0.2 | 232.743 | 5.29 | 2.0 |
The Mo surface-segregation, evidenced by XPS, is well-documented in the literature.8,9,11,36 Therefore, it is reasonable to treat Mo as being localised at the surface. On tuning the energy of the X-ray radiation to the molybdenum K-edge (20![[thin space (1/6-em)]](https://www.rsc.org/images/entities/char_2009.gif) 000 eV),37 XAFS can be used to analyse the surface structure of the shell@core catalysts.
000 eV),37 XAFS can be used to analyse the surface structure of the shell@core catalysts.
The X-ray absorption near-edge structure (XANES) region was used to establish the coordination environment of Mo in the shell@core catalysts with 1, 3 and 6 ML surface coverages on the HSA support (Table 4). Two features are assigned in the XANES spectra (Fig. 5).7,38 The first is a pre-edge peak at 20![[thin space (1/6-em)]](https://www.rsc.org/images/entities/char_2009.gif) 010 eV, attributed to the dipole-forbidden, quadrupole-allowed 1s → 4d transition. The pre-edge absorption is weak for Mo in a distorted octahedral environment (as in molybdena) but increases in intensity with tetrahedral character (as in Fe2(MoO4)3). The second feature is an intense white line at ∼20
010 eV, attributed to the dipole-forbidden, quadrupole-allowed 1s → 4d transition. The pre-edge absorption is weak for Mo in a distorted octahedral environment (as in molybdena) but increases in intensity with tetrahedral character (as in Fe2(MoO4)3). The second feature is an intense white line at ∼20![[thin space (1/6-em)]](https://www.rsc.org/images/entities/char_2009.gif) 020 eV from the dipole-allowed 1s → 5p transition, characteristic of Mo in (distorted) octahedral geometry.
020 eV from the dipole-allowed 1s → 5p transition, characteristic of Mo in (distorted) octahedral geometry.
| Theoretical molybdena coverage/ML | Proportion of Mo in octahedral geometry | Proportion of Mo in tetrahedral geometry | R-Factor |
|---|---|---|---|
| 1 | 1.000 | 0.000 | 0.0055310 |
| 3 | 0.605 | 0.395 | 0.0007580 |
| 6 | 0.275 | 0.725 | 0.0007589 |
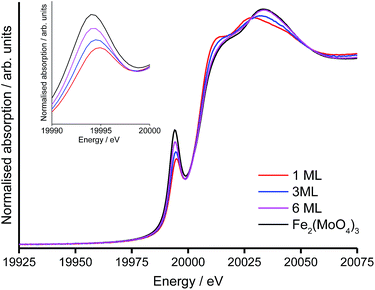 | ||
| Fig. 5 Normalised Mo-XANES for 1, 3, 6 ML MoOx@HSA catalysts, including an enlargement of the pre-edge region. | ||
The structure of the Mo-XANES is typical for a MoOx@Fe2O3 catalyst.8,9 From initial inspection, the increasing intensity of the pre-edge peak, with simultaneous diminution of the K-edge, indicates that the proportion of Mo in tetrahedral geometry increases with the level of surface doping. It is possible to quantify the proportion of octahedral and tetrahedral Mo by performing a linear combination fit (LCF), against suitable references (Table 4).
For the 1 ML catalyst, all Mo is in the (pseudo-)octahedral geometry and comprises the amorphous MoOx surface phase.9 At loadings in excess of 1 ML, an octahedral component from the MoOx monolayer remains but subsurface layers are increasingly converted to Fe2(MoO4)3. For the 3 ML and 6 ML catalysts, a tetrahedral component to Mo geometry indicates dopant levels in excess of monolayer coverage, where surplus Mo has reacted with the haematite core to form Fe2(MoO4)3.
DRIFTS analysis of the shell@core catalysts
In situ diffuse reflectance infrared Fourier transform spectroscopy (DRIFTS) was used to monitor surface-bound intermediates during TPD of methanol. In studying the surface structure and Lewis acidity of the shell@core catalysts, methanol is a particularly informative probe, revealing the catalyst behaviour under reaction conditions.39The DRIFTS study of the 3ML@ISA and 3ML@HSA catalysts is consistent with a dual adsorption pathway,40 two methanolic surface species being detected (Fig. 6). The O–H group of methanol, adsorbed non-dissociatively, is identified by stretching vibrations at 3100–3500 cm−1 and a bending mode at ∼1370 cm−1. Also, a pair of intense bands at ∼2950 and 2850 cm−1 correspond to the symmetric stretch and the first overtone of the symmetric bend of the methanol C–H bonds, respectively.40 An analogous pair of bands in the C–H region (2930 and 2830 cm−1) identifies methoxy formed by dissociative chemisorption of methanol.
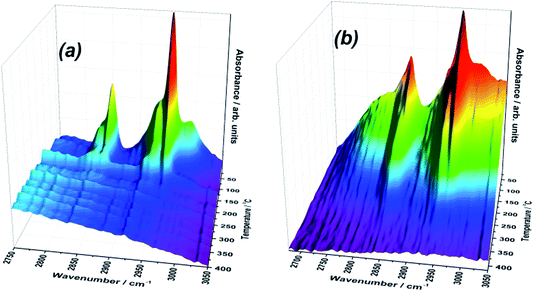 | ||
| Fig. 6 3D maps of the C–H region of the IR spectra during TPD of methanol from the (a) 3ML@ISA and (b) 3ML@HSA catalysts. | ||
The C–H region is particularly informative and combination bands possess unusual intensities due to Fermi resonance between the symmetric C–H stretch and the first overtone of the corresponding symmetric deformation.40,41 Through the C–H band position, DRIFTS can reveal surface acid–base character. Over metal oxides of strong Lewis base character, surface oxygen or adsorbed hydroxyl may abstract the alcoholic proton from adsorbed CH3OH. Thus, IR can distinguish the low frequency C–H stretch of anionic methoxide on a basic support (∼2910/2800 cm−1) from the intermediate bands of methoxy on moderately Lewis-acidic oxides (2930/2830 cm−1) and the high frequency C–H vibrations of undissociated methanol on Lewis acidic surfaces (2960/2850 cm−1).42 In the case of the 3 ML catalysts, the strong Lewis acid character, particularly of the 3ML@ISA catalyst, is revealed by the greater intensity of the C–H stretches from adsorbed methanol, relative to methoxy. Overall, the C–H bands are less resolved in 3ML@HSA, which might indicate a greater range of adsorption sites, of varying affinity, for binding the methanolic adsorbate.
Furthermore, by tracking the C–H modes between 3000 and 2750 cm−1, the reaction of surface-bound methanol can be monitored. On applying a temperature ramp, the intensity of the bands associated with surface methoxylation decline, presumably accompanying the reaction of methanol/methoxy to formaldehyde and CO, as evidenced by TPD. Whilst molecular methanol may be the dominant surface species at low temperature, associated C–H bands are lost at lower temperatures compared to those of methoxy, reflecting the stronger surface interactions of the latter.
Some distinctions can be made between the DRIFTS responses of the 3ML@ISA and 3ML@HSA materials. Firstly, bands associated with methanol and methoxy intermediates are absent at 255 °C from the ISA catalyst, whereas these bands are still detected at 315 °C for 3ML@HSA. This result supports microreactor TPD, for which formaldehyde (and CO) were stabilised on the HSA catalyst.
For the 3ML@ISA catalyst, the two sharp peaks between 3600 and 3100 cm−1 are typical for a non-bonded –OH group, but may be attributed to methanol and hydroxy species, each making consistent interactions with the surface, such that their O–H stretching frequency is well-defined and more intense. In contrast, on exposing 3ML@HSA to methanol, a broad O–H band is observed, indicating extensive intermolecular hydrogen bonding to the adsorbate. The C–H stretching region analysed by DRIFTS previously revealed (from broad C–H stretching bands) a range of binding interactions between 3ML@HSA and the methanolic adsorbate. Variations in the Lewis acid–base interactions between the surface and adsorbate may modify the O–H bond polarity and hence the strength of the hydrogen bond interactions. Since the O–H bond force constant is sensitive to modifications in the intermolecular hydrogen bonding capabilities, a broad range of O–H stretching frequencies is detected.
Temperature-programmed pulse flow reaction of methanol over bulk and shell@core catalysts
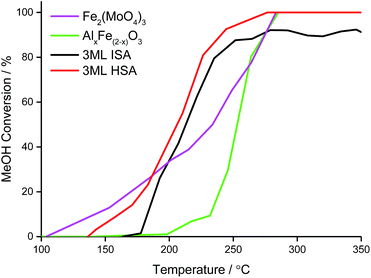
Under the temperature-programmed pulse flow reaction (TPPFR) of methanol, the bulk metal oxides show disparate activity (Fig. 7). For Fe2(MoO4)3, conversion of methanol is initiated at a relatively low temperature (∼100 °C) but only reaches 100% conversion (T100) at 284 °C. Ferric molybdate sustains 100% formaldehyde selectivity (Tsel) to 330 °C, above which temperature CO is evolved.In contrast, the Al-doped haematite operates a combustion pathway, converting methanol to CO2 (with a trivial quantity of CO at low conversion).43 The catalytic activity of the aluminous haematite is inferior to that of ferric molybdate, AlxFe(2−x)O3 achieves 50% methanol conversion (T50) at 20 °C above that for Fe2(MoO4)3, which reflects the stabilisation of surface intermediates on the HSA support.
However, when the haematite support is doped with molybdena, the reactivity of the resultant shell@core catalyst is dominated by the surface, where large energetic barriers to oxygen insertion favour formaldehyde desorption.25 Compared to the bulk phases, T50 is universally lower for the shell@core systems but decreases as the surface area, and hence access to active sites, is improved (Table 5).
| System | Surface area/m2 g−1 | T 0/°C | T 50/°C | T 100/°C | T sel/°C | Maximum formaldehyde yield/% | T max/°C |
|---|---|---|---|---|---|---|---|
| AlxFe(2−x)O3 | 46 | 173 | 253 | 285 | — | 0 | — |
| Fe2(MoO4)3 | 3 | 104 | 233 | 283 | 104–344 | 100 | 283–344 |
| 3ML@HSA | 35 | 143 | 206 | 277 | 143–245 | 94 | 244 |
| 3ML@ISA | 14 | 178 | 213 | — | 178–207 | 84 | 252 |
The TPPFR indicated that, of all the shell@core systems, a higher formaldehyde yield is attained with the 3ML@HSA catalyst and the maximum formaldehyde yield (Tmax) is also shifted to a lower temperature (Table 5). Given that, in TPD, the 3ML@HSA catalyst desorbs formaldehyde at the highest temperature of all the shell@core catalysts, the catalyst must therefore operate a high methanol conversion in the Tsel range.
Unlike the Fe2(MoO4)3 catalyst, the 3ML@HSA catalyst does not achieve 100% formaldehyde yield but between 190 and 255 °C the HSA shell@core catalyst outperforms the other systems, selectively oxidising methanol to formaldehyde with high yield. Significantly, the HSA supported molybdena catalyst achieves its maximum formaldehyde yield (94%) at Tmax ∼ 40 °C below that for the industrial bulk phase (Fig. 8).
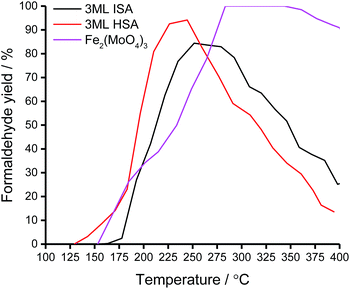 | ||
| Fig. 8 Formaldehyde yield of the bulk and shell@core iron molybdate catalysts under the TPPFR of methanol. | ||
Conclusions
A haematite support with a surface area of 46 m2 g−1 was successfully synthesised by the introduction of 5 wt% aluminium dopant. XPS analyses favoured a homogeneous distribution of Al and Fe in the haematite framework. Lattice strain induced by the isomorphous substitution of Fe3+ for the smaller Al3+ cation was found to constrain unit cell growth, particularly along the c dimension, and a reduction in particle size versus commercial haematite nanoparticles was evidenced by line broadening in the XRD and Raman spectra. Besides quantum confinement effects, the spectroscopic characteristics of AlxFe(2−x)O3 were consistent with phase-pure haematite. Moreover, TPD of methanol revealed combustion products typical of haematite catalysis. A trend towards increased activation energy of CO2 production with a higher surface area support was attributed to stabilisation of the antecedent formate intermediate on smaller particles, of higher surface free energy.In a novel preparation, AlxFe(2−x)O3 was coated with molybdena to yield a shell@core catalyst of surface area 35 m2 g−1. On confirming a Mo-rich exterior by XPS, surface analysis was performed by tuning XAFS to the Mo K-edge. All systems maintained a (pseudo)-octahedral Mo component of surface MoOx, though an increase in tetrahedral Mo at higher surface dosing was consistent with a more extensive subsurface Fe2(MoO4)3 formation. For the high surface area shell@core system, the sub-surface Fe2(MoO4)3 phase was identified by XRD, Raman and IR spectroscopies.
In the TPD of methanol, the reactivity of the shell@core catalysts was directed by the molybdena surface. Formaldehyde and CO products were consistent with the methoxy intermediate detected by DRIFTS. The TPPFR of methanol over the shell@core catalyst revealed an increase in peak formaldehyde yield with catalyst surface area, accompanied by a shift of the maximal yield to a lower temperature. Between 190 and 255 °C, the formaldehyde yield over the 3ML@HSA catalyst exceeded that of the other systems. Significantly, the 3ML@HSA catalyst reached the maximum formaldehyde yield (94%) ∼40 °C below that for the bulk phase. As such, further catalytic testing of the 3ML@HSA catalyst would focus on isothermal methanol oxidation between 190 and 255 °C to monitor formaldehyde yield over an extended reaction period. As is, the improved catalytic activity of the 3ML@HSA catalyst might be trialled for other reactions for which ferric molybdate catalysis is employed, such as propene,44,45 methane46 and toluene47 oxidation.
Acknowledgements
The UK Catalysis Hub is kindly thanked for resources and support provided via our membership of the UK Catalysis Hub Consortium and funded by EPSRC (portfolio grants EP/K014706/1, EP/K014668/1, EP/K014854/1 and EP/K014714/1). EPSRC are thanked for supporting the activities of the UK Catalysis Hub at RCaH and the grant for funding Dr P. P. Wells (Catalytic Science in the Harwell Research Centre EP/I019693/1). Diamond Light Source and the Cardiff Catalysis Institute (CCI) are acknowledged for funding the studentship of Catherine Brookes. The authors wish to acknowledge the Diamond Light Source for provision of beamtime (SP10306). The RCaH are also acknowledged for use of facilities and support of their staff. Dave Morgan of the CCI is thanked for assisting with the XPS data acquisition.References
- W. J. Linn and A. W. Sleight, J. Catal., 1976, 41, 134–139 CrossRef CAS.
- J. L. Callahan, R. K. Grasselli, E. C. Milberger and H. A. Strecker, Ind. Eng. Chem. Prod. Res. Dev., 1970, 9, 134–142 CAS.
- S. Kowatsch, Formaldehyde, Springer, Berlin Heidelberg, 2010 Search PubMed.
- G. W. Keulks, J. Catal., 1970, 19, 232–235 CrossRef CAS.
- U. Chowdhry, A. Ferretti, L. E. Firment, C. J. Machiels, F. Ohuchi, A. W. Sleight and R. H. Staley, Appl. Surf. Sci., 1984, 19, 360–372 CrossRef CAS.
- M. Bowker, R. Holroyd, A. Elliott, P. Morrall, A. Alouche, C. Entwistle and A. Toerncrona, Catal. Lett., 2002, 83, 165–176 CrossRef CAS.
- M. Bowker, C. Brookes, A. F. Carley, M. P. House, M. Kosif, G. Sankar, I. Wawata, P. P. Wells and P. Yaseneva, Phys. Chem. Chem. Phys., 2013, 15, 12056–12067 RSC.
- C. Brookes, P. P. Wells, G. Cibin, N. Dimitratos, W. Jones, D. J. Morgan and M. Bowker, ACS Catal., 2014, 4, 243–250 CrossRef CAS.
- C. Brookes, P. P. Wells, N. Dimitratos, W. Jones, E. K. Gibson, D. J. Morgan, G. Cibin, C. Nicklin, D. Mora-Fonz, D. O. Scanlon, C. R. A. Catlow and M. Bowker, J. Phys. Chem. C, 2014, 26155–26161 CAS.
- Y. Huang, L. Cong, J. Yu, P. Eloy and P. Ruiz, J. Mol. Catal. A: Chem., 2009, 302, 48–53 CrossRef CAS.
- K. Routray, W. Zhou, C. J. Kiely, W. Grünert and I. E. Wachs, J. Catal., 2010, 275, 84–98 CrossRef CAS.
- M. R. Sun-Kou, S. Mendioroz, J. L. G. Fierro, J. M. Palacios and A. Guerrero-Ruiz, J. Mater. Sci., 1995, 30, 496–503 CrossRef CAS.
- Y. Matsuoka, M. Niwa and Y. Murakami, J. Phys. Chem., 1990, 94, 1477–1482 CrossRef CAS.
- C. J. Machiels, W. H. Cheng, U. Chowdhry, W. E. Farneth, F. Hong, E. M. Mc Carron and A. W. Sleight, Appl. Catal., 1986, 25, 249–256 CrossRef CAS.
- C. Brookes, M. Bowker, E. K. Gibson, D. Gianolio, K. M. H. Mohammed, S. Parry, S. M. Rogers, I. P. Silverwood and P. P. Wells, Catal. Sci. Technol., 2016, 722–730 CAS.
- Y. Zheng, Y. Cheng, Y. Wang, F. Bao, L. Zhou, X. Wei, Y. Zhang and Q. Zheng, J. Phys. Chem. B, 2006, 110, 3093–3097 CrossRef CAS PubMed.
- K. Sivula, F. le Formal and M. Grätzel, ChemSusChem, 2011, 4, 432–449 CrossRef CAS PubMed.
- A. Khelfa, V. Sharypov, G. Finqueneisel and J. V. Weber, J. Anal. Appl. Pyrolysis, 2009, 84, 84–88 CrossRef CAS.
- G. Picasso Escobar, A. Quintilla Beroy, M. P. Pina Iritia and J. Herguido Huerta, Chem. Eng. J., 2004, 102, 107–117 CrossRef CAS.
- R. M. Cornell and U. Schwertmann, The Iron Oxides: Structure, Properties, Reactions, Occurrences and Uses, Wiley, 2006 Search PubMed.
- M. Hermanek, R. Zboril, I. Medrik, J. Pechousek and C. Gregor, J. Am. Chem. Soc., 2007, 129, 10929–10936 CrossRef CAS PubMed.
- U. Schwertmann, R. Fitzpatrick, R. Taylor and D. Lewis, Clays Clay Miner., 1979, 27, 105–112 CAS.
- A. Zoppi, C. Lofrumento, E. M. Castellucci and P. Sciau, J. Raman Spectrosc., 2008, 39, 40–46 CrossRef CAS.
- U. Schwertmann and R. M. Cornell, Iron Oxides in the Laboratory, Wiley, 2008 Search PubMed.
- M. P. House, A. F. Carley, R. Echeverria-Valda and M. Bowker, J. Phys. Chem. C, 2008, 112, 4333–4341 CAS.
- R. Li, Q. Li, S. Gao and J. K. Shang, J. Am. Ceram. Soc., 2011, 94, 584–591 CrossRef CAS.
- M. Wells, R. Gilkes and R. Anand, Clay Miner., 1989, 24, 513–530 CAS.
- R. Shannon, Acta Crystallogr., Sect. A: Cryst. Phys., Diffr., Theor. Gen. Crystallogr., 1976, 32, 751–767 CrossRef.
- L. Truffault, B. Choquenet, K. Konstantinov, T. Devers, C. Couteau and L. J. M. Coiffard, J. Nanosci. Nanotechnol., 2011, 11, 2413–2420 CrossRef CAS PubMed.
- H. Liu, T. Chen, X. Zou, C. Qing and R. L. Frost, J. Raman Spectrosc., 2013, 44, 1609–1614 CrossRef CAS.
- D. L. A. de Faria, S. Venâncio Silva and M. T. de Oliveira, J. Raman Spectrosc., 1997, 28, 873–878 CrossRef CAS.
- M. Hanesch, Geophys. J. Int., 2009, 177, 941–948 CrossRef CAS.
- P. A. Redhead, Vacuum, 1962, 12, 203–211 CrossRef CAS.
- R. L. Blake, R. E. Hessevic, T. Zoltai and L. W. Finger, Am. Mineral., 1966, 51, 123 CAS.
- A. P. V. Soares, M. F. Portela and A. Kiennemann, Catal. Rev.: Sci. Eng., 2005, 47, 125–174 CAS.
- M. P. House, M. D. Shannon and M. Bowker, Catal. Lett., 2008, 122, 210–213 CrossRef CAS.
- W. McMaster, N. K. Del Grande, J. Mallett and J. Hubbell, International Tables for Crystallography, Mathematical, Physical and Chemical Tables, Compilation of X-Ray cross sections, Section III, Springer Science & Business Media, 1969 Search PubMed.
- A. M. Beale, S. D. M. Jacques, E. Sacaliuc-Parvalescu, M. G. O'Brien, P. Barnes and B. M. Weckhuysen, Appl. Catal., A, 2009, 363, 143–152 CrossRef CAS.
- A. M. Turek, I. E. Wachs and E. DeCanio, J. Phys. Chem., 1992, 96, 5000–5007 CrossRef CAS.
- L. J. Burcham, L. E. Briand and I. E. Wachs, Langmuir, 2001, 17, 6164–6174 CrossRef CAS.
- G. Busca, Catal. Today, 1996, 27, 457–496 CrossRef CAS.
- L. J. Burcham, L. E. Briand and I. E. Wachs, Langmuir, 2001, 17, 6175–6184 CrossRef CAS.
- M. P. House, Selective oxidation of methanol over iron molybdate catalysts, PhD Thesis, Cardiff University, 2007 Search PubMed.
- K. Manseri, H. Hentit, E. H. Elandaloussi, B. Benaichouba and M. S. Ouali, Hyperfine Interact., 2010, 198, 243–257 CrossRef CAS.
- B. Benaichouba, P. Bussiere and J. C. Vedrine, Appl. Catal., A, 1995, 130, 31–45 CrossRef CAS.
- A. S. Chellappa and D. S. Viswanath, Ind. Eng. Chem. Res., 1995, 34, 1933–1940 CrossRef CAS.
- K. L. Madhok and K. P. Srivastava, Proc. - Indian Acad. Sci., Chem. Sci., 1981, 90, 527–535 CAS.
| This journal is © The Royal Society of Chemistry 2016 |

