Engineering a membrane based air cathode for microbial fuel cells via hot pressing and using multi-catalyst layer stacking†
Wulin
Yang
and
Bruce E.
Logan
*
Department of Civil and Environmental Engineering, The Pennsylvania State University, 212 Sackett Building, University Park, Pennsylvania 16802, USA. E-mail: blogan@psu.edu; Fax: +1 814 863 7304; Tel: +1 814 863 7908
First published on 20th June 2016
Abstract
Microbial fuel cell (MFC) cathodes must have high performance and be resistant to water leakage. Hydrophobic poly(vinylidene fluoride) (PVDF) membranes have shown great advantages in providing a waterproof diffusion layer for MFCs and reducing the cathode costs. However, previous approaches have lacked a method to integrate the diffusion layer into the cathode structure. Here, a hot pressing was used to bind the PVDF diffusion layer onto the air side of the activated carbon cathode, and additional catalyst layers were added to improve performance. Cathodes pressed at 60 °C produced a 16% higher maximum power density of 1630 ± 10 mW m−2 than non-pressed controls (1400 ± 7 mW m−2). Cathode performance was further increased to 1850 ± 90 mW m−2 by catalyst stacking, through the addition of an extra catalyst layer (CL), which better utilized the available surface area of the stainless steel mesh (SS) current collector. The use of one stainless steel current collector and two catalyst layers (SS/2CLs) produced more positive cathode potentials compared to other designs (SS/CL or 2SS/2CL). Low material costs and high power production for MFCs using these cathodes could enable more cost effective power production using MFCs.
Water impactA microbial fuel cell is a sustainable technology that can simultaneously treat wastewater and harvest electricity, but wide applications are still limited by complex and expensive cathode fabrication methods. Here, a simple and inexpensive hot pressing method was used, and an extra catalyst layer was added to further increase cathode performance. |
1. Introduction
Microbial fuel cells (MFCs) are devices that convert organic substrates into electricity using exoelectrogenic bacteria.1–5 Electrons are released to the anode through degradation of organics and transferred to the cathode, where oxygen reduction is used to generate power. Low-cost cathodes with high catalytic performance are critical for applications of MFCs for wastewater treatment and electricity production.6–12 Previous studies have concluded that cathode materials need to cost less than $100 m−2 to make MFCs an economically viable method of power generation, at production scales of hundreds or more square meters for pilot scale reactors.13 Activated carbon (AC) is often used as an oxygen reduction catalyst, due to its low cost ($1.4 kg−1), in air cathode-type MFCs to avoid the need to provide oxygen to the cathode by energy intensive water aeration.6,14–16 However, fabrication of AC cathodes for commercial applications is still hindered by the difficulty of producing square meter-sized cathodes in large quantities.One of the main obstacles for scaling up AC cathodes is integrating a diffusion layer (DL) that is both oxygen permeable and waterproof into the cathode structure. It was recently shown that the use of a hydrophobic poly(vinylidene fluoride) (PVDF) membrane as external DL could provide these qualities, as cathodes withstood up to 2 m of water pressure, and they had oxygen permeabilities comparable to existing PDMS (polydimethylsiloxane) cloth diffusion layers, enabling good catalytic performance.17 However, the AC catalyst layer (CL) fabrication required an organic solvent (dimethylacetamide) that dissolved the PVDF membrane DL, therefore the PVDF membrane was placed on top of the CL but not bonded to it.14 That non-bonded configuration could result in water accumulation retention between catalyst and DL layer, which would adversely impact cathode performance by reducing oxygen permeability.18 Previous studies showed that water accumulation on the other side of the cathode, between the catalyst layer and a separator (on the water side), adversely affected cathode performance.19 Therefore, physical integration of PVDF membrane DL into cathode structure is critical for stable performance of a membrane-based DL on the cathode, and an alternative binder or procedure is needed that does not require dimethylacetamide.
Another factor in cathode construction is the AC catalyst loading.14 It was previously shown that increasing the AC catalyst loading from 27 to 62 mg cm−2 did not appreciably impact the cathode performance.20 However, the additional AC was only on one side of the current collector. This approach could have increased electrical resistance of the most distant catalyst as activated carbon is not highly electrically conductive, and so this single-sided cathode approach might have negated any advantage of the additional catalyst.
In this study, new cathode construction methods were developed to improve cathode performance while keeping the cost of making the cathodes low. In order to better integrate the DL into the cathode, a hot pressing method was examined at 60 and 120 °C, and compared to pressing at room temperature (25 °C), to physically integrate the DL (PVDF membrane) into the air side of the cathode. We further hypothesized that cathode performance could be improved by adding additional catalyst material if better electrical connections were made between the added catalyst and the current collector. Therefore, we tested adding an additional catalyst layer onto the other (water) side of the cathode, as well as adding a second current collector onto the water side. These additional cathode layers, referred to a multi-layer stacked cathodes, were tested for their performance in both abiotic and biotic (MFC) conditions.
2. Materials and methods
2.1. Cathode fabrication
The CL was prepared by dispersing AC (Norit SX plus, Norit Americas Inc., TX) in ethanol and stirring at 60 °C on a hot plate as previously described.21 Ethanol was used to facilitate the fabrication process as ethanol evaporates faster than water. A 60% PTFE emulsion (Sigma Aldrich, USA) was added dropwise at a mass ratio of AC![[thin space (1/6-em)]](https://www.rsc.org/images/entities/char_2009.gif) :
:![[thin space (1/6-em)]](https://www.rsc.org/images/entities/char_2009.gif) PTFE (6
PTFE (6![[thin space (1/6-em)]](https://www.rsc.org/images/entities/char_2009.gif) :
:![[thin space (1/6-em)]](https://www.rsc.org/images/entities/char_2009.gif) 1). The mixture was stirred until most ethanol evaporated to form a wet gel. The AC/PTFE gel was then pressed to expand under 1 × 10⁷ Pa for 2 s at 25, 60 or 120 °C (Model 4388, CARVER, INC., USA), and then re-folded and re-pressed two more times (Fig. S1†). The resulting CL had a thickness of 780 ± 60 μm, corresponding to an AC loading of 27 ± 1 mg cm−2. The CL was placed between stainless steel (SS) mesh (42 × 42, type 304, McMaster-Carr, USA) and hydrophobic PVDF membrane DL (0.45 μm, MILLIPORE, USA) and rinsed with ethanol. The sandwiched SS/CL/DL cathode was then pressed under 3 × 10⁷ Pa for at least 15 s at 60 °C until the membrane surface became dry (Fig. 1A). The pressed cathodes were then taken out and dried in a fume hood for later use. Multi-layer (stacked) AC cathodes were fabricated in three different configurations: using one SS current collector and two CLs (SS/2CL); two SS current collectors and two CLs (2SS/2CL) (Fig. 1B and C).
1). The mixture was stirred until most ethanol evaporated to form a wet gel. The AC/PTFE gel was then pressed to expand under 1 × 10⁷ Pa for 2 s at 25, 60 or 120 °C (Model 4388, CARVER, INC., USA), and then re-folded and re-pressed two more times (Fig. S1†). The resulting CL had a thickness of 780 ± 60 μm, corresponding to an AC loading of 27 ± 1 mg cm−2. The CL was placed between stainless steel (SS) mesh (42 × 42, type 304, McMaster-Carr, USA) and hydrophobic PVDF membrane DL (0.45 μm, MILLIPORE, USA) and rinsed with ethanol. The sandwiched SS/CL/DL cathode was then pressed under 3 × 10⁷ Pa for at least 15 s at 60 °C until the membrane surface became dry (Fig. 1A). The pressed cathodes were then taken out and dried in a fume hood for later use. Multi-layer (stacked) AC cathodes were fabricated in three different configurations: using one SS current collector and two CLs (SS/2CL); two SS current collectors and two CLs (2SS/2CL) (Fig. 1B and C).
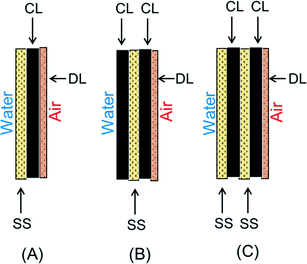 | ||
| Fig. 1 Cathode configurations: (A) SS/CL (B) SS/2CL (C) 2SS/2CL (SS: stainless steel mesh; CL: catalyst layer; DL: diffusion layer). | ||
2.2. Cathode performance characterization
Step current tests were conducted using two-chamber, electrochemical cells assembled by bolting together two cubes (2 cm wide) containing 3 cm diameter cylindrical chambers, separated by an anion exchange membrane (AEM; AMI-7001, Membrane International Inc., USA). The counter electrode was a 7 cm2 diameter platinum plate. An Ag/AgCl reference electrode (RE-5B, BASi, West Lafayette, IN; +0.209 V vs. a standard hydrogen electrode, SHE) was placed in the cathode chamber close to the electrode. All potentials reported here were corrected to SHE. Electrochemical measurements were conducted with a multichannel potentiostat (VMP3 Workstation, Biologic Science Instruments, USA) in a constant temperature room at 30 °C. The lower currents (1 mA, 2 mA, 3 mA and 4 mA) were applied for 1 h and the higher currents (5 mA, 6 mA, 7 mA, 8 mA, 9 mA and 10 mA) were applied for 30 min to achieve steady-state conditions, as previously described.17 Impedance measurements of cathodes were conducted at 0.1 V vs. SHE over a frequency range of 100 kHz to 100 mHz with a sinusoidal perturbation of 14.2 mV amplitude. All electrochemical tests were conducted in 50 mM phosphate buffer solution (PBS; Na2HPO4, 4.58 g L−1; NaH2PO4·H2O, 2.45 g L−1; NH4Cl, 0.31 g L−1; KCl, 0.31 g L−1; pH = 6.9; conductivity of κ = 6.9 mS cm−1).Single cycle polarization tests of AC cathodes were conducted by varying the external resistance from 1000 to 20 Ω at 20 min intervals in cubic single-chamber MFCs (except as noted) constructed from a single Lexan block 4 cm in length, with an inner chamber diameter of 3 cm, as previously described.22 The cathodes were operated in MFCs for three cycles before the polarization test at 1000 Ω. The anodes were graphite fiber brushes (2.5 cm in both diameter and length, heat treated at 450 °C in air for 30 min) placed horizontally in the center of the MFC chambers.22 Anodes were acclimated by operation for over one year in previous MFCs at a constant temperature (30 °C), with a fixed external resistance (1000 Ω). The medium contained 1 g L−1 sodium acetate dissolved in 50 mM PBS amended with 12.5 mL L−1 minerals and 5 mL L−1 vitamins.14
2.3. Physical characterization
The surface areas of cathode CLs pressed at different temperatures were determined from nitrogen adsorption isotherms (at 77.3 K) by progressively increasing relative pressures of 5 × 10⁻⁶ to 0.99 atm atm−1 (ASAP 2420, Micromeritics Instrument Corp., GA). All samples were degassed at 100 °C for 16 h prior to measurements. The Brunauer–Emmet–Teller (BET) specific surface area was evaluated using adsorption data in a relative pressure range between 5 × 10⁻⁶ to 0.2 atm atm−1.The morphologies of the PVDF membrane DLs pressed at different temperatures were examined using scanning electron microscopy (SEM; FEI model XL30, tungsten filament, 5 keV electron beam). The membranes were sputter coated with gold particles before SEM imaging.
Oxygen transport through the cathode was calculated in terms of an oxygen mass transfer coefficient (k, cm s−1) based on the change in the dissolved oxygen (DO) concentration in a 4 cm long single-chamber reactor as previously described (duplicate measurements).23 Dissolved oxygen (DO) concentrations were measured using a non-consumptive DO probe (Foxy-18G, Ocean Optics Inc., USA).
3. Results and discussion
3.1. Effect of pressing temperature on cathode performance
The maximum power density of the AC cathode pressed at 60 °C was 1630 ± 10 mW m−2, which was similar to that obtained at 25 °C (1620 ± 70 mW m−2) (Fig. 2). However, the DL membrane on the cathode pressed at 25 °C did not tightly bind to the surface of the cathode, likely because too much of the ethanol solvent was retained on the cathode surface during the pressing process due to a low evaporation rate at this temperature. The highest maximum power density of 1840 ± 90 mW m−2 was achieved with the cathode pressed at 120 °C. Cathodes pressed under 25, 60 and 120 °C all produced higher maximum power densities than those previously reported for non-pressed cathodes containing the same DL (1400 ± 7 mW m−2).17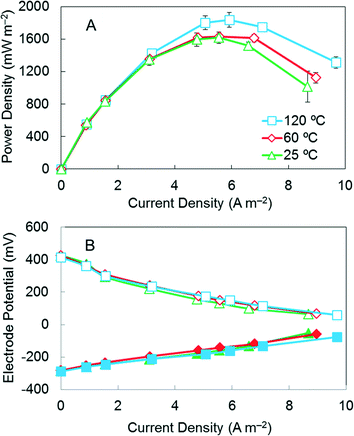 | ||
| Fig. 2 (A) Power density curves for AC cathodes pressed at 25, 60 and 120 °C. (B) Electrode potentials (solid symbols, anode potentials; open symbols, cathode potentials). | ||
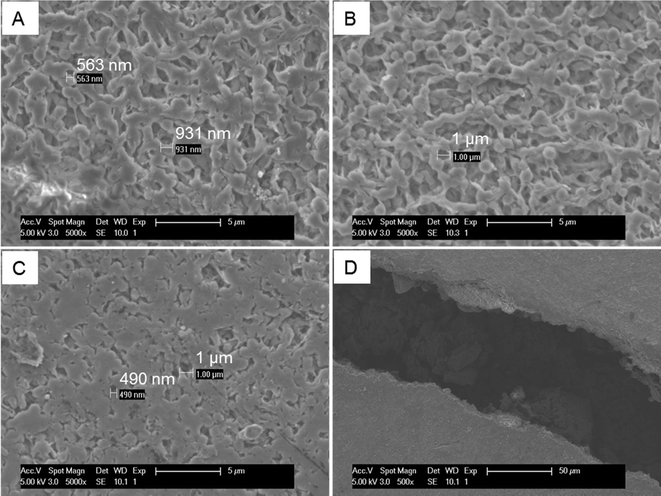
Increasing the pressing temperature had minimal impact on the CLs but impacted the morphology of the DLs. The BET surface area of the CLs pressed at different temperatures remained similar at 787 m2 g−1 (25 °C), 791 m2 g−1 (60 °C) and 781 (120 °C) m2 g−1, suggesting no porosity change in the CLs (Fig. S2†). However, the higher pressing temperature of 120 °C led to a much denser membrane surface compared to membranes pressed at 25 and 60 °C (Fig. 3A–C), and some cracks were observed on the membrane pressed at 120 °C (Fig. 3D). Therefore, a higher oxygen mass transfer coefficient of 3.0 ± 0.3 × 10⁻³ cm s−1 was achieved for membranes pressed at 120 °C even though the membrane surface was denser. The mass transfer coefficients for the other two membranes were 2.6 ± 0.2 × 10⁻³ cm s−1 (25 °C) and 2.5 ± 0.1 × 10⁻³ cm s−1 (60 °C) (Table S1†). The occurrence of cracks on membranes when pressed at 120 °C also suggested that pressing at 60 °C was better in terms of maintaining membrane surface morphology. To minimize energy consumption for producing cathodes, and avoid the occurrence of cracks in the membrane, a pressing temperature of 60 °C was selected for additional AC catalyst tests.
3.2. Multi-layer stacked cathode performance
To further optimize the membrane based AC cathode, a multi-layer stacking cathode structure was tested for making cathodes (Fig. 1). The reactors with the AC cathode containing one SS current collector and two CLs (SS/2CL) produced the highest maximum power density of 1850 ± 90 mW m−2 (Fig. 4). MFCs with other cathodes produced 13% lower maximum power densities, with 1630 ± 10 mW m−2 for the single (SS/CL) cathode structure, and 1640 ± 30 mW m−2 for the double (2SS/2CL) cathode structure (Fig. 4).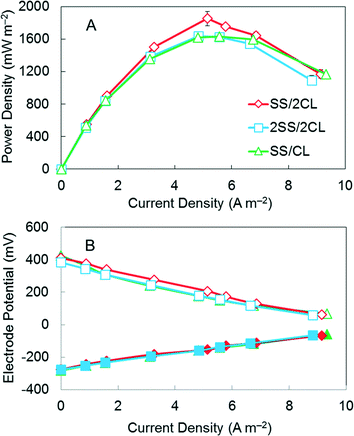 | ||
| Fig. 4 (A) Power density curves for AC cathodes with SS/CL, SS/2CL and 2SS/2CL. (B) Electrode potentials (solid symbols, anode potentials; open symbols, cathode potentials). | ||
More positive electrode potentials were obtained in abiotic electrochemical tests with the SS/2CL cathode, compared to the SS/CL or 2SS/2CL cathodes, at current densities up to 10 A m−2 (Fig. 5A), a current range typical for MFCs.6,8 At a current density of 6 A m−2 where the maximum power density was achieved (see below), the potential for the SS/2CL cathode was 150 mV, which was 25% higher than that obtained for both of the other cathodes (120 mV; SS/CL and 2SS/2CL) (Fig. 5A).
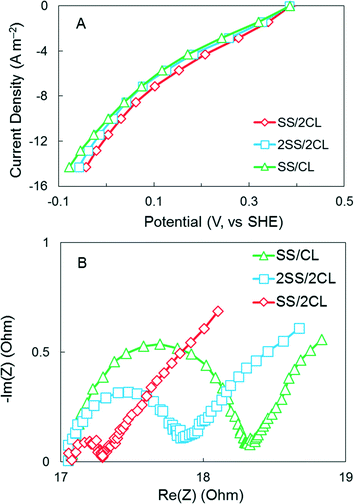 | ||
| Fig. 5 (A) Current–voltage (polarization) curves (B) EIS spectra for the AC cathodes with SS/CL, SS/2CL and 2SS/2CL in an abiotic electrochemical cell. | ||
The EIS spectra showed that the SS/2CL cathode had a smaller arc and a charge transfer resistance of 0.3 Ω, which was 88% lower than 2.4 Ω for the SS/CL cathode (Fig. 5B). Although the 2SS/2CL cathode had the lowest charge transfer resistance of 1.2 Ω it did not significantly boost cathode performance (Fig. 5B).
Taken together, these results demonstrated that the SS/2CL cathode performed better in electrochemical tests than the other two cathodes. Although the 2SS/2CL cathode had the same AC loading as the SS/2CL cathode, the increase in the total catalyst was not as effective when the additional catalyst was covered on two sides by the SS mesh. Part of the reason for the decrease in performance could be that ion transport (protons or hydroxide ions in water) or oxygen transfer to the catalyst was hindered in the 2SS configuration. It has been previously shown using different sized SS mesh that power increases as the SS mesh becomes more porous (less blocked area per cathode).24 Thus, the SS/2CL could produce more power as the second, water-facing catalyst was completely exposed to the water, whereas the 2SS/2CL had some of the additional catalyst area blocked by the additional SS layer. However, the additional catalyst was a key factor in improved performance, as similar cathode performance was obtained with the single CL cathode (SS/CL) when the catalyst layer placed either at the solution side or air side, indicating that the CL position relative to the water phase was not the only factor affecting the performance (Fig. S3†). Thus, the additional catalyst and its loading onto the single current collector were both important for improving power. A previous study had found that increasing AC loading did not improve cathode performance.20 However, the better electrochemical performance with SS/2CL cathode, indicated that increasing the AC loading could increase cathode performance as long as the additional catalyst was added on the other side of the SS current collector.
3.3. Energy cost projections for MFCs
Due to the low cost of AC catalyst, adding a second CL to the cathode did not appreciably increase the material costs of the cathode. The materials cost of the SS/2CL is estimated to be $16.5 m−2, which was only $1.4 m−2 more compared to the original $15.1 m−2 for the SS/CL cathode (Table 1). The unit power production, which is the power produced (mW m−2) divided by the cost of the cathode materials ($ m−2), has been used to evaluate the economics of power production using MFCs.17 The unit power production for the SS/2CL cathode was 112 mW $−1, which is quite similar to that for the SS/CL cathode of 108 mW $−1. Adding an extra SS currently collector substantially decreased the unit power production to 58 mW $−1 and thus was not considered to be economically viable (Table 1). The unit power production of 112 mW $−1 for the optimized SS/2CL cathode was also higher than 54 mW $−1 for an established rolling AC cathode, indicating a reduced materials cost by using the SS/2CL cathode.14 To evaluate the overall cost of MFCs, cathode lifetime was estimated to be 5 years, and the cathode materials were estimated to be 50% of the overall MFC cost based on a previous study.25 Using these values, the overall MFC cost normalized for 5 years is $21 m−2, which is below the target of $100 m−2 estimated in previous studies.13,25,26| Cathode configuration | Cathode cost ($ m−2) | mW m−2 | mW $−1 |
|---|---|---|---|
| SS/CL | 15.1 | 1630 | 108 |
| SS/2CL | 16.5 | 1850 | 112 |
| 2SS/2CL | 28.5 | 1640 | 58 |
| Rolling (SS/CL)14 | 25 | 1360 | 54 |
4. Conclusions
A hot pressing method of AC cathode fabrication was examined to integrate a hydrophobic PVDF membrane as the DL into the cathode structure, producing a maximum power density of 1630 ± 10 mW m−2 at a pressing temperature of 60 °C. Cathode performance was further increased by adding an extra CL onto the other side of the SS current collector, producing a maximum power density of 1850 ± 90 mW m−2, which was 13% greater than that obtained without additional catalyst. The adoption of this new AC cathode procedure could enable more cost effective power production using MFCs.Acknowledgements
This research was supported by the Strategic Environmental Research and Development Program (SERDP) and a graduate scholarship from the China Scholarship Council (CSC) to W. Y.References
- B. E. Logan, Microbial fuel cells, John Wiley & Sons, Inc., Hoboken, NJ, 2008 Search PubMed.
- J. Niessen, U. Schröder and F. Scholz, Electrochem. Commun., 2004, 6, 955–958 CrossRef CAS.
- R. M. Allen and H. P. Bennetto, Appl. Biochem. Biotechnol., 1993, 39, 27–40 CrossRef.
- B. Xu, Z. Ge and Z. He, Environ. Sci.: Water Res. Technol., 2015, 1, 279–284 Search PubMed.
- D. R. Lovley, Nat. Rev. Microbiol., 2006, 4, 497–508 CrossRef CAS PubMed.
- S. Cheng and J. Wu, Bioelectrochemistry, 2013, 92, 22–26 CrossRef CAS PubMed.
- H. Dong, H. Yu and X. Wang, Environ. Sci. Technol., 2012, 46, 13009–13015 CrossRef CAS PubMed.
- X. Wang, C. J. Feng, N. Ding, Q. R. Zhang, N. Li, X. J. Li, Y. Y. Zhang and Q. X. Zhou, Environ. Sci. Technol., 2014, 48, 4191–4198 CrossRef CAS PubMed.
- D. Li, Y. Qu, J. Liu, W. He, H. Wang and Y. Feng, J. Power Sources, 2014, 272, 909–914 CrossRef CAS.
- W. He, X. Zhang, J. Liu, X. Zhu, Y. Feng and B. E. Logan, Environ. Sci.: Water Res. Technol., 2016, 2, 186–195 Search PubMed.
- Z. Ge and Z. He, Environ. Sci.: Water Res. Technol., 2016, 2, 274–281 Search PubMed.
- C. Forrestal, A. Haeger, L. Dankovich, T. Y. Cath and Z. J. Ren, Environ. Sci.: Water Res. Technol., 2016, 2, 353–361 Search PubMed.
- B. E. Logan, M. J. Wallack, K.-Y. Kim, W. He, Y. Feng and P. E. Saikaly, Environ. Sci. Technol. Lett., 2015, 2, 206–214 CrossRef CAS.
- W. Yang, W. He, F. Zhang, M. A. Hickner and B. E. Logan, Environ. Sci. Technol. Lett., 2014, 1, 416–420 CrossRef CAS.
- A. Janicek, Y. Fan and H. Liu, J. Power Sources, 2015, 280, 159–165 CrossRef CAS.
- W. Yang, F. Zhang, W. He, J. Liu, M. A. Hickner and B. E. Logan, J. Power Sources, 2014, 269, 379–384 CrossRef CAS.
- W. Yang, K.-Y. Kim and B. E. Logan, Bioresour. Technol., 2015, 197, 318–322 CrossRef CAS PubMed.
- F. Zhang, D. Pant and B. E. Logan, Biosens. Bioelectron., 2011, 30, 49–55 CAS.
- X. Zhang, S. Cheng, X. Wang, X. Huang and B. E. Logan, Environ. Sci. Technol., 2009, 43, 8456–8461 CrossRef CAS PubMed.
- B. Wei, J. C. Tokash, G. Chen, M. A. Hickner and B. E. Logan, RSC Adv., 2012, 2, 12751–12758 RSC.
- H. Dong, H. Yu, X. Wang, Q. Zhou and J. Feng, Water Res., 2012, 46, 5777–5787 CrossRef CAS PubMed.
- B. E. Logan, S. Cheng, V. Watson and G. Estadt, Environ. Sci. Technol., 2007, 41, 3341–3346 CrossRef CAS PubMed.
- S. Cheng, H. Liu and B. E. Logan, Electrochem. Commun., 2006, 8, 489–494 CrossRef CAS.
- F. Zhang, M. D. Merrill, J. C. Tokash, T. Saito, S. Cheng, M. A. Hickner and B. E. Logan, J. Power Sources, 2011, 196, 1097–1102 CrossRef CAS.
- R. A. Rozendal, H. V. M. Hamelers, K. Rabaey, J. Keller and C. J. N. Buisman, Trends Biotechnol., 2008, 26, 450–459 CrossRef CAS PubMed.
- T. H. J. A. Sleutels, A. Ter Heijne, C. J. N. Buisman and H. V. M. Hamelers, ChemSusChem, 2012, 5, 1012–1019 CrossRef CAS PubMed.
Footnote |
| † Electronic supplementary information (ESI) available: Two figures and one table are provided. Supplementary data related to this article can be found online for free. See DOI: 10.1039/c6ew00098c |
| This journal is © The Royal Society of Chemistry 2016 |

