On-line monitoring of organic matter concentrations and character in drinking water treatment systems using fluorescence spectroscopy†
Y.
Shutova
ad,
A.
Baker
b,
J.
Bridgeman
c and
R. K.
Henderson
*d
aUNSW Water Research Centre, UNSW, Sydney, NSW 2052, Australia
bConnected Waters Initiative Research Centre, UNSW, Sydney, NSW 2052, Australia
cSchool of Civil Engineering, University of Birmingham, Birmingham, UK
dbioMASS lab, School of Chemical Engineering, UNSW, Sydney, NSW 2052, Australia. E-mail: r.henderson@unsw.edu.au
First published on 9th June 2016
Abstract
There is a need for a rapid and robust method of organic matter (OM) monitoring during drinking water treatment. Although it has been shown that fluorescence spectroscopy has the potential for on-line application in drinking water treatment plants, there has been no in situ OM fluorescence monitoring study conducted during drinking water treatment. Three currently available fluorescence probes were chosen for the on-line study of terrestrially-delivered unprocessed (Peak C) and microbially-delivered (Peak T) OM. Probes were installed at two drinking water treatment plants (WTPs) measuring raw water and treated water fluorescence over one month. Probe and sampling point specific temperature correction and inner filter effect correction factors were applied to all fluorescence data. The Peak C fluorescence intensity had a significant correlation with dissolved organic carbon (DOC) concentration (Rs = 0.85–0.93) and it was therefore concluded that it could be used to monitor DOC concentrations in raw and treated water. Peak C and Peak T fluorescence signal changes corresponded to water quality fluctuations and operational conditions enabling OM to be characterised. It was demonstrated that fluorescence probes can be used for monitoring OM concentrations and character in situ and in real-time.
Water impactThis paper presents the first in situ organic matter fluorescence monitoring study conducted in a drinking water treatment context. It was determined that fluorescence probes could be used to estimate organic matter concentration, removal efficiency and treatability across unit operations. The probes were sufficiently sensitive to identify small changes in operating conditions, providing early warning to operators. |
Introduction
A simple, reproducible method for organic matter (OM) characterisation and quantification is required to monitor OM changes during drinking water treatment.1,2 Most of the OM characterisation techniques (such as resin fractionation, filtration, size exclusion chromatography (SEC), Fourier transform infrared spectrometry (FTIR), nuclear magnetic resonance (NMR), liquid chromatography-mass spectrometry (LC-MS), gas chromatography-mass spectrometry (GC-MS) etc.) that give valuable information about OM character (including hydrophobicity, molecular weight, structure, and composition) require laboratory instrumentation, sample preparation and time for sample analysis and data processing.1 There are also limitations of these OM characterisation techniques associated with sample preparation and analytical procedure. For example, OM can be affected during resin fractionation due to the extreme pH levels and pH changes during fractionation, irreversible adsorption of OM compounds to the resin, contamination from resin, and size exclusion effects, while filtration fractionation results may be affected by membrane pore fouling. The interpretation of SEC, FTIR, NMR, LC-MS, GC-MS and similar data is difficult due to OM complexity and requires trained personnel. Thus, these methods have limited potential for on-line monitoring in water treatment systems. In contrast, total organic carbon (TOC) analysis is useful for the quantitation of OM concentration and can be performed on-line.3 However, TOC gives no information about OM character. UV absorbance at 254 nm has been used previously as a surrogate measurement of DOC concentrations; however, most of the correlations have been found to be sample specific.3–6 S::CAN UV monitoring systems can be used on-line, however UV spectra require comprehensive data analysis.7 Recently, it was demonstrated that OM removal identified using fluorescence spectroscopy at the maximum intensity value in the region 300–360 nm excitation and 400–480 nm emission (Peak C) had a stronger correlation with DOC removal (R2 = 0.91) than UV absorbance at 254 nm (R2 = 0.69).8 Overall, fluorescence spectroscopy provides rapid and non-invasive analysis of aquatic OM samples, with the potential for online monitoring of OM reactivity and treatability, removal and changes during drinking water treatment.9On-line single wavelength ‘Peak C’ (λex/λem = 370/460 nm) fluorescence probes have previously been used as a surrogate measurement of dissolved and particulate organic carbon concentrations.10,11 Goldman et al. found this to be a useful way of tracking seasonal variability of OM concentrations and character.11 In other studies, a good correlation between a portable LED spectrophotometer measuring ‘Peak T’ (λex/λem = 280/360 nm) fluorescence intensity and total coliforms, E.coli, heterotrophic bacteria and thermotolerant coliforms has also been observed.10–13 This indicates that fluorescence spectroscopy can be used to assess drinking water contamination in the areas of poor sanitation that are subject to faecal contamination, where infrastructure failure has occurred in the supply of clean drinking water. This also agreed with earlier research by Baker et al.,14 where a portable fluorescence spectrometer that measured Peak T fluorescence was used to investigate increasing anthropogenic OM inputs from sewage and farm wastes in rivers. Carstea et al. conducted a real-time fluorescence EEM monitoring study of surface water using an in situ fibre-optic probe, showing that OM changes correlated with rainfall events as well as with increased anthropogenic pollution during a diesel spill event.15 However, although research has highlighted the potential of on-line application of fluorescence spectroscopy for drinking water treatment plants,16–18 to date there has been no in situ study conducted on OM changes at a drinking water treatment.
In a previous study investigating OM changes in five water treatment plants, it was possible to identify four common fluorescent OM fractions by applying parallel factor analysis (PARAFAC).8 These four components were representative of terrestrially- and microbially-delivered OM components (Peak C and Peak T, respectively) and were used to identify potential on-line monitoring wavelength pairs: P1 (λex/λem = 380/488 nm), P2 (λex/λem = 310/392 nm), P3 (λex/λem = 240/440 nm) and P4 (λex/λem = 280/328 nm). Hence, the aim of the study was to determine an OM monitoring protocol for application at water treatment plants using commercially available probes that measure fluorescence at spectral locations as close to the four wavelength pairs identified as possible. The main objectives were to determine whether the probes could be used to (1) monitor OM concentrations, (2) determine source water and treated water OM character, and (3) enable treatment process optimisation. Two OM fluorescence probes were selected for point P1 and one for P4. There was no fluorescence probe available that could measure fluorescence in wavelength range for P2 (λex/λem = 310/392 nm) and, while there is a fluorescence probe available that measures fluorescence intensity at point P3,19,20 it was not selected for the study since C1![[thin space (1/6-em)]](https://www.rsc.org/images/entities/char_2009.gif) :
:![[thin space (1/6-em)]](https://www.rsc.org/images/entities/char_2009.gif) C3 had the weakest correlation with DOC removal.8 The monitoring protocol developed was applied to two water treatment plants with contrasting water treatment techniques and contrasting water quality.
C3 had the weakest correlation with DOC removal.8 The monitoring protocol developed was applied to two water treatment plants with contrasting water treatment techniques and contrasting water quality.
Materials and method
Site description
Two sites of contrasting water quality were chosen for the on-line monitoring study in order to maximise potential fluorescence variability due to location, catchment type and treatment process applied. These were Capalaba WTP (Queensland) and Yarra Glen WTP (Victoria) which have been described in detail in Shutova et al.8 Briefly, Capalaba WTP sourced water from a reservoir with an urbanised catchment and is therefore vulnerable to contamination. Yarra Glen WTP receives its raw water supply via an aqueduct from a reservoir within a catchment completely closed to human activities. The Capalaba WTP process train is coagulation, flocculation, clarification via sedimentation, sand filtration and chlorination treatment. Yarra Glen WTP utilises coagulation–membrane filtration followed by a chlorination disinfection stage. The contrasting catchments and climate resulted in almost a four times higher concentration of DOC in the Capalaba WTP raw water than in Yarra Glen WTP raw water (Table S1†). Due to the lower OM concentration in the source water, and a highly efficient water treatment procedure, typically Yarra Glen WTP had a higher OM removal and lower residual DOC in comparison to Capalaba WTP.Two monitoring points were identified at each site: (1) raw water of both WTPs; (2) partially-treated water post-sedimentation (Capalaba WTP) and after coagulation–membrane filtration but prior to sand filtration or chlorination stages (Yarra Glen WTP). The second sampling point was chosen on the basis that sedimentation and coagulation–membrane filtration had the highest DOC removal in comparison with other treatment techniques,8 while the sand filter did not reduce OM concentrations. Furthermore, these processes can be operationally controlled through parameters such as coagulant dose and water flow, and therefore there is a potential that they can be optimised in situ and in real time using fluorescence spectroscopy.
Probe specifications
The selected fluorescence probes measured fluorescence in the range: 1) λex/λem = 365 ± 5 nm/480 ± 40 nm (YSI); 2) λex/λem = 368 ± 17 nm/470 ± 30 nm (Turner Designs); and 3) λex/λem = 285 nm/350 ± 27.5 nm (Turner Designs) (Table S2†). Two types of data loggers were used with the fluorescence probes: 1) EXO 2 (YSI) and 2) Cyclops 7 (Turner Designs). Since the data loggers were combined with the three probes, in further discussion the combination of data logger and probe will be referred to as follows (Table S2†):•YSI Peak C probe with EXO2 data logger – ‘EXO C probe’,
•Turner Designs Peak C probe with Cyclops 7 data logger – ‘Cyclops C probe’,
•Turner Designs Tryptophan (Peak T) probe with Cyclops 7 data logger – ‘Cyclops T probe’.
The EXO C and Cyclops C probes were linked to terrestrially-delivered OM (Peak C) while the Cyclops T probe was linked to microbially-delivered OM (Peak T) (Table S2†). Conductivity, temperature, pH, and turbidity were measured using on-line probes (YSI) with EXO2 data logger (YSI).
Probe calibration
All fluorescence probes were calibrated using a two point calibration with MilliQ water and appropriate calibration standard. Specifically, EXO C and Cyclops C probes were calibrated using a 100 μg L−1 quinine sulphate (QS) solution (Sigma Aldrich) dissolved in 0.05 M (0.1 N) sulphuric acid (H2SO4) (Sigma Aldrich). The Cyclops T probe was calibrated using 50 μg L−1 tryptophan solution (Sigma Aldrich).The calibration of the probes was undertaken as recommended by the suppliers as follows: the Cyclops probes were calibrated using a 3 L non-fluorescent glass beaker with a non-reflective black surface under the beaker. For the EXO C probe, one of the EXO sonde guard cups was used for the probe calibration. There is a potential for the QS calibration standard to come into contact to the copper-based components of the EXO sonde which could cause degradation of the solution, therefore the calibration was performed within five minutes.
Probe installation
The probes were installed at Capalaba WTP from the 26th September to 31st October and from the 13th November to 13th December 2013 at Yarra Glen WTP. All probes were set to collect measurements every 15 min. The data loggers were synchronised based on UNIX time. All probes were manually cleaned on weekly and fortnightly visits, and therefore no significant probe fouling was observed.The Capalaba WTP raw water was monitored using an overflow glass container. The retention time of the container was 10 min, ensuring a ‘fresh’ sample was obtained between the 15 min sampling intervals. The probes were installed upright and were easily accessible for maintenance. The probes which were monitoring treated water quality were installed directly into the clarifier, positioned approximately 1 m below the water surface to allow the direct measurement of the coagulated water from the top water layer of the clarifier. The Capalaba WTP treatment regime was based on water demand and therefore the site commonly operated from 7 am to 3 pm on a daily basis while the probes monitored continuously. The data generated when the WTP was offline were removed from the data set based on the operational data logs.
At Yarra Glen WTP, source water was sampled directly from the aqueduct, about 10 m downstream of the water intake to the treatment plant. Probes were installed on the water gauge which was used to maintain a constant water level for the WTP intake. Treated water quality was measured using an overflow water drum that collected water prior to chlorination. The water flow through the container was adjusted to ensure the water exchange during 15 min between the sampling points. All probes were installed upright and were easily accessible for maintenance. Similar to Capalaba WTP, Yarra Glen WTP treatment regime was based on the water demand and was not constant. The data generated when the WTP was offline were removed from the data set based on the operational data logs.
Verification of probe data using grab samples
WTPs were visited on a weekly to fortnightly basis for grab sample collection. Grab samples were used to validate on-line data. All samples were collected in triplicate in pre-labelled, sterilised, polypropylene (PP) 50 mL tubes that had previously been shown to have minimal fluorescent leachate.21 Samples were kept at 4 °C in the dark and were further analysed within 48 hours at UNSW. All samples were filtered through 0.45 μm sterilised syringe filters prior to analysis.Each of the samples were analysed using fluorescence spectroscopy, UV absorbance spectroscopy and dissolved organic carbon (DOC) analysis using the same procedure for samples analysed reported in Shutova et al.8 Briefly, DOC concentrations were determined using a Shimadzu TOCCSH total organic carbon analyser. UV absorption data were obtained using a Varian Cary 50 Bio UV/visible spectrometer and a 1 cm path length quartz cuvette (Starna, Australia). An absorption range of 200–600 nm at an increment of 1 nm and a scan speed of 600 nm min−1 was applied. Fluorescence EEMs were obtained using a 1 cm path length quartz cuvette (Starna, Australia) and a Varian Cary Eclipse Spectrophotometer. Fluorescence intensities were measured in triplicate at excitation wavelengths of 200–400 nm in 5 nm increments and emission wavelengths of 280–500 nm in 2 nm increments. Fluorescence intensity of all spectra was normalised to Raman units (RU).22,23 Fluorescence EEMs were corrected to minimise instrumental and sample-related biases, potentially including wavelength-dependent variability in the transmission efficiency of monochromators, fluctuations in spectrometer light intensity and sample inner filter effects.23–25 Rayleigh–Tyndell and Raman scatter lines were removed using Zepp's method.26
On-line fluorescence signal correction
There are several factors that may affect the fluorescence measurements: temperature, turbidity and inner filter effect (IFE).27,28 During the on-line study, measured turbidity ranged from 5 FNU to 1 FNU in raw and treated water in both Capalaba and Yarra Glen WTPs (Tables S3 and S4†). The relationship between attenuation of fluorescence intensity and turbidity has been shown to be non-linear and instrument specific.27 Since the turbidity range measured in all sampling points was very low in this study, the attenuation of fluorescence intensity at turbidity lower than 5 FNU was less that 2–3%.27 Therefore the effect of turbidity was considered to be insignificant and turbidity correction of the fluorescence data was therefore not undertaken. If the fluorescence monitoring protocol was to be used in highly turbid water, such as fresh water streams, turbidity correction should be considered for fluorescence data processing. However, it was deemed necessary to apply the following signal correction strategies for temperature and inner filter effect.Samples were cooled to 4 °C and placed into three 3 L clean glass beakers. The probes were placed into the water, one probe per beaker, following the instructions from the manufacturer for standard solutions and calibration requirements. Experiments were conducted under constant light and constant mixing using a magnetic stirrer at 30 rpm. The temperature increased under normal convection with the laboratory air; no additional heating was applied. The probes recorded fluorescence intensity every minute. The temperature correction of the fluorescence intensity was conducted using eqn (1):28
| Ir = Im/[1 + ρ(Tm − Tr)] | (1) |
| K = ∑Inc/∑Ic | (2) |
In order to address changes of fluorescence intensity due to IFE, eqn (1) was modified as follows:
| Ir = Im/[K[1 + ρ(Tm − Tr)]] | (3) |
Data processing
Outliers were removed from the on-line data set using a moving median filter in which the median of adjacent sample measurements is used. Statistical analysis of the collected data was conducted using SPSS Statistics 22 (IBM) software. Pearson's correlation coefficient (R) was used for the assessment of the temperature correction factors. Spearman's correlation (Rs) was used for the assessment of the non-normally distributed data based on Kolmogorov–Smirnov test.30Results and discussion
Establishment of correction factors
| Probe | Parameter | Capalaba WTP raw water | Yarra Glen WTP raw water | Yarra Glen WTP treated water | Tryptophan standard |
|---|---|---|---|---|---|
| EXO C | Slope (μg L−1 °C−1) | −1.3491 | −0.6431 | ||
| Intercept (μg L−1) | 111.29 | 26.76 | |||
| R 2 | 0.98 | 0.99 | |||
| ρ EXO C (°C−1) | −0.012 | −0.024 | |||
| Cyclops C | Slope (μg L−1 °C−1) | −1.7623 | −0.5688 | −0.2365 | |
| Intercept (μg L−1) | 109.48 | 36.105 | 14.65 | ||
| R 2 | 0.97 | 0.98 | 0.98 | ||
| ρ Cyclops C (°C−1) | −0.016 | −0.016 | −0.016 | ||
| Cyclops T | Slope (μg L−1 °C−1) | −1.4719 | |||
| Intercept (μg L−1) | 101.1 | ||||
| R 2 | 0.98 | ||||
| ρ Cyclops T (°C−1) | −0.015 |
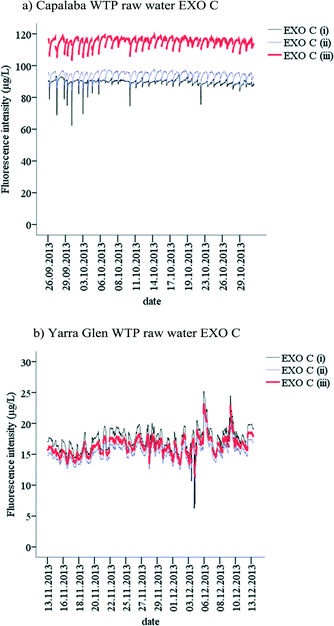
The reference temperature was considered to be 20 °C. An example of corrected signal is shown in Fig. S1.† Fluorescence intensity was corrected to 20 °C using the temperature coefficient of −0.012 °C−1. As a result, corrected fluorescent signal was temperature independent at the fluorescence intensity of 85.5 ± 1.3 μg L−1 (QSE).
Although the temperature effect on the fluorescence is significant, the application of the temperature signal correction should be decided based on the aim of particular measurements. The temperature of raw water and treated water was very similar in both sites (Tables S3 and S4†), therefore the temperature effect on the fluorescence intensities within the sites was very similar as well. If the aim of the fluorescence measurements is to monitor changes of OM from untreated to treated water at the particular site, the fluorescence probes signal could be used without the temperature correction. However if the aim of the measurements is to monitor OM seasonal variability or assess OM changes at sites with contrasting water temperatures, the temperature correction of the fluorescence signal would be essential (Khamis et al., 2015; Watras et al., 2011; Lee et al., 2015).20,28,31
| K EXO C | K Cyclops C | K Cyclops T | UV254 (cm−1) | |
|---|---|---|---|---|
| Excitation wavelength range (nm) | 360–370 | 350–385 | 285 | |
| Emission wavelength range (nm) | 440–520 | 440–500 | 320–380 | |
| Capalaba WTP raw water | 0.82 | 0.80 | 0.52 | 0.55 |
| Capalaba WTP treated water | 0.98 | 0.98 | 0.92 | 0.10 |
| Yarra Glen WTP raw water | 0.94 | 0.94 | 0.83 | 0.13 |
| Yarra Glen WTP treated water | 1.00 | 1.00 | 0.96 | 0.02 |
Water treatment processes such as coagulation–flocculation–sedimentation and coagulation–membrane filtration had a significant impact on the OM concentrations. IFE had a different effect on the untreated and treated water fluorescence. Therefore, there was a need to incorporate the IFE correction coefficient into the fluorescence probe signal processing procedure to be able to compare fluorescence intensity within the sites. The correlation between the IFE as UV absorbance and fluorescence intensity changes is not linear.27 The correction coefficients were calculated for the particular water sample and fluorescence probes at stable UV absorbance. If the water quality changes, for example during flood events or treatment failure, and OM concentration significantly changes as well, it will be essential to recalculate IFE correction coefficients for the particular water quality.
Correlations between fluorescent OM and DOC
Fluorescence intensity had a statistically significant Spearman's correlation with DOC (Fig. 2a and b); for example, Cyclops C and EXO C probes had correlations with DOC (p < 0.01 for two-tailed test) of Rs = 0.93 and Rs = 0.85, respectively. This indicates that fluorescence intensity can be used as a surrogate measurement to monitor DOC in raw and treated waters over a wide range of concentrations; specifically, DOC from 1.2 ± 0.2 mg C L−1 to 13.5 ± 0.4 mg C L−1 and fluorescence intensity from 5.0 ± 1.6 μg L−1 QSE to 94.5 ± 2.0 μg L−1 QSE). This is supported by the literature.4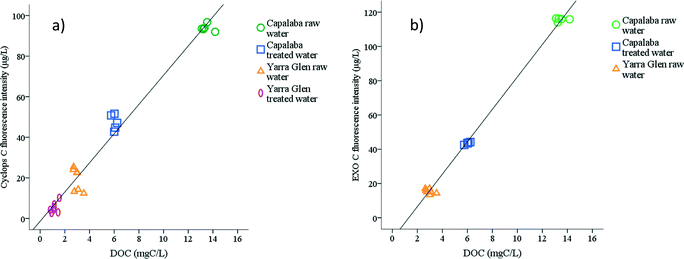 | ||
| Fig. 2 Correlations between fluorescence intensity and DOC concentrations measured by (a) Cyclops C and (b) EXO C probe. | ||
Site specific correlations between fluorescence intensity and DOC were also investigated. For Capalaba WTP water, both Cyclops C and EXO C probes had significant correlations with DOC concentration at Rs = 0.73 (p < 0.02) and Rs = 0.82 (p < 0.01), respectively. At the Yarra Glen WTP, a significant correlation was observed only for the Cyclops C probe (Rs = 0.76, p < 0.01). The EXO C probe fluorescence did not correlate with DOC in Yarra Glen WTP due to the low variability of OM in raw water in grab samples and the low concentration of OM in treated water.
The Spearman's correlation coefficients between the DOC and uncorrected and temperature corrected signals remained the same for site specific and for overall correlations, except for the overall correlation of the EXO C probe. The minor reduction of the Rs from 0.85 to 0.82 was observed between DOC and uncorrected EXO C probe response due to the IFE interferences at the high OM concentration in Capalaba WTP raw water. Fluorescence probes measure the fluorescence intensity in the particular optical window. A good correlation between the fluorescence intensity measured by the probe and DOC means that the changes of fluorescent OM in that optical window were representative of the changes of total DOC.10 Hence, it should be noted that correlations observed are specific to OM character. If the water character should significantly change, this correlation would need to be revised and adjusted.20,31
The relationship between the fluorescence intensity reduction and DOC removal is shown in Fig. 3 and Table 3. DOC removal was 60 ± 11% in Yarra Glen WTP and 55 ± 2% in Capalaba WTP. Fluorescence intensity reduction was almost the same as DOC removal in Capalaba WTP (Cyclops C removal 50 ± 4%), but it was higher than DOC removal in Yarra Glen WTP (Cyclops C removal 77 ± 4%). It has been shown that aromatic OM is coagulated in preference to OM of other character, since coagulation preferentially targets highly charged, aromatic and fluorescent OM components if treatment processes are optimised.33–35 Hence, the higher Cyclops C fluorescence removal relative to DOC removal that was observed at Yarra Glen WTP indicated that coagulation–membrane filtration was better optimised to remove the most treatable fluorescent OM fraction. This was in contrast to Capalaba WTP, where there was the potential to further optimise the coagulation–flocculation–sedimentation process to improve fluorescent OM removal. Research has shown that DBP formation is highly correlated with the presence of the aromatic, fluorescent OM fraction, where humic-like OM was one of the major contributors to DBP formation.36,37 Therefore, fluorescence intensity could be used as a surrogate for measurement of OM removal optimisation in order to reduce the potential formation of DBPs.10
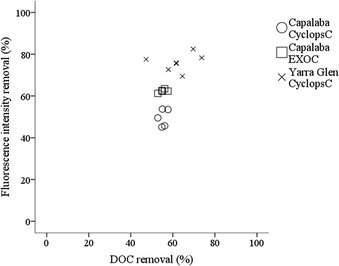 | ||
| Fig. 3 Relationship between fluorescence intensity and DOC removal in Capalaba and Yarra Glen WTPs based on grab samples. | ||
| Yarra Glen WTP | Capalaba WTP | |||||
|---|---|---|---|---|---|---|
| DOC removal (%) | EXO C removal (%) | Cyclops C removal (%) | DOC removal (%) | EXO C removal (%) | Cyclops C removal (%) | |
| Minimum | 41.0 | — | 69.4 | 52.8 | 61.2 | 45.1 |
| Maximum | 73.7 | — | 82.5 | 57.7 | 63.5 | 53.7 |
| Mean | 59.7 | — | 76.0 | 55.3 | 62.4 | 49.5 |
| Standard deviation | 10.9 | — | 4.2 | 1.8 | 0.8 | 4.1 |
In general, there was a strong relationship between the fluorescence intensities measured by two Peak C probes. However, there were also sampling point specific trends (Fig. 4). For example, at DOC concentrations lower than 13.5 ± 0.4 C L−1 in Capalaba WTP raw water, the variability of the Cyclops C probe fluorescence was higher than the variability of the EXO C probe (Fig. 4), whereas in Yarra Glen WTP treated water, the EXO C signal was below the detection limit. While, EXO C and Cyclops C probes measured fluorescence intensity in a similar EEM region of terrestrially-delivered OM (Table S2†), the Cyclops C probe had a wider optical window than the EXO C probe (Table S2†). Since the probes were calibrated using the same standard, a linear correlation between the probes fluorescence intensity was expected; however, the Cyclops C probe was more sensitive than the EXO C probe, enabling a wider measurement range for OM concentration from 1.2 ± 0.2 mg C L−1 to 13.5 ± 0.4 mg C L−1 and fluorescence intensity from 5.0 ± 1.6 μg L−1 QSE to 94.5 ± 2.0 μg L−1 QSE. Therefore, the Cyclops C probe is recommended for the on-line monitoring of the OM during drinking water treatment when OM concentrations are low.
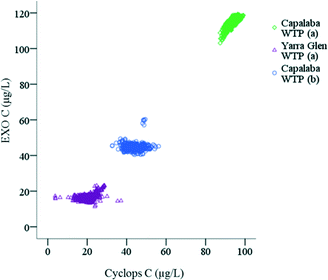 | ||
| Fig. 4 Correlation between EXO C and Cyclops C probe fluorescence intensity (μg L−1 QSE) in (a) raw water and (b) treated water in Capalaba and Yarra Glen WTPs. | ||
In situ monitoring of fluorescent OM
| EXO C | Cyclops C | Cyclops T | ||||
|---|---|---|---|---|---|---|
| Raw water (μg L−1) | Treated water (μg L−1) | Raw water (μg L−1) | Treated water (μg L−1) | Raw water (μg L−1) | Treated water (μg L−1) | |
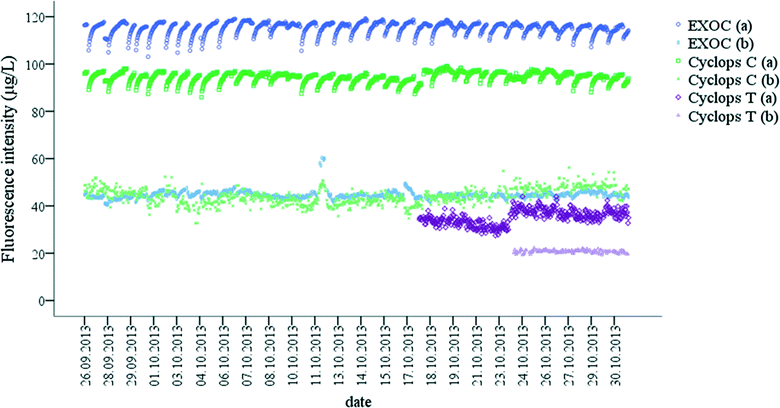
| N | 1129 | 1024 | 1119 | 914 | 404 | 149 |
| Minimum | 103.1 | 40.5 | 86.0 | 32.7 | 27.5 | 19.3 |
| Maximum | 119.3 | 60.3 | 99.2 | 56.2 | 44.0 | 22.3 |
| Mean | 115.3 | 44.6 | 94.5 | 44.0 | 35.2 | 20.7 |
| Standard deviation | 2.4 | 1.6 | 2.1 | 3.4 | 3.1 | 0.6 |
| EXO C | Cyclops C | Cyclops T | ||||
|---|---|---|---|---|---|---|
| Raw water (μg L−1) | Treated water (μg L−1) | Raw water (μg L−1) | Treated water (μg L−1) | Raw water (μg L−1) | Treated water (μg L−1) | |
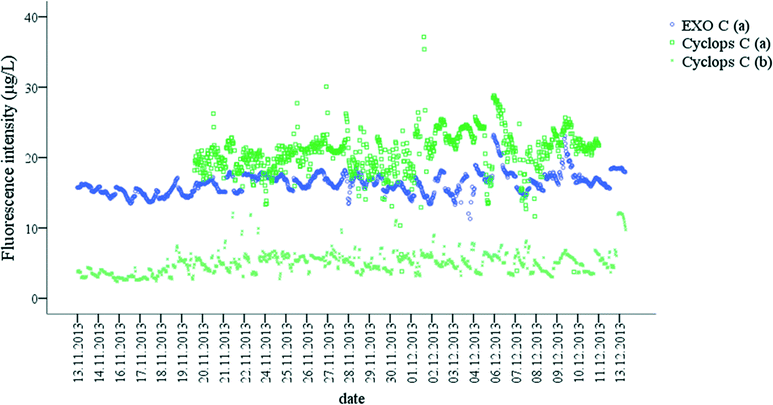
| N | 1281 | — | 912 | 1207 | 1136 | 1076 |
| Minimum | 11.30 | — | 3.8 | 2.4 | 1.8 | 0.003 |
| Maximum | 23.21 | — | 37.1 | 12.2 | 126.7 | 158.8 |
| Mean | 16.32 | — | 20.8 | 5.0 | 29.1 | 40.2 |
| Standard deviation | 1.51 | — | 3.1 | 1.6 | 21.7 | 40.1 |
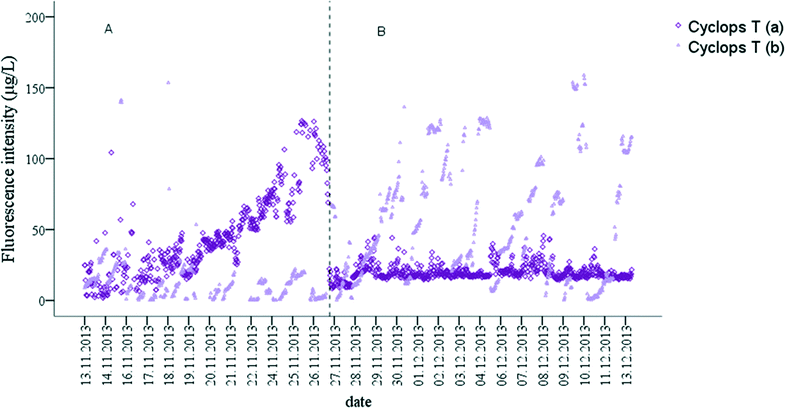
Two monitoring phases, named A and B, were identified based on the Cyclops T fluorescence intensity data. During phase A, raw water Cyclops T fluorescence intensity significantly increased during the first two week of monitoring in Yarra Glen WTP. Fluorescence intensity reached 126.7 μg L−1 TE (Table 5) and then declined to 13.9 μg L−1 TE on 27/11/2013 at 2:40 am (Fig. 7A). During phase B, Cyclops T fluorescence remained stable (Fig. 7B). Treated water Cyclops T fluorescence was lower during phase A of the monitoring in comparison to the raw water Cyclops T Peak intensity (Fig. 7A). During phase B, there were multiple events where Cyclops T intensity in the treated water gradually increased and then dropped. Similar events were observed during phase A on 16/11/2013 and 18/11/2013. The length of the events varied between one to three days and the Cyclops T intensity decrease occurred at various times of the day (Fig. 7B). These changes did not correlate with changes in fluorescence intensity monitored by EXO C and Cyclops C probes, as well as other monitored parameters. However, periodical decline of the Cyclops T intensity in the treated water could be linked to the membrane backwash cycle. Thus it is suggested that this was due to flushing of the biofilm on the membrane surface, which caused the release of microbial OM in the treated water.12
Raw water and treated water OM character
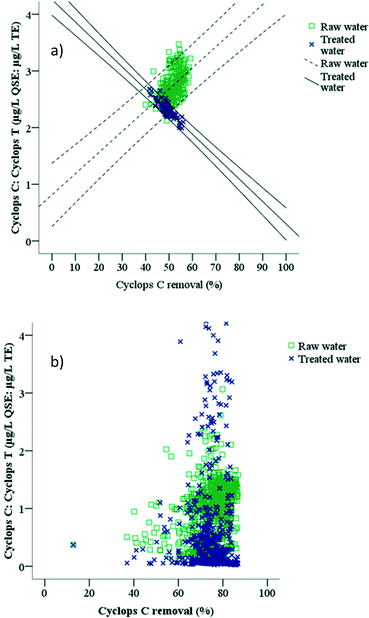
The influence of the OM character on OM removal was investigated further. Raw water OM was characterised using the ratio of terrestrially-derived OM to microbially-derived OM using the ratio of Cyclops C fluorescence intensity to Cyclops T fluorescence intensity of the raw water and treated water of Capalaba and Yarra Glen WTPs during the study (Fig. 8). OM removal was calculated using Cyclops C fluorescence intensity in raw and treated water in both sites, since the Cyclops C probe was more sensitive to OM changes than the EXO C probe. The relationship between the Cyclops C to Cyclops T ratio was found to be site specific (Fig. 8).![[thin space (1/6-em)]](https://www.rsc.org/images/entities/char_2009.gif) :
:![[thin space (1/6-em)]](https://www.rsc.org/images/entities/char_2009.gif) Cyclops T ratio was higher than in the treated water (Fig. 8a). Reduction of both Cyclops C and Cyclops T intensities during coagulation–flocculation–sedimentation (Table 4 and Fig. 5) indicated that the treated water OM character changed and this suggested preferential removal of terrestrially-derived OM in comparison to the microbially-derived OM fraction. The Cyclops C to Cyclops T ratio had a significant correlation with OM removal in both raw water (r = 0.515, p < 0.01) and treated water samples (r = −0.845, p < 0.01) at the Capalaba WTP. The higher the Cyclops C
Cyclops T ratio was higher than in the treated water (Fig. 8a). Reduction of both Cyclops C and Cyclops T intensities during coagulation–flocculation–sedimentation (Table 4 and Fig. 5) indicated that the treated water OM character changed and this suggested preferential removal of terrestrially-derived OM in comparison to the microbially-derived OM fraction. The Cyclops C to Cyclops T ratio had a significant correlation with OM removal in both raw water (r = 0.515, p < 0.01) and treated water samples (r = −0.845, p < 0.01) at the Capalaba WTP. The higher the Cyclops C![[thin space (1/6-em)]](https://www.rsc.org/images/entities/char_2009.gif) :
:![[thin space (1/6-em)]](https://www.rsc.org/images/entities/char_2009.gif) Cyclops T ratio in the raw water, the greater OM removal was observed. This is in agreement with previous research, where the ratio between terrestrial and microbial fractions of OM, determined by the C1
Cyclops T ratio in the raw water, the greater OM removal was observed. This is in agreement with previous research, where the ratio between terrestrial and microbial fractions of OM, determined by the C1![[thin space (1/6-em)]](https://www.rsc.org/images/entities/char_2009.gif) :
:![[thin space (1/6-em)]](https://www.rsc.org/images/entities/char_2009.gif) C4 ratio, was also found to be useful in assessment of raw water OM treatability.4,8 The lower the Cyclops C
C4 ratio, was also found to be useful in assessment of raw water OM treatability.4,8 The lower the Cyclops C![[thin space (1/6-em)]](https://www.rsc.org/images/entities/char_2009.gif) :
:![[thin space (1/6-em)]](https://www.rsc.org/images/entities/char_2009.gif) Cyclops T ratio of treated water was, the higher the OM removal that was observed (Fig. 8a) and the more optimised the coagulation–flocculation–sedimentation process in Capalaba WTP.
Cyclops T ratio of treated water was, the higher the OM removal that was observed (Fig. 8a) and the more optimised the coagulation–flocculation–sedimentation process in Capalaba WTP.
![[thin space (1/6-em)]](https://www.rsc.org/images/entities/char_2009.gif) :
:![[thin space (1/6-em)]](https://www.rsc.org/images/entities/char_2009.gif) Cyclops T ratio and OM removal observed in Yarra Glen WTP (Fig. 8b). In general, there were two clusters of data, where raw water typically had a higher Cyclops C
Cyclops T ratio and OM removal observed in Yarra Glen WTP (Fig. 8b). In general, there were two clusters of data, where raw water typically had a higher Cyclops C![[thin space (1/6-em)]](https://www.rsc.org/images/entities/char_2009.gif) :
:![[thin space (1/6-em)]](https://www.rsc.org/images/entities/char_2009.gif) Cyclops T ratio than treated water samples (Fig. 8b). Coagulation–membrane filtration was highly efficient in OM removal where up to 87% of Cyclops C fluorescence intensity was removed, suggesting the coagulation–membrane filtration was insensitive to raw water character changes and thus a more robust process (Fig. 8b). At the same time, there was an increase of Cyclops T fluorescence intensity in treated water that can potentially be linked to OM release by biofilm on the membrane surface as previously discussed. A lower Cyclops C
Cyclops T ratio than treated water samples (Fig. 8b). Coagulation–membrane filtration was highly efficient in OM removal where up to 87% of Cyclops C fluorescence intensity was removed, suggesting the coagulation–membrane filtration was insensitive to raw water character changes and thus a more robust process (Fig. 8b). At the same time, there was an increase of Cyclops T fluorescence intensity in treated water that can potentially be linked to OM release by biofilm on the membrane surface as previously discussed. A lower Cyclops C![[thin space (1/6-em)]](https://www.rsc.org/images/entities/char_2009.gif) :
:![[thin space (1/6-em)]](https://www.rsc.org/images/entities/char_2009.gif) Cyclops T ratio of treated water was also an indicator of OM removal optimisation in Yarra Glen WTP, similar to Capalaba WTP.
Cyclops T ratio of treated water was also an indicator of OM removal optimisation in Yarra Glen WTP, similar to Capalaba WTP.
Conclusions
Based on a fluorescence probe on-line study conducted at two WTPs with contrasting raw water quality and water treatment processes, the following conclusions are drawn:•A standardised fluorescence monitoring protocol can be applied universally; however, data interpretation was found to be site specific due to differences in OM concentrations and water treatment processes.
•Temperature and IFE correction were essential for robust dataset interpretation.
•Fluorescence intensity had a significant correlation with DOC concentration; therefore, fluorescence spectroscopy can be used to monitor OM concentrations in raw water and coagulated water as well as OM removal.
•The Cyclops C probe was found to be more sensitive to OM changes in both sites than the EXO C probe at low OM concentrations and thus operation at the lower end of the instrument range. Fluorescence intensity changes were sufficiently sensitive to identify changes in water quality and operational conditions using Cyclops C.
•Fluorescence intensity ratios of Cyclops C![[thin space (1/6-em)]](https://www.rsc.org/images/entities/char_2009.gif) :
:![[thin space (1/6-em)]](https://www.rsc.org/images/entities/char_2009.gif) Cyclops T were linked to raw water and treated water OM character and these can be used to assess OM treatability and water treatment process optimisation during coagulation–sedimentation.
Cyclops T were linked to raw water and treated water OM character and these can be used to assess OM treatability and water treatment process optimisation during coagulation–sedimentation.
•Fluorescence can be monitored in real-time and in situ, enabling OM characterisation at strategic locations within a drinking water treatment system.
Acknowledgements
This research was supported under Australian Research Council's Linkage Projects funding scheme (project number LP100200259), including support from Seqwater, Hunter Water, Melbourne Water and Water Research Australia Ltd (WaterRA). The Authors are also grateful for the Water RA PhD top-up scholarship provided for this project. Instrumentation was funded by the UNSW MREII and Australian Research Council/National Water Commission co-funded National Centre for Groundwater Research and Training.References
- A. Matilainen, E. T. Gjessing, T. Lahtinen, L. Hed, A. Bhatnagar and M. Sillanpää, Chemosphere, 2011, 83, 1431–1442 CrossRef CAS PubMed.
- J. P. Ritson, N. J. D. Graham, M. R. Templeton, J. M. Clark, R. Gough and C. Freeman, Sci. Total Environ., 2014, 473–474, 714–730 CrossRef CAS PubMed.
- C. Volk, L. Wood, B. Johnson, J. Robinson, W. Z. Hai and L. Kaplan, J. Environ. Monit., 2002, 4, 43–47 RSC.
- M. Bieroza, A. Baker and J. Bridgeman, Sci. Total Environ., 2009, 407, 1765–1774 CrossRef CAS PubMed.
- L. Joseph, J. R. V. Flora, Y.-G. Park, M. Badawy, H. Saleh and Y. Yoon, Sep. Purif. Technol., 2012, 95, 64–72 CrossRef CAS.
- M. V. Storey, B. van der Gaag and B. P. Burns, Water Res., 2011, 45, 741–747 CrossRef CAS PubMed.
- C. Chow, R. Fabris and M. Dixon, Case studies using S::CAN on-line monitoring system, Adelaide, 2008 Search PubMed.
- Y. Shutova, A. Baker, J. Bridgeman and R. K. Henderson, Water Res., 2014, 54, 159–169 CrossRef CAS PubMed.
- J. Bridgeman, M. Bieroza and A. Baker, Rev. Environ. Sci. Biotechnol., 2011, 10, 277–290 CrossRef CAS.
- J. Bridgeman, A. Baker, D. Brown and J. B. Boxall, Sci. Total Environ., 2015, 524–525, 338–346 CrossRef CAS PubMed.
- J. H. Goldman, S. A. Rounds, M. K. Keith and S. Sobieszczyk, J. Hydrol., 2014, 519(Part D), 3028–3041 CrossRef CAS.
- A. Baker, S. A. Cumberland, C. Bradley, C. Buckley and J. Bridgeman, Sci. Total Environ., 2015, 532, 14–19 CrossRef CAS PubMed.
- J. P. R. Sorensen, D. J. Lapworth, B. P. Marchant, D. C. W. Nkhuwa, S. Pedley, M. E. Stuart, R. A. Bell, M. Chirwa, J. Kabika, M. Liemisa and M. Chibesa, Water Res., 2015, 81, 38–46 CrossRef CAS PubMed.
- A. Baker, D. Ward, S. H. Lieten, R. Periera, E. C. Simpson and M. Slater, Water Res., 2004, 38, 2934–2938 CrossRef CAS PubMed.
- E. M. Carstea, A. Baker, M. Bieroza and D. Reynolds, Water Res., 2010, 44, 5356–5366 CrossRef CAS PubMed.
- S. A. Baghoth, S. K. Sharma and G. L. Amy, Water Res., 2011, 45, 797–809 CrossRef CAS PubMed.
- M. Bieroza, A. Baker and J. Bridgeman, J. Geophys. Res.: Biogeosci., 2009, 114, G00F07 Search PubMed.
- N. P. Sanchez, A. T. Skeriotis and C. M. Miller, Water Res., 2013, 47, 1679–1690 CrossRef CAS PubMed.
- Chelsea Technologies Group Ltd, UV Aquatracka Fluorometer Datasheet, http://cdn.chelsea.co.uk/images/Marine/Datasheets/fluorometers/2271-007-PD-E-UVAquatracka-Datasheet-0155.pdf, (accessed 29th September 2014, 2014).
- K. Khamis, J. P. R. Sorensen, C. Bradley, D. M. Hannah, D. J. Lapworth and R. Stevens, Environ. Sci.: Processes Impacts, 2015, 17, 740–752 CAS.
- A. Hambly, R. K. Henderson, A. Baker, R. M. Stuetz and S. J. Khan, Water Sci. Technol., 2010, 62, 2059–2065 CrossRef CAS PubMed.
- A. J. Lawaetz and C. A. Stedmon, Appl. Spectrosc., 2009, 63, 936–940 CrossRef CAS PubMed.
- K. R. Murphy, K. D. Butler, R. G. M. Spencer, C. A. Stedmon, J. R. Boehme and G. R. Aiken, Environ. Sci. Technol., 2010, 44, 9405–9412 CrossRef CAS PubMed.
- P. G. Coble, Mar. Chem., 1996, 51, 325–346 CrossRef CAS.
- R. M. Cory, M. P. Miller, D. M. McKnight, J. J. Guerard and P. L. Miller, Limnol. Oceanogr.: Methods, 2010, 8, 67–78 CrossRef CAS.
- R. G. Zepp, W. M. Sheldon and M. A. Moran, Mar. Chem., 2004, 89, 15–36 CrossRef CAS.
- B. D. Downing, B. A. Pellerin, B. A. Bergamashi, J. F. Saraceno and T. E. C. Kraus, Limnol. Oceanogr.: Methods, 2012, 10, 767–775 CrossRef CAS.
- C. J. Watras, P. C. Hanson, T. L. Stacy, K. M. Morrison, J. Mather, Y. H. Hu and P. Milewski, Limnol. Oceanogr.: Methods, 2011, 9, 296–301 CrossRef CAS.
- T. Ohno, A. Amirbahman and R. Bro, Environ. Sci. Technol., 2008, 42, 186–192 CrossRef CAS PubMed.
- W. B. Ware, J. M. Ferron and B. M. Miller, Introductory statistics: A conceptual approach using R, Routledge, 2013 Search PubMed.
- E. J. Lee, G. Y. Yoo, Y. Jeong, K. U. Kim, J. H. Park and N. H. Oh, Biogeosciences, 2015, 12, 3109–3118 CrossRef.
- T. Ohno, Environ. Sci. Technol., 2002, 36, 742–746 CrossRef CAS PubMed.
- J. K. Edzwald, Water Sci. Technol., 1993, 27, 21–35 CAS.
- J. Kim, Z. Cai and M. M. Benjamin, J. Membr. Sci., 2008, 310, 356–364 CrossRef CAS.
- E. L. Sharp, S. A. Parsons and B. Jefferson, Sci. Total Environ., 2006, 363, 183–194 CrossRef CAS PubMed.
- K. M. H. Beggs and R. S. Summers, Environ. Sci. Technol., 2011, 45, 5717–5724 CrossRef CAS PubMed.
- K. M. H. Beggs, R. S. Summers and D. M. McKnight, J. Geophys. Res., 2009, 114 Search PubMed.
Footnote |
| † Electronic supplementary information (ESI) available. See DOI: 10.1039/c6ew00048g |
| This journal is © The Royal Society of Chemistry 2016 |

