 Open Access Article
Creative Commons Attribution 3.0 Unported Licence
The electronic and solvatochromic properties of [Co(L)(bipyridine)2]+ (L = o-catecholato, o-benzenedithiolato) species: a combined experimental and computational study†
Giacomo
Cioncoloni
,
Hans M.
Senn
,
Stephen
Sproules
,
Claire
Wilson
 and
Mark D.
Symes
 *
*
WestCHEM, School of Chemistry, University of Glasgow, University Avenue, Glasgow, G12 8QQ, UK. E-mail: mark.symes@glasgow.ac.uk
First published on 8th September 2016
Abstract
Complexes of Co(III) containing mixed chelating diimine and o-quinone ligand sets are of fundamental interest on account of their fascinating magnetic and electronic properties. Whilst complexes of this type containing one diimine and two o-quinone ligands have been studied extensively, those with the reverse stoichiometry (two diimines and one o-quinone) are much rarer. Herein, we describe a ready route to the synthesis of the complex [CoIII(o-catecholate) (2,2′-bipyridine)2]+ (1), and also report the synthesis of [CoIII(o-catecholate)(5,5′-dimethyl-2,2′-bipyridine)2]+ (2) and [CoIII(o-benezenedithiolate)(5,5′-dimethyl-2,2′-bipyridine)2]+ (3) for the first time. Spectroscopic studies show that complex 2 displays intriguing solvatochromic behaviour as a function of solvent hydrogen bond donation ability, a property of this type of complex which has hitherto not been reported. Time-dependent density function theory (TD-DFT) shows that this effect arises as a result of hydrogen bonding between the solvent and the oxygen atoms of the catecholate ligand. In contrast, the sulfur atoms in the benzenedithiolate analogue 3 are much weaker acceptors of hydrogen bonds from the solvent, meaning that complex 3 is only very weakly solvatochromic. Finally, we show that complex 2 has some potential as a molecular probe that can report on the composition of mixed solvent systems as a function of its absorbance spectrum.
Introduction
Complexes of Co(III) containing both chelating diimines (e.g. 2,2′-bipyridyl) and either o-catecholate or o-benzenedithiolate ligands are attractive targets as these compounds frequently display interesting electronic and magnetic properties on account of the redox activity of the catecholate/benzenedithiolate ligands.1–11 Within this class of complexes, those containing two o-catecholate and one diimine ligand tend to be more common, with only a few examples existing of complexes of the type [CoIII(o-catecholate)(bipyridyl)2]+ (where the metal centre is attached to only one o-catecholate ligand and two chelating diimines).1–6 Moreover, to the best of our knowledge, the solvatochromic properties of this class of complexes has not been studied in any great detail before, nor have any analogues of these compounds bearing o-benezenedithiolate ligands in place of the o-catecholate moieties been reported. Herein, we report the synthesis and characterization of the complexes [CoIII(o-catecholate) (2,2′-bipyridine)2]+ (1), [CoIII(o-catecholate)(5,5′-dimethyl-2,2′-bipyridine)2]+ (2) and [CoIII(o-benezenedithiolate)(5,5′-dimethyl-2,2′-bipyridine)2]+ (3), where complexes 2 and 3 are both previously unreported. We then undertake an in-depth analysis of the solvatochromism displayed by complexes 2 and 3 using both experimental and computational methods.Given its apparent simplicity, it was surprising to us at the outset of our studies that no detailed synthesis or characterization of the parent compound [CoIII(o-catecholate)(2,2′-bipyridine)2]+ (1) exists (although this compound has been reported previously, experimental and characterization particulars are very brief12). With a view to investigating the electronic properties of this complex, we therefore adapted synthetic methods reported by Panja3 to obtain this compound (compound 1) in almost quantitative yield using a straightforward and quick one-pot synthesis (note, however, that high yields are only obtained if the order of addition of the components is controlled – see below). As the solubility of compound 1 was rather low in common laboratory solvents, we used the same general procedure to obtain the analogous (and previously unreported) 5,5′-dimethylbipyridyl complex (2, also in near-quantitative yield), which is much more soluble. Furthermore, we were able to extend this methodology to synthesize the novel complex [CoIII(o-benezenedithiolate)(5,5′-dimethyl-2,2′-bipyridine)2]+ (3). Complex 3 is a rare example of a Co-bipyridine-dithiolene complex that can be prepared without isolation of any intermediate species and that contains only one benzenedithiolate ligand in the isolated compound.13–16
Both complexes 2 and 3 proved sufficiently soluble to allow us to probe their electronic properties by electrochemistry and EPR. These studies revealed that complexes 2 and 3 tend to decompose when their o-catecholate and o-benzenedithiolate ligands are oxidized, rendering these complexes of limited use for studying the effects of any redox non-innocence that may be exhibited by their ligands. However, our investigations did reveal some intriguing differences between the complexes regarding their solution-phase UV-vis spectra, with complex 2 exhibiting a strong negative solvatochromic shift in its visible absorbance band as a function of solvent polarity and hydrogen bond donor ability. Meanwhile, complex 3 was much less affected by these factors (indeed, it showed no perturbation in absorbance as a function of hydrogen bonding at all). In the following, we rationalize these effects using time-dependent density function theory (TD-DFT) and suggest that the differences in behaviour between these two complexes are attributable to hydrogen bonding between the oxygen atoms of the catecholate ligand of complex 2 and the solvent (an interaction which is switched off in complex 3 on account of sulfur being a weaker hydrogen bond-acceptor than oxygen). Finally, we show that complexes of this type may hold some promise as molecular probes that can report on the composition of mixed solvent systems as a function of their absorbance spectra.
Experimental section
General experimental remarks
All solvents were obtained from Sigma Aldrich and used as supplied. 2,2′-Bipyridine (≥99%), 5,5′-dimethyl-2,2′-bipyridine (98%), catechol (1,2-dihydroxybenzene, ≥99%), 1,2-benzenedithiol (96%), Co(NO3)2·6H2O (98%) and CoCl2·6H2O (98%) were supplied by Sigma Aldrich. Tetrabutylammonium hexafluorophosphate (TBA-PF6) (98%) was obtained from Alfa Aesar.All 1H and 13C NMR spectra were recorded on a Bruker AV 400 instrument, at a constant temperature of 300 K. Chemical shifts are reported in parts per million from low to high field. Coupling constants (J) are reported in hertz (Hz). Standard abbreviations indicating multiplicity were used as follows: m = multiplet, d = doublet, t = triplet, s = singlet. Assignments of signals to specific protons are based on 2D (COSY) spectra. UV-Vis spectra were recorded on a JASCO V-670 spectrophotometer using 1 cm pathlength cuvettes. CHN analyses were collected by the services facility at the School of Chemistry, University of Glasgow, as were FAB mass spectra (positive mode) and LM-MS mass spectra (ESI, positive mode, Bruker micrOTOF-Q machine). IR spectra were collected in the solid state on a Shimadzu IRAffinity-1S Fourier Transform Infrared Spectrophotometer. TGA analyses were collected by the services facility at the School of Chemistry, University of Glasgow on a TA Instruments SDT Q600 machine. All the experiments were carried out under Argon at a flow rate of 100 mL min−1 and the temperature ramp rate was 10 °C per minute. PXRD measurements were carried out at the University of Glasgow at 298 K using a PANalytical X'Pert PRO MPD diffractometer (λ(CuKα1) = 1.5405 Å) on a mounted bracket sample stage. Data were collected over the range 10–50°. Melting points were gauged using an Electrothermal IA 9000 digital melting point machine. Experiments performed at “room temperature” were carried out at 20 °C. Electrochemical experiments were performed as below. X-band EPR spectra were recorded on a Bruker ELEXSYS E500 Spectrometer and simulations were performed using Bruker's Xsophe Program Package.17
Synthesis of compound 1
To a solution of 2,2′-bipyridine (0.233 g, 1.49 mmol, 2 eq.) in methanol (50 mL) was added a solution of Co(NO3)2·6H2O (0.217 g, 0.746 mmol, 1 eq.) in methanol (10 mL) and the resulting orange solution stirred at room temperature open to air for 2 minutes. A solution of catechol (0.082 g, 0.746 mmol, 1 eq.) in 10 mL methanol was then added to the reaction. No colour change was observed. Excess triethylamine (3 mL) was then added to the reaction mixture, which was observed to darken immediately to red-brown upon addition of Et3N. A precipitate was observed to form within 2 minutes. After 10 further minutes stirring open to air, the reaction mixture was filtered, washing the solid on the filter with diethyl ether. This solid was dried at 60 °C for 90 minutes, yielding compound 1 as a dark brown powder (0.375 g, 93%), m.p. = 240 °C (dec.). The complex is somewhat hygroscopic and turns greenish (indicating hydration, see below) when exposed to laboratory air. Indeed, a sample of dry mass 0.216 g was found to increase in mass by 12 mg after standing in air for 1 hour (upon further standing the mass did not increase further). This corresponds to a mass-gain of around 5%, corresponding to 1.5 molecules of H2O per molecule of compound 1. CHN analysis was then performed on this hydrated sample: Anal. calcd for C26H20CoN5O5·(1.5H2O): C 54.94, H 4.08, N 12.32. Found: C 54.81, H 4.00, N 12.21. Yields for compound 1 are calculated from the dry (anhydrous) mass. 1H NMR (90% MeOD/10% D2O, 400 MHz), δ = 8.91 (d, 2H, J = 5.6, Ha or Hh), 8.77 (d, 2H, J = 8.3, Hd or He), 8.70 (d, 2H, J = 8.0, Hd or He), 8.48 (dt, 2H, J1 = 8.1, J2 = 1.3, Hc or Hf), 8.34–8.27 (m, 2H, Hc or Hf), 7.92 (dt, 2H, J1 = 5.7, J2 = 1.1, Hb or Hg), 7.59–7.53 (m, 4H, Hb or Hg and Ha or Hh), 6.67–6.60 (m, 2H, Hi or Hj), 6.43–6.37 (m, 2H, Hi or Hj). Letter assignments correspond to those shown in Scheme 1. The 1H NMR spectrum of this compound is shown in the ESI (Fig. S1†). 13C NMR (90% MeOD/10% D2O, 100 MHz), δ = 157.6, 157.5, 157.3, 152.1, 150.7, 142.5, 142.1, 128.8, 128.6, 125.1, 124.7, 118.8, 116.2. IR (solid state, cm−1) ν = 1472 (m), 1442 (m), 1331 (s), 1243 (s). ESI-LMMS (acetonitrile): m/z = 479.0699, [M]+ (calcd for C26H20CoN4O2; 479.0918). TGA analysis (Fig. S2†) indicates two significant weight loss events between 220 and 280 °C, commensurate with decomposition of 1. Powder X-ray diffraction (PXRD) was undertaken on a sample of compound 1 and this pattern is shown in Fig. S3.†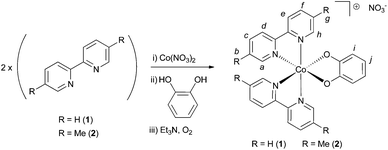 | ||
| Scheme 1 The general synthetic route followed to synthesize compounds 1 and 2. Italic letters on the product structure correspond to the 1H NMR signal assignments in the Experimental section. | ||
Synthesis of compound 2
To a solution of 5,5′-dimethyl-2,2′-bipyridine (0.500 g, 2.71 mmol, 2 eq.) in methanol (50 mL) was added a solution of Co(NO3)2·6H2O (0.395 g, 1.36 mmol, 1 eq.) in methanol (10 mL) and the resulting orange solution stirred at room temperature open to air for 2 minutes. A solution of catechol (0.149 g, 1.36 mmol, 1 eq.) in 10 mL methanol was then added to the reaction. No colour change was observed. Excess triethylamine (5 mL) was then added to the reaction mixture, which was observed to darken immediately to red-brown upon addition of Et3N. After stirring in air for 3 minutes, the solution had changed to bottle-green. After a further 10 minutes stirring open to air, 100 mL of diethyl ether was added to induce precipitation of a green/grey solid, which was collected by filtration and washed on the filter with ether, and then dried at 100 °C to yield a dark brown powder (0.800 g, 98%). Subsequent recrystallization from DMF/diethylether afforded 2 as brown crystals, m.p. = 270 °C (dec.). The complex is somewhat hygroscopic and turns greenish (indicating hydration, see below) when exposed to laboratory air. Indeed, a sample of dry mass 0.128 g was found to increase in mass by 2.4 mg after standing in air for 1 hour (upon further standing the mass did not increase further). This corresponds to a mass-gain of around 2%, corresponding to ∼0.67 molecules of H2O per molecule of compound 2. CHN analysis was then performed on this hydrated sample: Anal. calcd for C30H28CoN5O5·(2/3H2O): C 59.12, H 4.85, N 11.49. Found: C 59.35, H 4.69, N 11.57. Yields for compound 2 are calculated from the dry (anhydrous) mass. 1H NMR (MeOD, 400 MHz), δ = 8.68–8.66 (m, 2H, Ha or Hh), 8.59 (d, 2H, J = 8.2, Hd or He), 8.52 (d, 2H, J = 8.2, Hd or He), 8.29–8.24 (m, 2H, Hc or Hf), 8.12–8.07 (m, 2H, Hc or Hf), 7.28–7.24 (m, 2H, Ha or Hh), 6.65–6.60 (m, 2H, Hi or Hj), 6.43–6.37 (m, 2H, Hi or Hj), 2.50 (s, 6H, Hb or Hg), 2.26 (s, 6H, Hb or Hg). Letter assignments correspond to those shown in Scheme 1. The 1H NMR spectrum of this compound is shown in the ESI (Fig. S4 and S5†). 13C NMR (MeOD, 100 MHz), δ = 157.0, 154.7, 154.6, 151.0, 149.7, 142.0, 141.6, 139.3, 139.0, 123.4, 123.0, 117.9, 115.3, 17.7, 17.1. IR (solid state, cm−1) ν = 1474 (s), 1366 (s), 1327 (s), 1250 (s). ESI-LMMS (acetonitrile): m/z = 535.1305, [M]+ (calcd for C30H28CoN4O2, 535.1544). TGA analysis (Fig. S6†) indicates a significant weight loss event between 220 and 280 °C, commensurate with decomposition of 2. PXRD was undertaken on a sample of compound 2 and this pattern is shown in Fig. S7† along with a discussion of these data. An exactly analogous synthetic route employing CoCl2·6H2O as the cobalt salt was found to be equally effective at generating compound 2, and the characterization of the resulting chloride salt was in agreement with that reported here for the nitrate salt.Synthesis of compound 3
To a solution of 5,5′-dimethyl-2,2′-bipyridine (0.320 g, 1.74 mmol, 2 eq.) in methanol (20 mL) was added a solution of Co(NO3)2·6H2O (0.254 g, 0.872 mmol, 1.2 eq.) in methanol (10 mL). To this was added a solution of benzene-1,2-dithiol (0.124 g, 0.872 mmol, 1 eq.) in 10 mL methanol. The reaction mixture was observed to turn dark green upon addition of the benzene-1,2-dithiol. After stirring in air for 60 minutes, the solvent was removed under reduced pressure and the resulting solid re-dissolved in 10 mL MeOH. Around 25 mL of diethyl ether were then added, inducing the formation of a dark green precipitate and a dark brown supernatant solution. After filtration, the green solid was kept, and re-dissolved in 5 mL of MeOH. To this green solution was then added a large excess diethyl ether, resulting in the formation of a green solid and an orange/brown supernatant solution. After a second filtration, the filtrate solution was kept and treated with excess petroleum ether, causing the precipitation of compound 3 as a yellow/orange solid. This was dried at 150 °C, giving a yield of 88 mg, (16%), m.p. = 212 °C (dec.). The complex is somewhat hygroscopic and hence absorbs water when exposed to laboratory air. Indeed, a sample of dry mass 19.5 mg was found to increase in mass by 1.3 mg after standing in air for 1 hour (upon further standing the mass did not increase further). This corresponds to a mass-gain of around 6%, corresponding to around 2 molecules of H2O per molecule of compound 3. CHN analysis was then performed on this hydrated sample: Anal. calcd for C30H28CoN5O3S2·(2H2O): C 54.13, H 4.85, N 10.52. Found: C 54.10, H 4.83, N 10.30. Yields for compound 3 are calculated from the dry (anhydrous) mass. 1H NMR (MeOD, 400 MHz), δ = 9.37–9.34 (m, 2H, Ha or Hh), 8.43 (d, 2H, J = 8.2, Hd or He), 8.39 (d, 2H, J = 8.2, Hd or He), 8.09–8.05 (m, 2H, Hc or Hf), 8.03–7.99 (m, 2H, Hc or Hf), 7.08–7.00 (m, 4H, Ha or Hh and Hi or Hj), 6.78–6.74 (m, 2H, Hi or Hj), 2.45 (s, 6H, Hb or Hg), 2.22 (s, 6H, Hb or Hg). Letter assignments correspond to those shown in Scheme 2. The 1H NMR spectrum of this compound is shown in the ESI (Fig. S8 and S9†). 13C NMR (MeOD, 100 MHz), δ = 154.4, 153.9, 153.7, 148.9, 143.2, 140.7, 140.2, 138.7, 138.5, 126.4, 122.9, 122.8, 122.6, 17.6, 17.2. IR (solid state, cm−1) ν = 3669 (w), 2980 (s), 2901 (s), 1389 (m), 1339 (m), 1237 (m), 1052 (s). MS-FAB+ (chloroform): m/z = 567.1060 [M]+ (calcd for C30H28CoN4S2; 567.1087). TGA analysis (Fig. S10†) indicates a series of significant weight loss events beginning at around 200 °C, indicative of decomposition of 3.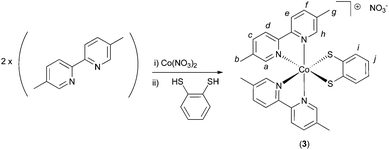 | ||
| Scheme 2 The synthetic route for the synthesis of compound 3 under air. Italic letters on the product structure correspond to the 1H NMR signal assignments in the Experimental section. | ||
Electrochemical methods
Electrochemical studies were performed in a single chamber cell in a three-electrode configuration using a CH Instruments CHI700 series potentiostat. The supporting electrolyte was 0.1 M TBA-PF6 in acetonitrile, unless otherwise noted. A large surface area strip of carbon felt (Alfa Aesar) was used as the counter electrode, along with an Ag/AgNO3 pseudo reference electrode. Potentials are reported relative to the ferrocene/ferrocenium couple, the position of which was judged by adding ferrocene to the samples analyzed. A boron-doped diamond disc electrode (area = 0.071 cm2, Windsor Scientific Ltd, UK) was used as the working electrode. Working electrodes were washed with acetone and deionized water prior to use. Cyclic voltammograms were collected at room temperature under an atmosphere of Ar at a scan rate of 100 mV s−1. Measurements were conducted without stirring and with iR compensation enabled.Computational methods
All calculations were performed with the Gaussian 09 program.18 The structures of the complexes were optimized at the TPSS19-D320/def2-TZVP21,22 level in vacuum. We tested several other functionals (PBE-D3, M06-L, M06, ωB97-XD), both in vacuum and in water (using PCM), and found that TPSS-D3 gave the best agreement with experiment (metal–ligand bond lengths within 0.01 Å) and that solvation had a negligible effect on the structure (changes in metal–ligand bond lengths of ≤0.01 Å). We therefore used the TPSS-D3/def2-TZVP/vacuum structure in all subsequent calculations. TD-DFT was used to calculate vertical singlet excitation energies at the ωB97-XD23/def2-TZVP/PCM level. The default IEF-PCM solvation model was used, which only includes electrostatic solvation effects; non-equilibrium solvation was used for excited states. NTO analyses24 were performed with Gaussian. Structures and orbitals were visualized with the program ChemCraft.25 The calculated S1 excitation energies in various solvents were found to be significantly overestimated (by ∼0.6 eV) compared to the experimental band maxima. It is well-known26 that the positions of ligand-field excitations, particularly in first transition row complexes, are not predicted reliably by TD-DFT and are highly dependent on the chosen functional. Moreover, many such excitations have a certain amount of charge-transfer character, which is also problematic for TD-DFT. The latter problem is alleviated by using a long-range corrected functional like ωB97-XD. We did not attempt to identify the optimal functional for the systems under investigation as the deviations are systematic and constant for a given excitation and functional. Therefore, the shifts due to solvation and the nature of the excitations, which are the focus of the present work, can still be considered reliable.Crystallography
Crystallographic data were collected at the EPSRC UK National Crystallography Service at the University of Southampton using a rotating anode radiation source,27 and are as follows for compound 2: C30H28CoN4O2·1(NO3), M = 597.50, trigonal, a = 21.2619 (15), c = 14.3882 (10) Å, U = 5633.0 (7) Å3, T = 100 K, space group P![[3 with combining macron]](https://www.rsc.org/images/entities/char_0033_0304.gif) c1 (no. 165), Z = 6, 40
c1 (no. 165), Z = 6, 40![[thin space (1/6-em)]](https://www.rsc.org/images/entities/char_2009.gif) 590 reflections measured, 3339 unique (R1 = 0.24), which were used in all calculations. The final wR(F2) was 0.126 (1325 reflections with I > 2σ(I)). SQUEEZE28 was used to calculate the solvent-accessible volume and the electron density within it; 1149 Å3 containing 214 electrons. This equates to ∼20% of the total crystal volume being occupied by disordered solvent, which accounts (at least partially) for the sub-optimal R-value. CCDC 1452332 contains the supplementary crystallographic data for this paper. More details on the crystallographic data and its collection can be found in the ESI.†
590 reflections measured, 3339 unique (R1 = 0.24), which were used in all calculations. The final wR(F2) was 0.126 (1325 reflections with I > 2σ(I)). SQUEEZE28 was used to calculate the solvent-accessible volume and the electron density within it; 1149 Å3 containing 214 electrons. This equates to ∼20% of the total crystal volume being occupied by disordered solvent, which accounts (at least partially) for the sub-optimal R-value. CCDC 1452332 contains the supplementary crystallographic data for this paper. More details on the crystallographic data and its collection can be found in the ESI.†
Results and discussion
Synthesis and structures of compounds 1 and 2
A general route to the synthesis of compounds 1 and 2 is given in Scheme 1. Taking the example of compound 2, addition of one equivalent of Co(NO3)2·6H2O to two equivalents of 5,5′-dimethyl-2,2′-bipyridine resulted in the formation of an orange solution, the colour of which remained unchanged (to the eye) upon the addition of one equivalent of catechol. However, subsequent addition of the base triethylamine produced an instantaneous darkening of the reaction mixture to red/brown. If the reaction was carried out under inert atmosphere, the reaction remained red/brown and a red precipitate formed within a few minutes. However, if the addition reaction was performed under air, the red colour disappeared and a bottle-green solution was obtained around 10 minutes after addition of the triethylamine. Stirring of this solution under air for up to 2 hours produced no further colour or solubility changes. Precipitation of a green/grey solid from this solution, followed by drying, yielded a brown powder in near-quantitative yield. Subsequent recrystallization from DMF/diethylether then afforded brown crystals of 2 suitable for X-ray diffraction (Fig. 1). The same pathway could be followed to obtain the 2,2′-bipyridine analogue, 1, but the product was considerably less soluble in solvents such as methanol, acetonitrile and dichloromethane than complex 2 and so complex 2 was selected for further study on account of being the more tractable of the two.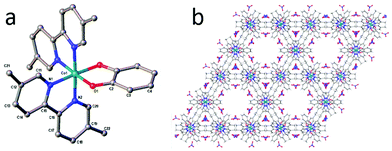 | ||
| Fig. 1 (a) The crystal structure of compound 2 showing the connectivity of the complex. Hydrogen atoms, solvent and counterions have been omitted from the structure. Crystallographic details can be found in the ESI.† (b) The packing structure of complex 2 in the solid state, viewed along the crystallographic c-axis. Colour scheme for both panels: C = grey, N = blue, O = red, Co = cyan. | ||
The connectivity of 2 is evident from Fig. 1a, which shows the two bipyridine moieties to be coordinated in a cis fashion around the metal, with the octahedral geometry of the cobalt centre completed by bidentate coordination to the catecholate ligand. The Co–O and Co–N bond lengths in Fig. 1a are: Co–O1 = 1.889(6), Co–N1 = 1.951(8) and Co–N2 = 1.926(8) Å, which are typical of Co(III) according to a search of the Cambridge Structural Database.29,30 Whilst there is precedent for using the bond lengths in the chelate rings of various catecholate–metal complexes in order to gauge the oxidation state of the metal,31 the overall quality of the crystallographic data only allows us to comment with confidence on the bond lengths around the Co centre and the general connectivity/packing of the molecule. In regard to the latter, Fig. 1b shows the suggested packing of 2 in the solid state, evincing large (∼20%) solvent-accessible voids of ∼1150 Å3 per unit cell.
The assignment of the cobalt oxidation state in compound 2 as +3 was reinforced by the 1H NMR of this complex (see Fig. S4 and S5 in the ESI†), which implied that the compound was diamagnetic. Moreover, compound 2 as isolated was found to be EPR-silent, which further supports this conclusion. The similarity of the 1H NMR spectrum of complex 1 (Fig. S1†) to that of complex 2 indicates that these complexes share a common basic geometry and that the cobalt is in the +III oxidation state in both of these compounds.
The order of addition of the components to the reaction mixture was found to be crucial for the isolation of complexes 1 and 2 in high yield. For example, if one equivalent of catechol is added to one equivalent of Co(NO3)2·6H2O in methanol, the solution remains dark pink in colour. Addition of triethylamine to this turns the solution dark blue/green. If two equivalents of 5,5′-dimethyl-2,2′-bipyridine are then added under air, the reaction mixture becomes an intense dark green (distinct from the bottle green colour observed with the order of addition given in Scheme 1). Upon stirring of this dark green solution under air for 2 hours, a dark yellow suspension forms in the otherwise green solution. Analysis of the green solution by NMR suggests that some compound 2 is present in here (along with other unidentified paramagnetic species), but after isolation the yield of complex 2 is only 25%. The dark yellow solid on the other hand (which is the main product of this reaction) is insoluble in common laboratory solvents such as methanol and chloroform.
Redox chemistry of compound 2
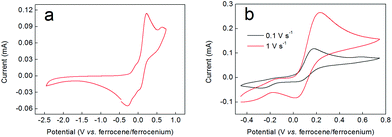
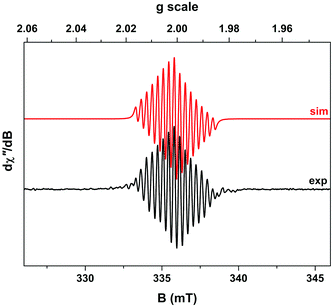
If the red/brown reaction mixture formed upon triethylamine addition under inert atmosphere (during the synthesis of compound 2 according to the order of addition of reactants shown in Scheme 1) is allowed to equilibrate with air, then any precipitated solids soon re-dissolve and the mixture turns green, giving clean and quantitative conversion to 2. This suggested that aerial oxidation was a key step in the formation of these complexes, causing oxidation of Co(II) to Co(III). However, attempts to reduce complex 2 back to this red/brown material were not successful. For example, addition of zinc dust to a green solution of 2 in methanol evinced no colour changes, implying no reduction of the complex. Similarly, electrochemical methods failed to show any redox waves that might correspond to the reduction of complex 2 (Fig. 2a). Instead, all that was observed in these experiments were two closely-spaced and quasi-reversible redox events with oxidation waves between −0.1 and +0.2 V (vs. ferrocene/ferrocenium), which we attribute to oxidation of the catecholate ligands by analogy both to other Co-catecholate complexes4 and to complexes of other metals containing catecholate ligands.32Support for assigning the locus of the redox activity to the catecholate ligand was supplied by EPR spectroscopy. Chemical oxidation, which occurs on a faster timescale than its electrochemical equivalent, was achieved by treating a 3 mM solution of complex 2 in acetonitrile with 1 equivalent of NOBF4. However, the one electron-oxidized species thus generated proved to be unstable (as suggested also by the electrochemical data in Fig. 2). Hence the resulting fluid solution EPR spectrum recorded at X-band frequency revealed an elegant 15-line profile, consistent with coupling to two 59Co (I = 7/2, 100% abundant) nuclei (Fig. 3) rather than the expected 8-line spectrum for a benzosemiquinone radical bound to a single Co(III) centre.33–43 The signal was very weak considering the concentration of the sample, suggesting the rapid decomposition of complex 2 upon oxidation. This is in agreement with the cyclic voltammetry, which suggests that the more rapidly the sample is re-reduced following oxidation, the lesser the extent of decomposition (as evinced by the greater reversibility of the redox wave at higher scan rates in Fig. 2b). Spectral simulation gave giso = 2.0007 and Aiso = 3.4 × 10⁻⁴ cm−1, which are hallmark values for a benzosemiquinone radical bound to two Co(III) ions.44–46 The extremities of the experimental spectrum in Fig. 3 show additional hyperfine lines that are not associated with the dominant 15-line signal. These presumably arise from other decomposition products or intermediates, but are not present at sufficient concentrations to be diagnosed. Interestingly, examination of the spectrum by varying the temperature incrementally to just above the solvent freezing point (−45 °C), showed no change in the number of lines, nor any deviation from binomially-distributed intensity.47 This suggests a symmetrical disposition of the two Co(III) ions attached to a bridging benzosemiquinone radical, such that the hyperfine interaction is not biased towards a particular Co nucleus as noted in more elaborate dicobalt complexes.46
The corresponding frozen-solution EPR spectrum recorded at 150 K possesses very little g anisotropy (g = 2.0094, 2.0024, 1.9899), synonymous with an organic-based unpaired electron (Fig. S11†). The line-shape is reproduced well by including coupling from both 59Co nuclei, A = (3.1, 4.6, 1.5) × 10−4 cm−1, whose average matches the isotropic value. These EPR and electrochemical measurements suggest that oxidation of complex 2 is ligand-based, leading to the formation of a dicobalt decomposition species with a bridging benzosemiquinone radical which is sufficiently long-lived to be detected by EPR.
Solvatochromism of complex 2
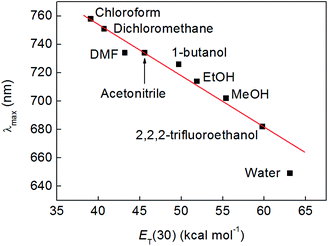
During the course of the above experiments, it was noted that complex 2 assumed different colours in different solvents, as has been observed previously for complexes of transition metals (such as Pt) containing mixed bipyridine and catecholate ligand sets.1,48–50 To probe this solvatochromic effect further, 5.0 mM solutions of compound 2 were made in solvents of various polarities and the position of the lowest energy absorption maximum, λmax (which falls between 640 and 760 nm), was plotted as a function of the ET(30) solvent polarity scale of Dimroth and Reichardt (see Fig. 4 and S12†).51,52 This revealed a clear correlation between solvent polarity and the wavelength of the first absorption, and implied that the excitation energy increased in more polar solvents (negative solvatochromism). In methanol, this absorption was found to have an extinction coefficient of 171 (±6) M−1 cm−1 (Fig. S13†), which is in good agreement with the molar extinction coefficients (typically around 170 M−1 cm−1) reported for the visible absorbances of complexes of the type [CoIII(catecholate)(R)2]+, where R is a saturated bidentate amine such as ethylenediamine.4,38To rationalize this trend further, we performed time-dependent density-functional theory (TD-DFT) calculations with a polarizable continuum model of the solvent to elucidate the nature of the excitation giving rise to the solvatochromic properties of compound 2 (see Experimental section). These calculations suggested that the measured absorption band in the visible region was due to the lowest-energy singlet excitation (S1) only. The S2 excitation, which was 0.1 eV higher in energy and might therefore contribute to the same band, was calculated to have negligible intensity (oscillator strength f ≤ 10−4). Higher excitations were sufficiently separated in energy (S3 was 0.3 eV above S2), that they could be neglected.
However, when the excitation energies calculated by TD-DFT were compared to those derived from the experimental absorption maxima, a linear correlation was only observed for solvents that were not significant hydrogen bond donors (black squares in Fig. 5). A very similar trend could be obtained by plotting the experimental excitation energies vs. the stabilization energy of a dipole sitting in a spherical cavity in a polarizable medium (the Onsager model of solvation53), which scales as fO(ε) = (ε − 1)/(2ε + 1) with the dielectric constant of the solvent, ε (Fig. S14†). Meanwhile, a plot of the excitation energies calculated by TD-DFT vs. fO(ε) was a straight line (Fig. S15†), which confirmed that the solvent model used in the calculations captured the purely electrostatic component of the solvents’ influence on the excitation energy accurately.
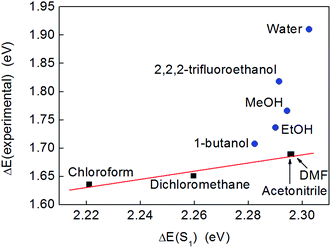 | ||
| Fig. 5 A plot of the experimental excitation energies (obtained from the band maxima given in Fig. 4) and the energies of the lowest excited singlet state calculated by TD-DFT (ωB97-XD/def2-TZVP/PCM). Non-hydrogen bonding solvents are depicted with black squares and the linear trend is indicated by a red line as a guide to the eye. Hydrogen bonding solvents are shown as blue circles. | ||
In these calculations, the solvent was considered to stabilize the solute by acting as a homogeneous polarizable medium. This was the only solvent effect included in the calculations and no specific solute–solvent interactions were considered. The effect of electrostatic solvation on an electronic excitation results from the differential stabilization of the ground and excited states and/or from the stabilization of the transition dipole moment. In the present case, the transition dipole moment was calculated to be negligible compared to the permanent dipole moment of the molecule, and so did not warrant further consideration. The dipole moments of complex 2 (in CHCl3) were calculated to be μS0 = 13.33 D and μS1 = 9.26 D in the ground and first excited states, respectively. Hence, as the excited state has a smaller dipole moment than the ground state, it is expected to interact less with the solvent. With increasing polarity (greater dielectric constant, ε) of the solvent, the ground state should therefore be increasingly better solvated compared to S1. Consequently, the excitation energy is expected to increase with increasing ε (i.e., the excitation energy blue-shifts). This explains the trend seen for non-hydrogen bonding solvents (Fig. 5 and S14†).
The fact that hydrogen bond-donating solvents do not conform to this simple model therefore suggests that other solvation effects, in particular hydrogen bonding, play a significant role in the solvatochromism displayed by complex 2. Purely electrostatic solvent models, like the polarizable continuum model used is the calculations or the Onsager model, are only good predictors of the solvatochromism in non-hydrogen bonding solvents. By contrast, the empirical ET scale accounts for all effects of the solvent, including hydrogen bonding.54
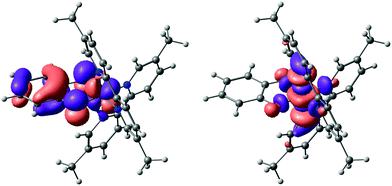
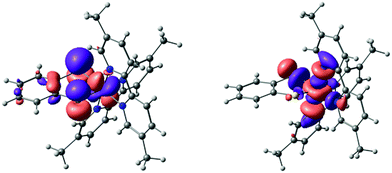
An explanation as to why hydrogen bonding should affect the absorption to such an extent can be found by considering the results of NTO (natural transition orbital) analysis of the S0 → S1 excitation in complex 2. This excitation is dominated (>90%) by the transition between one NTO donor–acceptor pair, as shown in Fig. 6. Qualitatively, this excitation can be characterized as a d–d transition with significant admixture (∼30%) from a filled catecholate π* orbital to the donor state: Co(dyz) − cat(π*) → Co(dz2). The catecholate π* orbital in turn is dominated by the two O(pz) contributions. We note that the solvent has negligible influence on orbital compositions and characters (the values given are for CHCl3). Also note that we take the trans N–Co–N axis as the z-axis, with the y-axis along the C2 axis (see ESI†).
Hence the electron density in the first excited state of 2 is shifted to a metal-centred d-orbital, which is largely isolated from the surrounding medium (and therefore largely inaccessible for specific interactions with the solvent). The donor NTO, however, has significant catecholate π*/O(pz) character. The structure of complex 2 (see Fig. 1) suggests that the only sites available for accepting hydrogen bonds are the oxygen atoms of the catecholate ligands. Therefore, hydrogen bonding between the solvent and these oxygens is expected to remove electron density from the catecholate-based π* orbital, and therefore stabilize the donor NTO in hydrogen bond-donating solvents relative to solvents that cannot donate hydrogen bonds. Hence, hydrogen bond-donating solvents should indeed manifest increased negative solvatochromism (i.e. an increase in excitation energy with solvation strength) relative to solvents that cannot hydrogen bond, precisely as observed.
In further support of this, we fitted the experimental excitation energies with a linear model incorporating both fO(ε) and the Kamlet–Taft α-parameter,55 which is a measure of the hydrogen bond donor ability of a solvent. This model should therefore account for the additional blue-shifting of the band in hydrogen bond-donating solvents. As is evident from Fig. 7, this model indeed reproduces the observed solvatochromic trend more closely than the purely electrostatic model of Fig. 5, thus confirming that electrostatic stabilization and hydrogen bond donation are the two essential solvation components at play in this case. It is interesting to note that the empirical Dimroth–Reichardt ET(30) parameter, which captures the experimental trend very well (Fig. 4), has long been recognized to correlate strongly with the hydrogen bond donation parameter, α.56
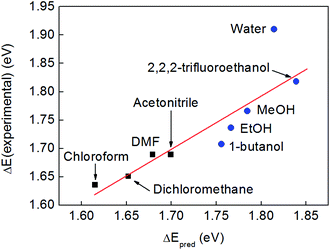 | ||
| Fig. 7 A plot of the experimental excitation energies against the predictions from a linear model incorporating the Onsager function fO(ε) and the Kamlet–Taft α-parameter for hydrogen bond donor strength (taken from ref. 56). The linear fit function is ΔEpred = 1.345 eV + 0.695 fO(ε) + 0.109 α. Non-hydrogen bonding solvents are depicted with black squares, hydrogen bonding solvents with blue circles. | ||
Prediction of the properties of complex 3 and its synthesis
In order to obtain an independent (experimental) verification of the effects that pure electrostatics and hydrogen bonding have upon the solvatochromism displayed by complex 2, complex 3 was synthesized by the general route followed for complexes 1 and 2 (see below). The rationale behind this was both to test the applicability of the synthetic procedure to another class of bidentate ligand, and to replace the oxygen ligands of complex 2 with sulfur ligands. Sulfur is a weaker hydrogen bond acceptor than oxygen, as indicated by the positions of phenol (0.30) and thiophenol (0.16) on Abraham's hydrogen bond acceptor strength scale.57 Hence, we hypothesized that any solvatochromic shift due to hydrogen bonding interactions with the solvent should be much less pronounced for complex 3 than for complex 2.Prior to the synthesis of 3, TD-DFT calculations were performed on the target structure in order to estimate the magnitude of the solvatochromic effect that might be expected on the basis of pure electrostatic solvation in the absence of hydrogen bonding. These calculations identified the S0 → S2 excitation as being responsible for the visible absorption band of complex 3. S1, which was calculated to be 0.02 eV below S2, had hardly any intensity (f ≈ 10−4) and the higher excited states were again well-separated (by ≥0.4 eV), as was also the case for complex 2. When compared to complex 2, the lowest energy absorption of complex 3 was ∼0.06 eV lower in energy (in CHCl3). The dipole moments for complex 3 in chloroform were calculated to be μS0 = 13.84 D and μS2 = 11.40 D (compared to μS0 = 13.33 D, μS1 = 9.26 D for complex 2 – see above). Hence, whilst complex 3 was also predicted to display a negative solvatochromic shift, this effect was predicted to be weaker for complex 3 than for complex 2 on account of the smaller difference in dipole moments between the ground and excited states in complex 3.
NTO analysis of the S0 → S2 excitation of complex 3 again showed domination (∼90%) by one NTO donor–acceptor pair (Fig. 8). Qualitatively, this excitation is a d–d transition with admixture of ∼30% S(pz) character to the donor NTO. Compared to complex 2, there is a higher metal d contribution to the donor orbital (58% vs. 47%), at the expense of the benzene π* contribution, which is negligible in complex 3. The acceptor NTO has ∼65% d character for both complex 2 and complex 3. Overall, the calculations suggest that, compared to complex 2, the visible band of complex 3 should be red-shifted and subject to a diminished negative solvatochromic effect, particularly in hydrogen bond-donating solvents.
Complex 3 was then synthesized by the route shown in Scheme 2. This was highly analogous to the route followed for the catecholate complexes, with the exception that upon addition of o-benzenedithiol the reaction mixture became dark green almost at once and the addition of Et3N was not necessary in order to isolate the product (see Experimental section). The yield of complex 3 was, however, consistently much lower than that obtained for the catecholate analogues (<20%). Again, the similarity between the 1H NMR spectra of complexes 1, 2 and 3 (see ESI†) indicated that complex 3 shared the same basic structure as that found for complex 2, with the cobalt present in the +III oxidation state.
Redox chemistry of complex 3
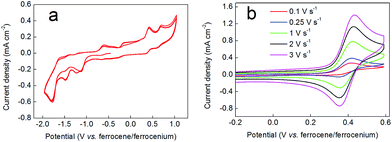
Fig. 9 shows cyclic voltammograms for complex 3. The full range CV (panel (a)) shows numerous irreversible and quasi-reversible processes. Panel (b) then shows a scan-rate dependency assay on the first oxidative redox wave occurring at around +0.4 V vs. ferrocene/ferrocenium. At low scan rates (0.1 V s−1 and below) this wave appears to be largely irreversible. However, as the scan rate is increased, the wave becomes more reversible, being essentially fully reversible at 3 V s−1. EPR spectroscopy was used to probe this behaviour further. Hence, compound 3 was oxidized chemically by treatment with NOBF4, yielding a dark brown solution. In contrast to the EPR spectrum obtained when compound 2 was oxidized with NOBF4, the spectrum of compound 3 upon oxidation revealed a single sharp line without hyperfine splitting at g ∼2.006. This again is the hallmark of a ligand-centred oxidation, and the absence of 59Co hyperfine coupling suggests that the signal stems from a trace amount of uncoordinated dithiobenzosemiquinone radical in the sample. This is consistent with the lifetime of the signal (which vanished after only two hours) and highlights the notable difference in stability between benzosemiquinone and dithiobenzosemiquinone radicals, with the former being considerably more long-lived than the latter.On the basis of the EPR and electrochemical data, we therefore propose that the scan rate-dependent wave in the cyclic voltammogram is due to oxidation of the benzenedithiolate ligand, which is accompanied by dissociation of this ligand from the metal centre and consequent decomposition of complex 3. However, the electrochemistry suggests that if re-reduction follows oxidation rapidly enough, then dissociation of the benzenedithiolate ligand can be prevented and the structure of complex 3 can be preserved.
Solvatochromic behaviour of complex 3 and comparison to that of complex 2
Electronic spectra of complex 3 were collected in various solvents (see Fig. 10a and S16†) and plotted on the ET(30) solvent polarity scale of Dimroth and Reichardt as for complex 2. This revealed that the hydrogen bonding solvents ethanol and methanol did not conform to the linear trend predicted by this scale (we note that complex 3 is not soluble in water or 1-butanol). This is perhaps not unexpected, as the Dimroth–Reichardt scale reflects to a significant extent the effect of hydrogen bonding of the solvent to the solute.51 Therefore, the fact that the positions of λmax in methanol and ethanol predicted by the Dimroth–Reichardt scale do not agree with the observed positions of these absorbances serves as evidence that hydrogen bonding is insignificant for the solvatochromism displayed by complex 3. Indeed, Fig. 10b compares the experimental excitation energies (ΔE(experimental), obtained from the λmax values given in Fig. 10a) with the S2 excitation energies (ΔE(S2)) calculated for complex 3 on the basis of pure electrostatic solvation (i.e. in the absence of hydrogen bonding). When plotted on the same scale as the analogous data for complex 2 (see Fig. 5), the positions of methanol and ethanol no longer appear anomalous, but are instead in agreement with what one might expect in the case of purely electrostatic solvation, where hydrogen bonding plays an insignificant role. Overall, therefore, these data suggest that complex 3 does indeed constitute a model for the behaviour of complex 2 but where the effects of hydrogen bonding have been eliminated.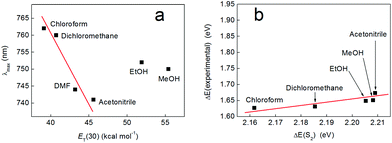 | ||
| Fig. 10 (a) Wavelength of the lowest energy absorption band of compound 3 as a function of solvent polarity, plotted on the Dimroth–Reichardt ET scale. Solutions were at a concentration of 1.9 mM for all samples, with the exception of those taken in acetonitrile and DMF (both 1.6 mM). (b) A plot of the experimental excitation energies (obtained from the band maxima given in panel (a)) and the energies of the S2 excited singlet state calculated by TD-DFT (ωB97-XD/def2-TZVP/PCM). The scale has been chosen to allow comparison with Fig. 5. The red lines in both panels are provided as guides to the eye. | ||
It is interesting to note that a difference in solvatochromic behaviour between the catecholate and benzenedithiolate analogues of a transition metal–bipyridine complex such as that shown by complexes 2 and 3 is not a general phenomenon. For example, Kumar et al. observed a solvent-dependent shift in absorbance of 83 nm (from 495 nm in methanol to 578 nm in chloroform) with [PtII(2,2′-bipyridine)(o-catecholate)], but they also found an almost identical shift (76 nm) was obtained in these same solvents with the dithiolate analogue [PtII(2,2′-bipyridine)(3,4-dimercaptotoluene)].49
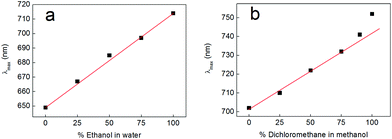
Having obtained these insights into the factors contributing to the solvent-dependent absorbance of complexes 2 and 3, we chose to investigate the effects that mixed solvent systems had on the solvatochromism of complex 2. Fig. 11 shows the outcome of these experiments, where complex 2 was dissolved in mixtures of ethanol and water (Fig. 11a) and mixtures of dichloromethane and methanol (Fig. 11b). In the case of the ethanol–water mixtures, the absorbance of complex 2 shifts in a linear fashion with the changing nature of the solvent over the whole range of compositions, indicating that there is no preferential solvation of complex 2 by either solvent (i.e. the composition of the solvent system in the cybotactic region of the solute is essentially the same as in the bulk).58,59 In the case of dichloromethane–methanol mixtures, the absorbance of complex 2 again shifts in a linear fashion over most of the compositional range, but there is now some deviation away from ideal behaviour at high ratios of dichloromethane to methanol (above 3![[thin space (1/6-em)]](https://www.rsc.org/images/entities/char_2009.gif) :
:![[thin space (1/6-em)]](https://www.rsc.org/images/entities/char_2009.gif) 1). This suggests that some preferential solvation of complex 2 by methanol does indeed occur. This is perhaps unsurprising given that methanol is a hydrogen bond-donating solvent and the spectroscopic results described above show that complex 2 accepts hydrogen bonds through its catecholate oxygen atoms. However, even for these dichloromethane–methanol mixtures, the graph remains linear as far as a ratio of 3
1). This suggests that some preferential solvation of complex 2 by methanol does indeed occur. This is perhaps unsurprising given that methanol is a hydrogen bond-donating solvent and the spectroscopic results described above show that complex 2 accepts hydrogen bonds through its catecholate oxygen atoms. However, even for these dichloromethane–methanol mixtures, the graph remains linear as far as a ratio of 3![[thin space (1/6-em)]](https://www.rsc.org/images/entities/char_2009.gif) :
:![[thin space (1/6-em)]](https://www.rsc.org/images/entities/char_2009.gif) 1 dichloromethane to methanol. Hence, within the linear regions of these graphs at least, there remains the possibility that the percentage of each solvent in mixtures with intermediate compositions could be discerned on the basis of the absorbance of complex 2. Whilst these results are somewhat preliminary, we believe that this concept could be extended to allow molecular probes incorporating complex 2 to be used to determine solvent compositions on the basis of colour in a variety of mixed solvent systems.
1 dichloromethane to methanol. Hence, within the linear regions of these graphs at least, there remains the possibility that the percentage of each solvent in mixtures with intermediate compositions could be discerned on the basis of the absorbance of complex 2. Whilst these results are somewhat preliminary, we believe that this concept could be extended to allow molecular probes incorporating complex 2 to be used to determine solvent compositions on the basis of colour in a variety of mixed solvent systems.
Conclusions
In summary, we have synthesized three complexes of the type [CoIII(L)(bipyridine)2]+ (L = o-catecholato, o-benzenedithiolato) by a general and rapid one-pot reaction route, which is near-quantitative for the catecholate compounds. Complexes 2 and 3 were previously unreported and display intriguing differences in their solution-phase UV-vis absorption behaviour. Specifically, the position of λmax in complex 2 was highly sensitive to the hydrogen bond donation ability of the surrounding medium, whereas in the benzenedithiolate analogue 3 it was not. TD-DFT was used to compare the ground and excited state electronic structures of complexes 2 and 3. Hence it was determined that complex 2 hydrogen-bonds to the solvent through the oxygen atoms on its catecholate ligand. This interaction removes electron density from the catecholate-based π* orbital, thereby stabilizing the ground state with respect to the excited state (which is primarily metal-centred and hence more isolated from the solvent). This has the effect of increasing the excitation energy in hydrogen bond-donating solvents relative to those that cannot hydrogen bond. In complex 3 on the other hand, the sulfur atoms in the chelating benzenedithiolate ligand are much weaker hydrogen bond acceptors than oxygen, and so stabilization of the ground state through hydrogen bonding to the solvent is effectively eliminated. The (much smaller) solvatochromic effect that manifests in complex 3 can be explained on a purely electrostatic basis. Given the wide range of functionalized bipyridines, catechols and benzenedithiols that are available, we believe that the synthesis of an enormous diversity of allied complexes should be possible. In particular, we foresee potential for such compounds to be tailored for use as molecular probes60 or solvatochromic indicators61 that can give insight into different solvent and chemical environments by virtue of readily-observed spectroscopic changes.Acknowledgements
We acknowledge the University of Glasgow and the EPSRC (grant numbers EP/K031732/1 and EP/L023652/1) for funding. MDS thanks the University of Glasgow for a Kelvin Smith Research Fellowship. The data which underpin this work are available at http://dx.doi.org/10.5525/gla.researchdata.350 and are licensed CC BY-SA 4.0. We thank the EPSRC UK National Crystallographic Service at the University of Southampton for single crystal data collection. CCDC 1452332 contains the supplementary crystallographic data for this paper.References
- W. Paw and R. Eisenberg, Inorg. Chem., 1997, 36, 2287 CrossRef CAS PubMed.
- D. Ruiz-Molina, L. N. Zakharov, A. L. Rheingold and D. N. Hendrickson, J. Phys. Chem. Solids, 2004, 65, 831 CrossRef CAS.
- A. Panja, RSC Adv., 2013, 3, 4954 RSC.
- Y. Suenaga and C. G. Pierpont, Inorg. Chem., 2005, 44, 6183 CrossRef CAS PubMed.
- Y. Suenaga, Y. Umehata, Y. Hirano, T. Minematsu and C. G. Pierpont, Inorg. Chim. Acta, 2008, 361, 2941 CrossRef CAS.
- Y. Suenaga, Y. Hirano, Y. Umehata and T. Minematsu, Inorg. Chim. Acta, 2011, 365, 505 CrossRef CAS.
- D. Ruiz, J. Yoo, I. A. Guzei, A. L. Rheingold and D. N. Hendrickson, Chem. Commun., 1998, 2089 RSC.
- A. Witt, F. W. Heinemann, S. Sproules and M. M. Khusniyarov, Chem. – Eur. J., 2014, 20, 11149 CrossRef CAS PubMed.
- W. Kaim, Inorg. Chem., 2011, 50, 9752 CrossRef CAS PubMed.
- V. Lyaskovskyy and B. de Bruin, ACS Catal., 2012, 2, 270 CrossRef CAS.
- M. Affronte, A. Beni, A. Dei and L. Sorace, Dalton Trans., 2007, 5253 RSC.
- V. K. Andrä and F. Fleischer, Z. Anorg. Allg. Chem., 1982, 486, 210 CrossRef.
- N. G. Connelly, J. A. McCleverty and C. J. Winscom, Nature, 1967, 216, 999 CrossRef CAS.
- J. A. McCleverty, N. M. Atherton, N. G. Connelly and C. J. Winscom, J. Chem. Soc. A, 1969, 2242 RSC.
- J. A. McCleverty, Prog. Inorg. Chem., 1968, 10, 49 CrossRef CAS.
- S. Sproules and K. Wieghardt, Coord. Chem. Rev., 2010, 254, 1358 CrossRef CAS.
- G. R. Hanson, K. E. Gates, C. J. Noble, M. Griffin, A. Mitchell and S. Benson, J. Inorg. Biochem., 2004, 98, 903 CrossRef CAS PubMed.
- M. J. Frisch, G. W. Trucks, H. B. Schlegel, G. E. Scuseria, M. A. Robb, J. R. Cheeseman, G. Scalmani, V. Barone, B. Mennucci, G. A. Petersson, H. Nakatsuji, M. Caricato, X. Li, H. P. Hratchian, A. F. Izmaylov, J. Bloino, G. Zheng, J. L. Sonnenberg, M. Hada, M. Ehara, K. Toyota, R. Fukuda, J. Hasegawa, M. Ishida, T. Nakajima, Y. Honda, O. Kitao, H. Nakai, T. Vreven, J. A. Montgomery Jr., J. E. Peralta, F. Ogliaro, M. Bearpark, J. J. Heyd, E. Brothers, K. N. Kudin, V. N. Staroverov, R. Kobayashi, J. Normand, K. Raghavachari, A. Rendell, J. C. Burant, S. S. Iyengar, J. Tomasi, M. Cossi, N. Rega, N. J. Millam, M. Klene, J. E. Knox, J. B. Cross, V. Bakken, C. Adamo, J. Jaramillo, R. Gomperts, R. E. Stratmann, O. Yazyev, A. J. Austin, R. Cammi, C. Pomelli, J. W. Ochterski, R. L. Martin, K. Morokuma, V. G. Zakrzewski, G. A. Voth, P. Salvador, J. J. Dannenberg, S. Dapprich, A. D. Daniels, Ö. Farkas, J. B. Foresman, J. V. Ortiz, J. Cioslowski and D. J. Fox, Gaussian 09, Revision D.01, Gaussian, Inc., Wallingford, CT, 2013 Search PubMed.
- J. M. Tao, J. P. Perdew, V. N. Staroverov and G. E. Scuseria, Phys. Rev. Lett., 2003, 91, 146401 CrossRef PubMed.
- S. Grimme, J. Antony, S. Ehrlich and H. Krieg, J. Chem. Phys., 2010, 132, 154104 CrossRef PubMed.
- F. Weigend and R. Ahlrichs, Phys. Chem. Chem. Phys., 2005, 7, 3297 RSC.
- F. Weigend, Phys. Chem. Chem. Phys., 2006, 8, 1057 RSC.
- J. D. Chai and M. Head-Gordon, Phys. Chem. Chem. Phys., 2008, 10, 6615 RSC.
- R. L. Martin, J. Chem. Phys., 2003, 118, 4775 CrossRef CAS.
- G. A. Andrienko, ChemCraft, v. 1.8(445), http://www.chemcraftprog.com (accessed, July 2016) Search PubMed.
- M. Rudolph, T. Ziegler and J. Autschbach, Chem. Phys., 2011, 391, 92 CrossRef CAS.
- S. J. Coles and P. A. Gale, Chem. Sci., 2012, 3, 683 RSC.
- A. L. Spek, Acta Crystallogr., Sect. C: Cryst. Struct. Commun., 2015, 71, 9 CrossRef CAS PubMed.
- F. H. Allen, Acta Crystallogr., Sect. B: Struct. Sci., 2002, 58, 380 CrossRef.
- C. R. Groom, I. J. Bruno, M. P. Lightfoot and S. C. Ward, Acta Crystallogr., Sect. B: Struct. Sci., 2016, 72, 171 CrossRef CAS PubMed.
- S. N. Brown, Inorg. Chem., 2012, 51, 1251 CrossRef CAS PubMed.
- See, for example: J. J. Loughrey, N. J. Patmore, A. Baldansuren, A. J. Fielding, E. J. L. McInnes, M. J. Hardie, S. Sproules and M. A. Halcrow, Chem. Sci., 2015, 6, 6935 RSC.
- C. G. Pierpont and R. M. Buchanan, Coord. Chem. Rev., 1981, 38, 45 CrossRef CAS.
- C. G. Pierpont, Coord. Chem. Rev., 2001, 216–217, 99 CrossRef CAS.
- C. G. Pierpont, Coord. Chem. Rev., 2001, 219–221, 415 CrossRef CAS.
- C. G. Pierpont, S. K. Larsen and S. R. Boone, Pure Appl. Chem., 1988, 60, 1331 CrossRef CAS.
- C. G. Pierpont and C. W. Lange, Prog. Inorg. Chem., 1994, 41, 331 CrossRef CAS.
- P. A. Wicklund, L. S. Beckmann and D. G. Brown, Inorg. Chem., 1976, 15, 1996 CrossRef CAS.
- A. Vlček Jr., J. Klíma and A. A. Vlček, Inorg. Chim. Acta, 1983, 69, 191 CrossRef.
- R. M. Buchanan and C. G. Pierpont, J. Am. Chem. Soc., 1980, 102, 4951 CrossRef CAS.
- S. Arzberger, J. Soper, O. P. Anderson, A. la Cour and M. Wicholas, Inorg. Chem., 1999, 38, 757 CrossRef CAS PubMed.
- C. Milsmann, E. Bothe, E. Bill, T. Weyhermüller and K. Wieghardt, Inorg. Chem., 2009, 48, 6211 CrossRef CAS PubMed.
- L. I. Simándi, T. Barna, G. Argay and T. L. Simándi, Inorg. Chem., 1995, 34, 6337 CrossRef.
- A. Bencini, C. A. Daul, A. Dei, F. Mariotti, H. Lee, D. A. Shultz and L. Sorace, Inorg. Chem., 2001, 40, 1582 CrossRef CAS PubMed.
- K. S. Min, A. G. DiPasquale, J. A. Golen, A. L. Rheingold and J. S. Miller, J. Am. Chem. Soc., 2007, 129, 2360 CrossRef CAS PubMed.
- K. G. Alley, G. Poneti, P. S. D. Robinson, A. Nafady, B. Moubaraki, J. B. Aitken, S. C. Drew, C. Richie, B. F. Abrahams, R. K. Hocking, K. S. Murray, A. M. Bond, H. H. Harris, L. Sorace and C. Boskovic, J. Am. Chem. Soc., 2013, 135, 8304 CrossRef CAS PubMed.
- A. Hudson and G. R. Luckhurst, Chem. Rev., 1969, 69, 191 CrossRef CAS.
- A. Vogler and H. Kunkely, J. Am. Chem. Soc., 1981, 103, 1559 CrossRef CAS.
- L. Kumar, K. H. Puthraya and T. S. Srivastava, Inorg. Chim. Acta, 1984, 86, 173 CrossRef CAS.
- K. H. Puthraya and T. S. Srivastava, Polyhedron, 1985, 4, 1579 CrossRef CAS.
- C. Reichardt, Chem. Rev., 1994, 94, 2319 CrossRef CAS.
- C. Reichardt and T. Welton, Solvents and Solvent Effects in Organic Chemistry, Wiley-VCH, Weinheim, 4th edn, 2011 Search PubMed.
- L. Onsager, J. Am. Chem. Soc., 1936, 58, 1486 CrossRef CAS.
- J. P. Cerón-Carrasco, D. Jacquemin, C. Laurence, A. Planchat, C. Reichardt and K. Sraïdi, J. Phys. Org. Chem., 2014, 27, 512 CrossRef.
- M. J. Kamlet, J.-L. M. Abboud, M. H. Abraham and R. W. Taft, J. Org. Chem., 1983, 48, 2877 CrossRef CAS.
- Y. Marcus, Chem. Soc. Rev., 1993, 22, 409 RSC.
- M. H. Abraham, Chem. Soc. Rev., 1993, 22, 73 RSC.
- P. M. E. Mancini, A. Terenzani, M. G. Gasparri and L. R. Vottero, J. Phys. Org. Chem., 1995, 8, 617 CrossRef CAS.
- F. Gharib, A. Shamel, F. Jaberi and A. Farajtabar, J. Solution Chem., 2013, 42, 1083 CrossRef CAS.
- S. Herrmann, J. T. Margraf, T. Clark and C. Streb, Chem. Commun., 2015, 51, 13702 RSC.
- P. L. Silva, E. L. Bastos and O. A. El Seoud, J. Phys. Chem. B, 2007, 111, 6173 CrossRef CAS PubMed.
Footnote |
| † Electronic supplementary information (ESI) available: 1H NMR spectra of complexes 1–3, additional EPR, PXRD, TGA, computational and UV-vis results and crystallographic data for complex 2. CCDC 1452332. For ESI and crystallographic data in CIF or other electronic format see DOI: 10.1039/c6dt02807a |
| This journal is © The Royal Society of Chemistry 2016 |

