 Open Access Article
RE16AuxAl13−x with RE = La–Nd, Sm (x ≤ 3.37): synthesis, crystal structure and physical properties of an intermetallic solid solution with barrelane analogue units†
Frank
Stegemann
a and
Oliver
Janka
*ab
aInstitut für Anorganische und Analytische Chemie, Westfälische Wilhelms-Universität, Corrensstrasse 30, 48149 Münster, Germany. E-mail: ocjanka@uni-muenster.de
bInstitut für Chemie, Carl von Ossietzky Universität Oldenburg, Carl-von-Ossietzky-Strasse 9-11, 26129 Oldenburg, Germany
First published on 8th August 2016
Abstract
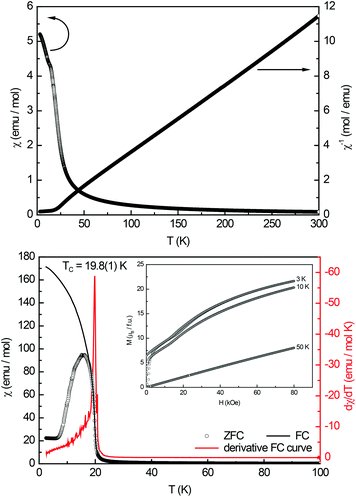
During phase analytical investigations in the rare-earth element rich side of the ternary system cerium–gold–aluminum, the new ternary rare-earth (RE) gold aluminides with a composition of RE16AuxAl13−x (RE = La–Nd, Sm, x ≤ 3.37) have been synthesized first by reactive eutectics of RE/Au with Al. Single crystals of high quality can be obtained by this method. The title compounds can be selectively prepared by annealing arc-melted beads of appropriate composition below the peritectic point of the respective system. Like prototypic La16Al13, the representatives of the solid solution RE16AuxAl13−x (RE = La–Nd, Sm; x ≤ 3.37) crystallize in the hexagonal crystal system (space group P![[6 with combining macron]](https://www.rsc.org/images/entities/char_0036_0304.gif) 2m, a = 916.6–890.4 pm, c = 1122.4–1090.1 pm) with one formula unit per unit cell. Single crystal investigations revealed Au/Al mixing on three of the four crystallographic aluminum sites. These sites form an empty (Au/Al)11 barrelane analogous unit, coordinated solely by the respective rare-earth atoms. In addition one independent Al site with a fivefold capped trigonal prismatic arrangement, a so called Edshammar polyhedron, exists. Magnetic measurements of Ce16Au3Al10 revealed two antiferromagnetic transitions with Neél-temperatures of 7.7(1) and 2.7(1) K and a magnetic moment of μeff = 2.48(1) μB, Pr16Au3Al10 shows ferromagentic ordering with a Curie-temperature of 19.8(1) K and a magnetic moment of μeff = 3.58(1) μB.
2m, a = 916.6–890.4 pm, c = 1122.4–1090.1 pm) with one formula unit per unit cell. Single crystal investigations revealed Au/Al mixing on three of the four crystallographic aluminum sites. These sites form an empty (Au/Al)11 barrelane analogous unit, coordinated solely by the respective rare-earth atoms. In addition one independent Al site with a fivefold capped trigonal prismatic arrangement, a so called Edshammar polyhedron, exists. Magnetic measurements of Ce16Au3Al10 revealed two antiferromagnetic transitions with Neél-temperatures of 7.7(1) and 2.7(1) K and a magnetic moment of μeff = 2.48(1) μB, Pr16Au3Al10 shows ferromagentic ordering with a Curie-temperature of 19.8(1) K and a magnetic moment of μeff = 3.58(1) μB.
Introduction
The binary phase diagrams of La–Al1 and Ce–Al2 contain several intermetallic aluminides. At room temperature the phases RE3Al11 (orthorhombic, Pnma, La3Al11 type),3 REAl3 (hexagonal, P63/mmc, Ni3Sn type),4,5 REAl2 (cubic, Fd![[3 with combining macron]](https://www.rsc.org/images/entities/char_0033_0304.gif) m, MgCu2 type),6 REAl (orthorhombic, Cmcm, CeAl type),7,8 and RE3Al (hexagonal, P63/mmc, Mg3Cd type)5 exist. In contrast to the other aluminides, RE3Al contains no direct Al–Al contacts due to the low Al content. Additionally, the high temperature phase (La0.88Al0.12)Al2 with AlB2 type structure exists in the La–Al system between 1363 and 1513 K.4 This phase has not been found in the Ce–Al system yet. Ce3Al transforms into its β-phase (cubic, Pm
m, MgCu2 type),6 REAl (orthorhombic, Cmcm, CeAl type),7,8 and RE3Al (hexagonal, P63/mmc, Mg3Cd type)5 exist. In contrast to the other aluminides, RE3Al contains no direct Al–Al contacts due to the low Al content. Additionally, the high temperature phase (La0.88Al0.12)Al2 with AlB2 type structure exists in the La–Al system between 1363 and 1513 K.4 This phase has not been found in the Ce–Al system yet. Ce3Al transforms into its β-phase (cubic, Pm![[3 with combining macron]](https://www.rsc.org/images/entities/char_0033_0304.gif) m, Cu3Au type) at temperatures above 523 K.9,10 For this compound also a monoclinic low temperature form (monoclinic, P21/m, Ce3Al type) has been found below 115 K.11 Also HT-LaAl4 and HT-CeAl4, crystallizing in the BaAl4 type structure (tetragonal, I4/mmm) have been prepared.5,6 Finally, La3Al2
m, Cu3Au type) at temperatures above 523 K.9,10 For this compound also a monoclinic low temperature form (monoclinic, P21/m, Ce3Al type) has been found below 115 K.11 Also HT-LaAl4 and HT-CeAl4, crystallizing in the BaAl4 type structure (tetragonal, I4/mmm) have been prepared.5,6 Finally, La3Al2![[thin space (1/6-em)]](https://www.rsc.org/images/entities/char_2009.gif) 12 as well as La5Al4
12 as well as La5Al4![[thin space (1/6-em)]](https://www.rsc.org/images/entities/char_2009.gif) 13 were reported to crystallize in the hexagonal crystal system (P
13 were reported to crystallize in the hexagonal crystal system (P![[6 with combining macron]](https://www.rsc.org/images/entities/char_0036_0304.gif) 2m) with lattice parameters of a ∼ 926 and c ∼ 1120 pm. The structure of “La5Al4” was refined from powder X-ray diffraction data and was found to exhibit two mixed occupied crystallographic positions. Niewa and co-workers later reported the crystal structure of La16Al13 (P
2m) with lattice parameters of a ∼ 926 and c ∼ 1120 pm. The structure of “La5Al4” was refined from powder X-ray diffraction data and was found to exhibit two mixed occupied crystallographic positions. Niewa and co-workers later reported the crystal structure of La16Al13 (P![[6 with combining macron]](https://www.rsc.org/images/entities/char_0036_0304.gif) 2m, a = 917 pm, c = 1122 pm),14 along with physical property measurements and bonding analysis, concluding that their reported composition corresponds to what has previously been reported as La3Al2 and La5Al4. The structure could be refined based on single crystal diffraction data, without any mixed occupational sites. A similar binary cerium compound however has not been reported yet.
2m, a = 917 pm, c = 1122 pm),14 along with physical property measurements and bonding analysis, concluding that their reported composition corresponds to what has previously been reported as La3Al2 and La5Al4. The structure could be refined based on single crystal diffraction data, without any mixed occupational sites. A similar binary cerium compound however has not been reported yet.
In the ternary system Ce–Au–Al a number of compounds have been found, the majority being Al-rich. Fig. 1 shows the at room temperature stable compounds along with the respective binary compounds. Besides the equiatomic CeAuAl15 also four members of the solid solution CeAuxAl4−x with x = 1, 1.5, 2 and 2.5 have been reported.16 Finally CeAu3Al7, obtained from an Al flux reaction, has been reported in 2003 by Latturner et al.17 During exploratory investigations in the rare-earth element rich side of the Ce–Au–Al system, single crystals of Ce16Au3.37(1)Al9.63(1) (La16Al13 type, P![[6 with combining macron]](https://www.rsc.org/images/entities/char_0036_0304.gif) 2m, a = 896.47(3), c = 1097.52(3) pm) could be obtained from an annealed arc-melted button along with the isostructural La16Au2.85(1)Al10.15(1) (La16Al13 type, P
2m, a = 896.47(3), c = 1097.52(3) pm) could be obtained from an annealed arc-melted button along with the isostructural La16Au2.85(1)Al10.15(1) (La16Al13 type, P![[6 with combining macron]](https://www.rsc.org/images/entities/char_0036_0304.gif) 2m, a = 909.09(3), c = 1113.15(4) pm) compound. Herein we report on the synthesis, crystal structures, and thermoanalytical investigations of the title compounds as well as on the physical properties of RE16Au3Al10 with RE = La–Pr.
2m, a = 909.09(3), c = 1113.15(4) pm) compound. Herein we report on the synthesis, crystal structures, and thermoanalytical investigations of the title compounds as well as on the physical properties of RE16Au3Al10 with RE = La–Pr.
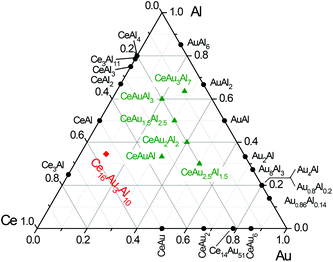 | ||
| Fig. 1 Isothermic section of the ternary system Ce–Au–Al at room temperature. The known ternary compounds within this system are colored green, the new compound Ce16Au3Al10 is shown in red. | ||
Results and discussion
Phase diagram and thermoanalytical investigations
In the binary systems Ce–Au, Ce–Al and Au–Al a large number of compounds are known. However only a few ternary representatives have been reported. Especially the rare-earth element rich side of the ternary system Ce–Au–Al has been empty so far. In Fig. 1 the known compounds of the system Ce–Au–Al are shown along with the here reported compound. During investigations of the rare-earth element rich side in this system, single crystals with sizes above 250 μm could be obtained from an annealed arc-melted ingot with a nominal composition of 4-1-1, when searching for new Gd4RhIn type aluminides.18 Investigations of the binary phase diagram revealed that at compositions of 84 at% Ce and 16 at% Au and 89 at% Ce and 11 at% Al eutectics with melting points of 793 K and 853 K can be found.19 Annealing above this temperature therefore enables a reactive flux assisted growth of thermodynamically stable phases. The advantages of metal fluxes for preparative solid state chemistry are well known and have been extensively used to obtain high purity crystals for property investigations.20The obtained crystals have been investigated by single crystal X-ray diffraction (vide infra). In order to learn more about this system, thermoanalytical investigations have been performed on pieces of the unannealed 4-1-1 buttons. Two endothermic energy peaks at T1 = 829 K, T2 = 845 K are clearly visible upon heating (Fig. 2, top) and two, slightly shifted, exothermic peaks upon cooling. The endothermic peaks can be interpreted as melting points, the two peaks upon cooling were consequently attributed to be the crystallization of Ce16Au∼3Al∼10 and the solidification of the remaining melt. In a consecutive step, a fragment of an unannealed button of stoichiometric Ce16Au3Al10 has been investigated with the help of SDT measurements (Fig. 2, bottom). Only one energy peak at T = 946 K can be observed, corresponding to the melting/decomposition of the respective single phase compound. Niewa and co-workers reported La16Al13 to melt peritectically at T = 818 K, therefore the specimen prepared for physical property measurements (RE16Au3Al10, RE = La–Pr) were consequently annealed at 823 K, well below the respective melting/decomposition temperature.
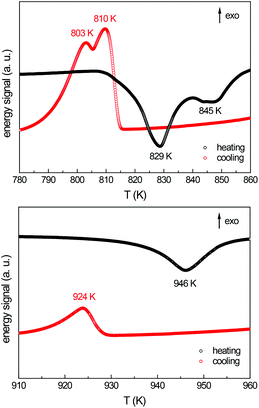 | ||
| Fig. 2 Thermoanalytical investigation of the nominal composition “Ce4AuAl” (top) and a stoichiometric sample with the composition Ce16Au3Al10 (bottom). | ||
Crystal structure
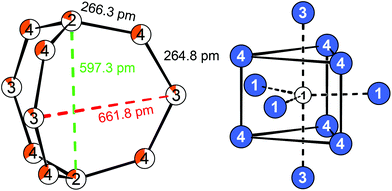
The single crystal data of La16Au2.85(1)Al10.15(1) and Ce16Au3.37(1)Al9.63(1) was refined based on the prototypic crystal structure of La16Al13 in the hexagonal crystal system with space group P![[6 with combining macron]](https://www.rsc.org/images/entities/char_0036_0304.gif) 2m (no. 189).14 All eight crystallographic sites were identified by Superflip21 and a correct assignment of the rare-earth and aluminum atoms was achieved in comparison with the literature. The structure was subsequently refined using Jana2006.22,23 All crystallographic sites occupied by a rare-earth atom are solely occupied by the respective element. However, three of the four crystallographic Al sites, were found to exhibit significantly increased electron density. Those sites were refined as mixed-occupied with gold. These three sites form an 11-atomic [3.3.3]-barrelane analogue unit, while the fourth crystallographic Al site shows no mixed-occupation at all. The interatomic distances within the cage-like fragment range between 263–264 pm, which is slightly above the sum of the covalent radii (Al–Al: 250 pm, Au–Al: 259 pm)24 and close to the shortest distances for binary intermetallic aluminides (Ce3Al11: Al–Al = 262–291 pm) (Fig. 3, left).
2m (no. 189).14 All eight crystallographic sites were identified by Superflip21 and a correct assignment of the rare-earth and aluminum atoms was achieved in comparison with the literature. The structure was subsequently refined using Jana2006.22,23 All crystallographic sites occupied by a rare-earth atom are solely occupied by the respective element. However, three of the four crystallographic Al sites, were found to exhibit significantly increased electron density. Those sites were refined as mixed-occupied with gold. These three sites form an 11-atomic [3.3.3]-barrelane analogue unit, while the fourth crystallographic Al site shows no mixed-occupation at all. The interatomic distances within the cage-like fragment range between 263–264 pm, which is slightly above the sum of the covalent radii (Al–Al: 250 pm, Au–Al: 259 pm)24 and close to the shortest distances for binary intermetallic aluminides (Ce3Al11: Al–Al = 262–291 pm) (Fig. 3, left).
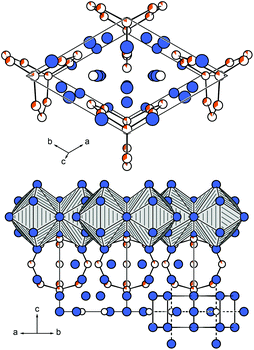
They are also in good agreement compared to La16Al13,14 Tetrakis[bis(trimethylsilyl)methyl]dialan(4), a molecular species with an Al–Al single bond (d(Al–Al) = 266 pm)25 or to the seven atomic cluster species [Al7{N-(SiMe3)2}6]− with distances of d(Al–Al) = 277 pm.26 Within the barrelane unit, the Au/Al2 atom is coordinated by three Au/Al4 atoms. Au/Al3 and Au/Al4 are only twofold coordinated. The Au/Al sites are furthermore coordinated by rare-earth atoms with a total coordination number of 10–12 (Table 4). The isolated Al1 atoms are surrounded symmetrically by eleven rare-earth atoms in the shape of a fivefold capped trigonal prism, also called Edshammar polyhedron, denoted as 11E (Fig. 3, right).27,28 The Edshammar polyhedra form layers within the ab plane with 1/3 of the polyhedra being absent (Fig. 4).
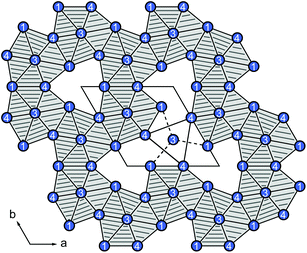 | ||
| Fig. 4 Layer of Edshammar polyhedra within the ab plane with 1/3 of the polyhedra being absent. The rare-earth atoms are depicted in blue, the Al1 atoms center the polyhedra. | ||
The [3.3.3]-barrelane units are located above and below the respective voids. They get sandwiched between the layers of Edshammar-polyhedra (z = 0 and z = 1) whereas the centres of the barrelane units are located at (0, 0, 1/2) (Fig. 5). These cage-like structural fragments, however, are empty with no significant residual electron density. Details of the refinements of the investigated crystals are listed in Tables 2–4. In the case of the cerium compound, a second crystal from a different batch has been investigated by single crystal X-ray diffraction, showing the same composition as well as the same Au to Al distribution on the Au/Al2, Au/Al3 and Au/Al4 sites suggesting the maximum gold content to be close to x ∼ 3.
| x | a (pm) | c (pm) | V (nm3) | Ref. | |
|---|---|---|---|---|---|
| a This work. | |||||
| La16AuxAl13−x | 0 | 916.6 | 1122.4 | 0.8167 | 14 |
| 0 | 917.0(2) | 1122.9(2) | 0.8177 | ||
| 1 | 915.1(2) | 1120.9(2) | 0.8129 | ||
| 2 | 913.1(2) | 1117.9(2) | 0.8072 | ||
| 3 | 911.1(1) | 1115.3(1) | 0.8018 | ||
| Ce16AuxAl13−x | 1 | 900.2(1) | 1102.0(5) | 0.7733 | |
| 2 | 898.7(2) | 1100.3(2) | 0.7695 | ||
| 3 | 897.2(2) | 1099.0(3) | 0.7662 | ||
| Pr16AuxAl13−x | 3 | 894.1(2) | 1094.9(2) | 0.7581 | |
| Nd16AuxAl13−x | 3 | 892.3(3) | 1092.4(4) | 0.7532 | |
| Sm16AuxAl13−x | 3 | 890.4(5) | 1090.1(6) | 0.7485 | |
![[6 with combining macron]](https://www.rsc.org/images/entities/char_0036_0304.gif) 2m, Z = 1
2m, Z = 1
| Further details of the crystal structures investigations may be obtained from the Fachinformationszentrum Karlsruhe, 76344 Eggenstein-Leopoldshafen, Germany (Fax: +49-7247-808-666; E-mail: crysdata@fizkarlsruhe.de, http://www.fiz-karlsruhe.de/en/leistungen/kristallographie/kristallstrukturdepot/order-form-request-for-deposited-data.html) on quoting the depository numbers given above. | ||
|---|---|---|
| Formula | La16Au2.85(1)Al10.15(1) | Ce16Au3.37(1)Al9.63(1) |
| Depository number | 431510 | 431509 |
| Molar mass, g mol−1 | 3057.7 | 3165.5 |
| Lattice parameters, pm | a = 909.09(3) | a = 896.47(3) |
| c = 1113.15(4) | c = 1097.52(3) | |
| Cell volume, nm3 | V = 0.7967 | V = 0.7639 |
| Density calc., g cm−3 | 6.37 | 6.88 |
| Crystal size, μm3 | 10 × 20 × 20 | 40 × 60 × 80 |
| Diffractometer | StadiVari | IPDS-II |
| Transm. ratio (max/min) | 0.949/0.770 | 0.338/0.093 |
| Detector distance, mm | 40 | 80 |
| Exposure time, s | 4 | 300 |
| Integr. param. A, B, EMS | 5.9, −4.5, 0.012 | 9.7, 0.5, 0.012 |
| Range in hkl | ±14; ±14; ±18 | ±13; ±13; −14, 16 |
| F(000), e | 1269 | 1319 |
| θ range, ° | 1.8–35.5 | 1.9–32.1 |
| Absorption coeff., mm−1 | 34.2 | 40.5 |
| No. of reflections | 32![[thin space (1/6-em)]](https://www.rsc.org/images/entities/char_2009.gif) 688 688 |
20![[thin space (1/6-em)]](https://www.rsc.org/images/entities/char_2009.gif) 873 873 |
| Independent reflections, Rint | 1377/0.1062 | 1009/0.0759 |
| Reflections with I > 3σ(I) | 978 | 906 |
| Data/parameters | 1377/37 | 1009/38 |
| Goodness-of-fit | 0.87 | 1.05 |
| R/wR for I > 3σ(I) | 0.0257/0.0490 | 0.0168/0.0338 |
| R/wR for all data | 0.0414/0.0516 | 0.0227/0.0354 |
| Extinction coefficient | 48(12) | 159(8) |
| Flack parameter | 0.01(2) | 0.01(1) |
| Largest diff. peak/hole, e Å−3 | 0.98, −0.91 | 1.50, −1.36 |
| Atom | Wyckoff position | x | y | z | U 11 | U 22 | U 33 | U 12 | U 13 | U eq |
|---|---|---|---|---|---|---|---|---|---|---|
a Refined mixed occupations: Au/Al2 – 0.805(4)![[thin space (1/6-em)]](https://www.rsc.org/images/entities/char_2009.gif) : :![[thin space (1/6-em)]](https://www.rsc.org/images/entities/char_2009.gif) 0.195(4); Au/Al3 – 0.881(3) 0.195(4); Au/Al3 – 0.881(3)![[thin space (1/6-em)]](https://www.rsc.org/images/entities/char_2009.gif) : :![[thin space (1/6-em)]](https://www.rsc.org/images/entities/char_2009.gif) 0.119(3); Au/Al4 – 0.649(2) 0.119(3); Au/Al4 – 0.649(2)![[thin space (1/6-em)]](https://www.rsc.org/images/entities/char_2009.gif) : :![[thin space (1/6-em)]](https://www.rsc.org/images/entities/char_2009.gif) 0.351(2).
b Refined mixed occupations: Au/Al2 – 0.737(4) 0.351(2).
b Refined mixed occupations: Au/Al2 – 0.737(4)![[thin space (1/6-em)]](https://www.rsc.org/images/entities/char_2009.gif) : :![[thin space (1/6-em)]](https://www.rsc.org/images/entities/char_2009.gif) 0.263(4); Au/Al3 – 0.864(3) 0.263(4); Au/Al3 – 0.864(3)![[thin space (1/6-em)]](https://www.rsc.org/images/entities/char_2009.gif) : :![[thin space (1/6-em)]](https://www.rsc.org/images/entities/char_2009.gif) 0.136(3); Au/Al4 – 0.594(2) 0.136(3); Au/Al4 – 0.594(2)![[thin space (1/6-em)]](https://www.rsc.org/images/entities/char_2009.gif) : :![[thin space (1/6-em)]](https://www.rsc.org/images/entities/char_2009.gif) 0.406(2). 0.406(2).
|
||||||||||
| La16Au2.85(1)Al10.15(1) | ||||||||||
| La1 | 3f | 0.25327(10) | 0 | 0 | 189(3) | 159(4) | 191(4) | 80(2) | 0 | 183(3) |
| La2 | 3g | 0.23043(9) | x | 1/2 | 166(3) | = U11 | 161(3) | 101(4) | 0 | 157(3) |
| La3 | 4h | 1/3 | 2/3 | 0.66154(7) | 158(2) | = U11 | 173(3) | 79(1) | 0 | 163(2) |
| La4 | 6i | 0.39061(7) | x | 0.16572(6) | 176(2) | = U11 | 180(2) | 79(2) | −3(2) | 181(2) |
| Al1 | 2c | 1/3 | 2/3 | 0 | 131(14) | = U11 | 190(20) | 65(7) | 0 | 150(12) |
| Au/Al2a | 2e | 0 | 0 | 0.2317(2) | 155(8) | = U11 | 235(13) | 78(4) | 0 | 182(7) |
| Au/Al3a | 3g | 0.4203(3) | 0 | 1/2 | 159(10) | 163(14) | 178(12) | 82(7) | 0 | 166(9) |
| Au/Al4a | 6i | 0.28419(10) | 0 | 0.28973(8) | 167(3) | 188(5) | 159(4) | 94(2) | 0(3) | 169(3) |
| Ce16Au3.37(1)Al9.67(1) | ||||||||||
| Ce1 | 3f | 0.74663(7) | 0 | 0 | 156(2) | 141(3) | 137(2) | 71(1) | 0 | 146(2) |
| Ce2 | 3g | 0.77163(6) | x | 1/2 | 146(2) | = U11 | 125(2) | 93(2) | 0 | 131(2) |
| Ce3 | 4h | 2/3 | 1/3 | 0.33775(5) | 136(1) | = U11 | 146(2) | 68(2) | 0 | 140(1) |
| Ce4 | 6i | 0.61165(5) | x | 0.83382(4) | 155(1) | = U11 | 155(2) | 63(1) | −4(1) | 161(1) |
| Al1 | 2c | 2/3 | 1/3 | 0 | 99(9) | = U11 | 106(14) | 50(4) | 0 | 102(8) |
| Au/Al2b | 2e | 0 | 0 | 0.77058(13) | 127(5) | = U11 | 197(8) | 63(3) | 0 | 150(4) |
| Au/Al3b | 3g | 0.5773(2) | 0 | 1/2 | 125(7) | 131(8) | 135(8) | 66(4) | 0 | 130(6) |
| Au/Al4b | 6i | 0.71445(6) | 0 | 0.71128(5) | 135(2) | 150(3) | 119(2) | 75(1) | −2(2) | 133(2) |
| La16Au2.85(1)Al10.15(1) | |||||||||||
|---|---|---|---|---|---|---|---|---|---|---|---|
| La1: | 2 | Au/Al4 | 323.7 | La2: | 1 | Au/Al3 | 317.5 | La3: | 3 | Au/Al3 | 326.3 |
| 2 | Al1 | 345.2 | 2 | Au/Al3 | 331.4 | 3 | Au/Al4 | 332.1 | |||
| 2 | Au/Al2 | 345.7 | 4 | Au/Al4 | 333.6 | 3 | La4 | 340.2 | |||
| 4 | La4 | 362.5 | 2 | La2 | 362.8 | 1 | La3 | 359.6 | |||
| 2 | La4 | 372.6 | 2 | Au/Al2 | 364.8 | 1 | Al1 | 376.8 | |||
| 2 | La1 | 398.8 | 2 | La4 | 399.6 | 3 | La2 | 401.6 | |||
| 4 | La3 | 401.6 | |||||||||
| La4: | 1 | Au/Al4 | 326.3 | Al1: | 6 | La4 | 335.8 | Au/Al2: | 3 | Au/Al4 | 266.3 |
| 2 | Al1 | 335.8 | 3 | La1 | 345.2 | 3 | La1 | 345.7 | |||
| 2 | La3 | 340.2 | 2 | La3 | 376.8 | 3 | La4 | 362.6 | |||
| 2 | Au/Al4 | 346.6 | 3 | La2 | 364.8 | ||||||
| 2 | La1 | 362.5 | |||||||||
| 1 | Au/Al2 | 362.6 | |||||||||
| 1 | La4 | 368.9 | |||||||||
| 1 | La1 | 372.6 | |||||||||
| 1 | La2 | 399.6 | |||||||||
| 1 | Au/Al3 | 409.9 | |||||||||
| Au/Al3: | 2 | Au/Al4 | 264.8 | Au/Al4: | 1 | Au/Al3 | 264.8 | ||||
| 1 | La2 | 317.5 | 1 | Au/Al2 | 266.3 | ||||||
| 4 | La3 | 326.3 | 1 | La1 | 323.7 | ||||||
| 2 | La2 | 331.4 | 1 | La4 | 326.3 | ||||||
| 2 | La4 | 409.9 | 2 | La3 | 332.1 | ||||||
| 2 | La2 | 333.6 | |||||||||
| 2 | La4 | 346.6 | |||||||||
| Ce16Au3.37(1)Al9.67(1) | |||||||||||
|---|---|---|---|---|---|---|---|---|---|---|---|
| Ce1: | 2 | Au/Al4 | 318.2 | Ce2: | 1 | Au/Al3 | 312.8 | Ce3: | 3 | Au/Al3 | 321.7 |
| 2 | Au/Al2 | 339.1 | 2 | Au/Al3 | 328.5 | 3 | Au/Al4 | 326.8 | |||
| 2 | Al1 | 340.4 | 4 | Au/Al4 | 329.9 | 3 | Ce4 | 335.3 | |||
| 4 | Ce4 | 356.4 | 2 | Ce2 | 354.6 | 1 | Ce3 | 356.1 | |||
| 2 | Ce4 | 369.4 | 2 | Au/Al2 | 360.7 | 1 | Al1 | 370.7 | |||
| 2 | Ce1 | 393.4 | 2 | Ce4 | 393.4 | 3 | Ce2 | 397.5 | |||
| 4 | Ce3 | 397.5 | |||||||||
| Ce4: | 1 | Au/Al4 | 321.8 | Al1: | 6 | Ce4 | 332.0 | Au/Al2: | 3 | Au/Al4 | 264.1 |
| 2 | Al1 | 332.0 | 3 | Ce1 | 340.4 | 3 | Ce1 | 339.1 | |||
| 2 | Ce3 | 335.3 | 2 | Ce3 | 370.7 | 3 | Ce4 | 355.0 | |||
| 2 | Au/Al4 | 340.2 | 3 | Ce2 | 360.7 | ||||||
| 1 | Au/Al2 | 355.0 | |||||||||
| 2 | Ce1 | 356.4 | |||||||||
| 1 | Ce4 | 364.8 | |||||||||
| 1 | Ce1 | 369.4 | |||||||||
| 1 | Ce2 | 393.4 | |||||||||
| 1 | Au/Al3 | 403.6 | |||||||||
| Au/Al3: | 2 | Au/Al4 | 262.5 | Au/Al4: | 1 | Au/Al3 | 262.5 | ||||
| 1 | Ce2 | 312.8 | 1 | Au/Al2 | 264.1 | ||||||
| 4 | Ce3 | 321.7 | 1 | Ce1 | 318.2 | ||||||
| 2 | Ce2 | 328.5 | 1 | Ce4 | 321.8 | ||||||
| 2 | Ce4 | 403.6 | 2 | Ce3 | 326.8 | ||||||
| 2 | Ce2 | 329.9 | |||||||||
| 2 | Ce4 | 340.1 | |||||||||
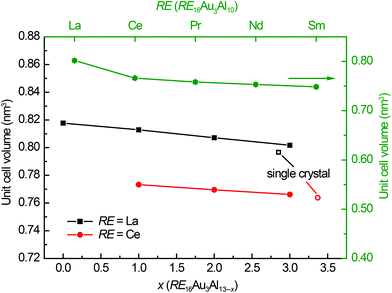
Since the investigated compounds have to be viewed as solid solutions, as a consequence more members with different values of x were synthesized. The maximum gold content is evident with respect to the reactive flux syntheses. For both, La and Ce, the single crystals exhibit values of x ∼ 3, this seems to be the maximum gold content. When using a starting composition RE![[thin space (1/6-em)]](https://www.rsc.org/images/entities/char_2009.gif) :
:![[thin space (1/6-em)]](https://www.rsc.org/images/entities/char_2009.gif) Au
Au![[thin space (1/6-em)]](https://www.rsc.org/images/entities/char_2009.gif) :
:![[thin space (1/6-em)]](https://www.rsc.org/images/entities/char_2009.gif) Al of 4
Al of 4![[thin space (1/6-em)]](https://www.rsc.org/images/entities/char_2009.gif) :
:![[thin space (1/6-em)]](https://www.rsc.org/images/entities/char_2009.gif) 1
1![[thin space (1/6-em)]](https://www.rsc.org/images/entities/char_2009.gif) :
:![[thin space (1/6-em)]](https://www.rsc.org/images/entities/char_2009.gif) 1, the remaining melt, after crystallization of the target compound, has to be rich in RE and Au. EDX investigations confirmed this assumption. For La16AuxAl13−x and Ce16AuxAl13−x the compounds with x = 1, 2 and 3 were prepared, along with Pr16Au3Al10, Nd16Au3Al10 and Sm16Au3Al10. Interestingly, binary Ce16Al13 could not be synthesized; however, La16Al13 could be reproduced. The X-ray powder diffraction patterns of the neodymium and samarium samples exhibit reflections being in line with the proposed crystal structure, however significant amounts of by-products were observed. The unit cell of these compounds could be indexed but no phase pure samples for property measurements could be obtained. The unit cell volumes of all prepared compounds are plotted in Fig. 6; both lattice parameters and unit cell volumes are listed in Table 1. As expected, an almost linear trend is visible in both, the lattice parameters and the unit cell volume. This can be explained by the increasing covalent character of the Au–Al bonds within the barrelane units. When going from lanthanum to cerium, the values shrink again due to the lanthanide contraction. For Pr, Nd and Sm only one compound with x = 3 has been prepared, however the unit cell sizes still fit the expected trend.
1, the remaining melt, after crystallization of the target compound, has to be rich in RE and Au. EDX investigations confirmed this assumption. For La16AuxAl13−x and Ce16AuxAl13−x the compounds with x = 1, 2 and 3 were prepared, along with Pr16Au3Al10, Nd16Au3Al10 and Sm16Au3Al10. Interestingly, binary Ce16Al13 could not be synthesized; however, La16Al13 could be reproduced. The X-ray powder diffraction patterns of the neodymium and samarium samples exhibit reflections being in line with the proposed crystal structure, however significant amounts of by-products were observed. The unit cell of these compounds could be indexed but no phase pure samples for property measurements could be obtained. The unit cell volumes of all prepared compounds are plotted in Fig. 6; both lattice parameters and unit cell volumes are listed in Table 1. As expected, an almost linear trend is visible in both, the lattice parameters and the unit cell volume. This can be explained by the increasing covalent character of the Au–Al bonds within the barrelane units. When going from lanthanum to cerium, the values shrink again due to the lanthanide contraction. For Pr, Nd and Sm only one compound with x = 3 has been prepared, however the unit cell sizes still fit the expected trend.
Physical properties
Electrical resistivity measurements at room temperature indicate metallic character. Upon cooling the resistivity shows irregularities, suggesting micro-cracks in the sample, making a characterization over the full temperature range impossible.
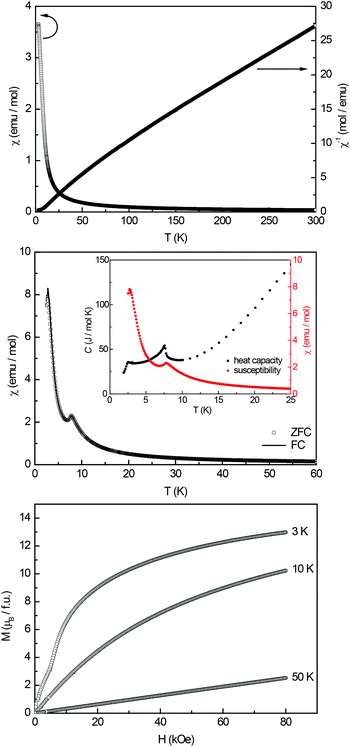
The magnetization isotherm recorded at 50 K shows a linear field dependency of the magnetization as expected for a paramagnetic material. The 3 K and 10 K isotherms show a strong increase of the magnetization at almost zero field, underlining the ferromagnetic ground state. Near 20 kOe a small S-shaped feature appears, typical for a spin-reorientation. This feature remained unclear and might be attributed to trace impurities; however due to the two anomalies observed for Ce16Au3Al10, this magnetic transition might also be intrinsic. At higher fields no tendency for saturation is visible. The magnetic moment at 3 K and 80 kOe reaches μsat = 1.35(5) μB per Pr atom, which is lower than the expected saturation magnetization of 3.20 μB according to gJ × J.
Conclusions
Nine new compounds, La16AuxAl13−x and Ce16AuxAl13−x (x = 1–3), Pr16Au3Al10, Nd16Au3Al10 and Sm16Au3Al10 crystallizing in the hexagonal La16Al13 type structure have been synthesized and structurally characterized. For La16Au3Al10, Ce16Au3Al10 and Pr16Au3Al10 the magnetic properties have been investigated. Single crystals for structural analysis have been grown by the reactive flux method. Ideal synthetic conditions have been obtained with the help of thermoanalytic investigations. The striking feature of the crystal structures are 11-atomic [3.3.3]-barrelane analogue units which get sandwiched between layers build by Al@RE11 Edshammar polyhedra. The aluminium positions of the barrelane unit can be substituted with gold up to a maximum of x ∼ 3. La16Au3Al10 shows Pauli-paramagnetic behaviour, while Ce16Au3Al10 and Pr16Au3Al10 exhibit antiferromagnetic magnetic ordering below TN = 7.8(1) K and ferromagnetic ordering below TC = 19.8(1) K respectively.Experimental
Synthesis
Single crystals of Ce16Au3.37(1)Al9.63(1) were first obtained from annealed ingots prepared by arc-melting32 with a nominal composition “Ce4AuAl” when searching for new Gd4RhIn type aluminides.18 For the synthesis rare-earth ingots (Sigma-Aldrich, 99.9%), gold shots (Agosi AG, 99.9%), and aluminum turnings (Koch Chemicals, 99.99%) were used. The elements were arc-melted in the 4![[thin space (1/6-em)]](https://www.rsc.org/images/entities/char_2009.gif) :
:![[thin space (1/6-em)]](https://www.rsc.org/images/entities/char_2009.gif) 1
1![[thin space (1/6-em)]](https://www.rsc.org/images/entities/char_2009.gif) :
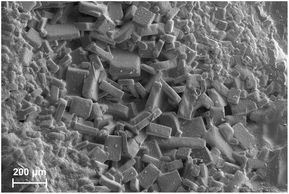
:![[thin space (1/6-em)]](https://www.rsc.org/images/entities/char_2009.gif) 1 ratio in a water cooled copper hearth under an argon atmosphere with a pressure of 800 mbar. The argon was purified by molecular sieve and titanium sponge (873 K) to remove traces of water, nitrogen or oxygen. Afterwards, the samples were annealed for 7 d at 1023 K. Due to two intrinsic eutectics with the compositions Ce0.89Al0.11 (m.p. 853 K) and Ce0.84Au0.16 (m.p. 793 K)19 crystals of the title compounds could be obtained from the excess melt (Fig. 9). The samples are not stable against diluted hydrochloric or acetic acid; therefore mechanical fragmentation was used to obtain crystals suitable for the structural analysis. This process was also used to crystallize the isostructural lanthanum compound. The samples are stable against air and moisture for months.
1 ratio in a water cooled copper hearth under an argon atmosphere with a pressure of 800 mbar. The argon was purified by molecular sieve and titanium sponge (873 K) to remove traces of water, nitrogen or oxygen. Afterwards, the samples were annealed for 7 d at 1023 K. Due to two intrinsic eutectics with the compositions Ce0.89Al0.11 (m.p. 853 K) and Ce0.84Au0.16 (m.p. 793 K)19 crystals of the title compounds could be obtained from the excess melt (Fig. 9). The samples are not stable against diluted hydrochloric or acetic acid; therefore mechanical fragmentation was used to obtain crystals suitable for the structural analysis. This process was also used to crystallize the isostructural lanthanum compound. The samples are stable against air and moisture for months.
The samples of the solid solutions RE16AuxAl13−x with RE = La–Nd, Sm and x = 3 for magnetic measurements were synthesized by arc-melting the pure elements.32 The starting materials were weighed in a molar ratio of 16![[thin space (1/6-em)]](https://www.rsc.org/images/entities/char_2009.gif) :
:![[thin space (1/6-em)]](https://www.rsc.org/images/entities/char_2009.gif) 3
3![[thin space (1/6-em)]](https://www.rsc.org/images/entities/char_2009.gif) :
:![[thin space (1/6-em)]](https://www.rsc.org/images/entities/char_2009.gif) 10 (RE
10 (RE![[thin space (1/6-em)]](https://www.rsc.org/images/entities/char_2009.gif) :
:![[thin space (1/6-em)]](https://www.rsc.org/images/entities/char_2009.gif) Au
Au![[thin space (1/6-em)]](https://www.rsc.org/images/entities/char_2009.gif) :
:![[thin space (1/6-em)]](https://www.rsc.org/images/entities/char_2009.gif) Al) and arc-melted under argon at 800 mbar. The obtained button was remelted several times to increase the homogeneity. In the final step, the samples were sealed in quartz ampoules and held for 10 d at 823 K, well below the melting point of the compound. The furnace was cooled down to room temperature within 48 h.
Al) and arc-melted under argon at 800 mbar. The obtained button was remelted several times to increase the homogeneity. In the final step, the samples were sealed in quartz ampoules and held for 10 d at 823 K, well below the melting point of the compound. The furnace was cooled down to room temperature within 48 h.
Simultaneous differential thermoanalysis (SDT)
Simultaneous Differential Thermoanalytic SDT measurements were carried out on a TA Instruments SDT Q600 instrument. Typically 10 mg of the sample was placed in an Al2O3 crucible which was covered with a lid. The samples were transferred into the instrument and heated under a constant Argon stream to 1023 K with a heating rate of 10 K min−1 followed by a cooling step to room temperature with the same rate.X-ray powder diffraction
The polycrystalline samples were characterized by Guinier patterns (imaging plate detector, Fujifilm BAS-1800 scanner) with Cu-Kα1 radiation using α-quartz (a = 491.30, c = 540.46 pm) as an internal standard. Due to the ductility based on their structural features (vide supra) the samples could not be ground to a powder. Consequently the samples were crushed as fine as possible. Correct indexing of the diffraction lines was ensured through intensity calculations using the LAZY-PULVERIX software package.33 The lattice parameters were obtained through least-squares fits (Table 1).Single crystal diffraction
Small single crystals were extracted from the crushed annealed ingots or from the flux reactions. The crystals were glued to thin quartz fibers using beeswax and investigated by Laue photographs on a Buerger camera (white molybdenum radiation, image plate technique, Fujifilm, BAS-1800) in order to check their quality. Intensity data sets of four single crystals were collected at room temperature by use of a Stoe IPDS-II image plate system (graphite monochromatized Mo radiation; λ = 71.073 pm) in oscillation mode or on a four-circle diffractometer (Stoe, StadiVari, μ-source, Mo Kα radiation; λ = 71.073 pm; oscillation mode) with an open Eulerian cradle setup equipped with a reverse-biased silicon diode array detector (Dectris Pilatus 100 K, resolution: 487 × 195 pixel, pixel size: 0.172 × 0.172 mm2).34 Numerical absorption corrections along with scaling35 were applied to the data sets. Details of the data collections and the structure refinements of two crystals are listed in Tables 2 and 3.EDX data
Semiquantitative EDX analyses on all bulk samples and the single crystals used for structure determination were carried out on a Zeiss EVO MA10 scanning electron microscope using La2O3, Ce2O3, Au and Al2O3 as internal standards. The polycrystalline pieces from the annealed arc-melted buttons were embedded in a methylmethacrylate matrix and polished with diamond and SiO2 emulsions of different particle sizes. The single crystals were measured directly on the quartz fiber. The composition for La16Au2.85(1)Al10.15(1) was determined to 52(2) at% La, 11(2) at% Au, and 37(2) at% Al (theoretical: 55.2 at% La, 9.8 at% Au, and 35.0 at% Al), for the cerium compound Ce16Au3.37(1)Al9.63(1) values of 45(2) at% Ce, 14(2) at% Au, and 41(2) at% Al (theoretical: 55.2 at% Ce, 11.6 at% Au, and 33.2 at% Al) were found. The experimentally observed compositions for the lanthanum compound differ slightly from the theoretical values while for cerium more pronounced deviations are found. These can be explained due to the not perfect perpendicular alignment of the crystals on the fiber with respect to beam and detector. However, phase pure samples with respect to the limitations of the instrument were observed after annealing. No impurity elements heavier than sodium (detection limit of the instrument) were observed.Physical properties measurements
Polycrystalline pieces of the annealed RE16Au3Al10 button were packed in kapton foil and attached to the sample holder rod of a Vibrating Sample Magnetometer unit (VSM) for measuring the magnetization M(T,H) in a Quantum Design Physical-Property-Measurement-System (PPMS). The sample was investigated in the temperature range of 2.5–300 K and with magnetic flux densities up to 80 kOe.For the heat capacity measurement from 1.9–300 K, a piece of the sample used for the susceptibility measurements (4.551 mg) was fixed to a pre-calibrated heat capacity puck using Apiezon N grease.
Acknowledgements
We thank Dipl.-Ing. U. Ch. Rodewald for collecting the single crystal intensity data and Dr. F. Schappacher for the possibility to use the thermoanalytical instruments.Notes and references
- H. Okamoto, J. Phase Equilib. Diffus., 2007, 28, 581–581 CrossRef CAS.
- H. Okamoto, J. Phase Equilib., 1998, 19, 395–396 CrossRef CAS.
- A. H. Gomes de Mesquita and K. H. J. Buschow, Acta Crystallogr., 1967, 22, 497–501 CrossRef CAS.
- J. H. N. van Vucht and K. H. J. Buschow, J. Less-Common Met., 1966, 10, 98–107 CrossRef CAS.
- K. H. J. Buschow, Philips Res. Rep., 1965, 20, 337–348 CAS.
- H. N. Nowotny, Z. Metallkd., 1942, 34, 22–24 CAS.
- C. Bècle and R. Lemaire, Acta Crystallogr., 1967, 23, 840–845 CrossRef.
- A. Leineweber and H. Jacobs, J. Alloys Compd., 1998, 278, L10–L12 CrossRef CAS.
- A. Iandelli, Natl. Phys. Lab. (U. K.), Symp., 1951, 3F-2-3F11 Search PubMed.
- J. H. N. van Vucht, Z. Metallkd., 1957, 48, 253–258 CAS.
- A. C. Lawson, J. M. Lawrence, J. D. Thompson and A. Williams, Physica B, 1990, 163, 587–590 CrossRef CAS.
- N. F. Chaban and Y. B. Kuz'ma, Dokl. Akad. Nauk SSSR, Ser. A, 1971, 11, 1048–1050 Search PubMed.
- N. M. Belyavina, V. Y. Markiv and V. V. Zavodyanny, J. Alloys Compd., 2004, 367, 132–136 CrossRef CAS.
- R. Niewa, M. Kirchner, H. Zhang, W. Schnelle and Y. Grin, Z. Kristallogr., 2005, 220, 115–121 CAS.
- F. Hulliger, J. Alloys Compd., 1993, 200, 75–78 CrossRef CAS.
- F. Hulliger, J. Alloys Compd., 1995, 218, 255–258 CrossRef CAS.
- S. E. Latturner, D. Bilc, J. R. Ireland, C. R. Kannewurf, S. D. Mahanti and M. G. Kanatzidis, J. Solid State Chem., 2003, 170, 48–57 CrossRef CAS.
- F. Tappe, C. Schwickert, S. Linsinger and R. Pöttgen, Monatsh. Chem., 2011, 142, 1087–1095 CrossRef CAS.
- T. B. Massalski, H. Okamoto, P. R. Subramanian and L. Kacprzak, Binary Alloy Phase Diagrams, ASM International, Ohio, U.S.A., 2nd edn, 1990 Search PubMed.
- M. G. Kanatzidis, R. Pöttgen and W. Jeitschko, Angew. Chem., Int. Ed., 2005, 44, 6996–7023 CrossRef CAS PubMed.
- L. Palatinus and G. Chapuis, J. Appl. Crystallogr., 2007, 40, 786–790 CrossRef CAS.
- V. Petříček, M. Dušek and L. Palatinus, Jana2006. The crystallographic computing system, Institute of Physics, Praha, Czech Republic, 2006 Search PubMed.
- V. Petříček, M. Dušek and L. Palatinus, Z. Kristallogr., 2014, 229, 345–352 Search PubMed.
- J. Emsley, The Elements, Clarendon Press, Oxford University Press, Oxford, New York, 1998 Search PubMed.
- W. Uhl, Z. Naturforsch., B: Chem. Sci., 1988, 43, 1113–1118 CrossRef CAS.
- A. Purath, R. Köppe and H. Schnöckel, Angew. Chem., Int. Ed., 1999, 38, 2926–2928 CrossRef CAS.
- S. Lidin, T. Popp, M. Somer and H. G. von Schnering, Angew. Chem., Int. Ed. Engl., 1992, 31, 924–927 CrossRef.
- L.-E. Edshammar, X-ray studies on binary alloys of aluminium with platinum metals, Stockholm University, Sweden, 1969 Search PubMed.
- W. Hermes, R. Mishra, U. C. Rodewald and R. Pöttgen, Z. Naturforsch., B: Chem. Sci., 2008, 63, 537–542 CAS.
- B. Chevalier and J. L. Bobet, Intermetallics, 2001, 9, 835–838 CrossRef CAS.
- P. Javorský, L. Havela, V. Sechovský, H. Michor and K. Jurek, J. Alloys Compd., 1998, 264, 38–42 CrossRef.
- R. Pöttgen, T. Gulden and A. Simon, GIT Labor-Fachz., 1999, 43, 133–136 Search PubMed.
- K. Yvon, W. Jeitschko and E. Parthé, J. Appl. Crystallogr., 1977, 10, 73–74 CrossRef.
- Dectris, Technical Specification and Operating Procedure Pilatus 100K-S Detector System, Version 1.7, 2011 Search PubMed.
- Stoe & Cie GmbH, X-Area (Version 1.70), 2014 Search PubMed.
Footnote |
| † Electronic supplementary information (ESI) available. See DOI: 10.1039/c6dt02649d |
| This journal is © The Royal Society of Chemistry 2016 |

