 Open Access Article
Creative Commons Attribution 3.0 Unported Licence
A structurally flexible triazolate-based metal–organic framework featuring coordinatively unsaturated copper(I) sites†
P.
Schmieder
a,
D.
Denysenko
a,
M.
Grzywa
a,
O.
Magdysyuk
b and
D.
Volkmer
*a
aAugsburg University, Institute of Physics, Chair of Solid State and Materials Chemistry, Universitaetsstrasse 1, 86159 Augsburg, Germany. E-mail: dirk.volkmer@physik.uni-augsburg.de
bDiamond Light Source Ltd., Harwell Science and Innovation Campus, Didcot, Oxfordshire, OX11 0DE, UK
First published on 2nd August 2016
Abstract
The novel metal–organic framework CFA-8 (Coordination Framework Augsburg University-8), [Cu2(tqpt)], containing the organic linker H2-tqpt {H2-tqpt = 6,6,14,14-tetramethyl-6,14-dihydroquinoxalino[2,3-b]phenazinebis-triazole}, has been synthesized. Reaction of H2-tqpt and anhydrous CuCl2 in N,N-dimethylacetamide (DMA) yields CFA-8 as orange crystals with lenticular shape. This framework shows a reversible breathing effect and is robust upon solvent removal. It has been characterized by single-crystal and powder X-ray diffraction, TGA, IR spectroscopy and gas sorption measurements. CO adsorption isotherms show that Cu(I) sites in this framework are able to bind carbon monoxide forming a weak complex which has been additionally characterized by IR spectroscopy and synchrotron powder X-ray diffraction measurements.
Introduction
With their patent in 1947 Procter and Gamble Ltd reported on the corrosion inhibiting effect of 1H-benzo[d][1,2,3]triazole (btaH) for copper metal.1 The same molecule was later mentioned in some additional patents describing corrosion inhibitors.2,3 Driven by the economic impact of these inhibitors various coordination modes between copper and 1,2,3-benzotriazoles have been proposed.4–13 Cotton and co-workers published the first Cu(I)-bta structure and stated more decisively that this structure contains Cu(I) ions.4 This coordination mode and the monovalent oxidation state of copper was later confirmed by Poling, but no crystal structure has been reported for a Cu(I) complex derived from 1H-benzo[d][1,2,3]triazole.13,14 The first crystal structure of a Cu(I) polymer incorporating the deprotonated ligand of 1H-benzo[d][1,2,3]triazole was reported by Huang and co-workers.13 The connection scheme of this 1D coordination polymer with the formula [Cu2(bta)2] is shown in Fig. 1. The crystal structure is much more complicated than the original model proposed by Cotton et al., which suggested a linear polymeric structure. The asymmetric unit of this structure contains three differently coordinated Cu(I) ions. One of the CuI ions is trigonally-planar coordinated by nitrogen donor atoms of the triazolate ring, the second CuI ion is two-fold linearly coordinated and the third copper ion is tetrahedrally coordinated. The most interesting feature of this compound is the presence of three different coordination modes of the copper(I) ions. With a more focused look at the structure it could be assumed that the two- and three-fold coordinated Cu(I) ions should be able to bind additional ligands by keeping their original connection scheme, which would however require to engineer the dense Cu(I)(bta) 1-D coordination polymer into a porous 3D framework structure.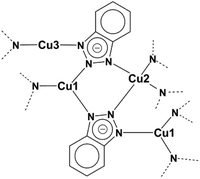 | ||
| Fig. 1 Connection scheme of the literature-known Cu(I) complex [Cu2(bta)2].13 | ||
To prove this assumption we have invented a novel copper(I) bis-triazolate metal–organic framework (MOF) [Cu2(tqpt)] (tqpt2− = 6,6,14,14-tetramethyl-6,14-dihydroquin-oxalino-[2,3-b]phenazinebistriazolate), featuring the same Cu-azolate coordination modes, which we refer to as CFA-8 (Coordination Framework Augsburg University-8). This MOF represents a further member of Cu(I)-containing metal–organic frameworks comprising open CuI metal sites, which might be amenable to binding of additional ligands.15–17 To the best of our knowledge, the crystal structure of the framework introduced here is the first example for a crystalline and permanently porous Cu(I) network incorporating a bistriazolate as organic bridging ligand.
Results and discussion
Syntheses and characterization
The organic ligand H2-tqpt was synthesized in three steps. 2,2,5,5-Tetramethylcyclohexane-1,3-dione and 3,3,6,6-tetramethylcyclohexane-1,2,4,5-tetraone were synthesized by conventional procedures.18 The condensation reaction of the latter tetraone and two molecules of 1H-benzotriazole-5,6-diamine19–21 leads to the organic bistriazolate ligand H2-tqpt, which was previously used for the synthesis of the CFA-7 metal–organic framework (Scheme 1).22Metal–organic framework CFA-8 can be synthesized from H2-tqpt and anhydrous CuCl2 in a good yield by using N,N-dimethylacetamide (DMA) as a solvent at 140 °C (Scheme 2). During the reaction, Cu(II) ions are reduced by DMA to Cu(I). The network forms orange lenticular crystals (Fig. 2). Inspection of electron microscopic images reveals that the crystal faces of the crystals stay intact, even after activation at 250 °C in vacuum. Different microscope pictures show that CFA-8 forms crystals in the size range of 10–150 μm.
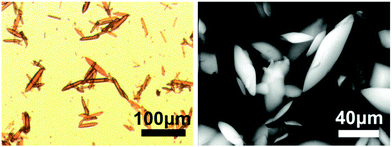 | ||
| Fig. 2 Optical microscopy image of as-synthesized CFA-8 crystals (left) and SEM image of activated CFA-8 (right). | ||
Crystal structure analysis
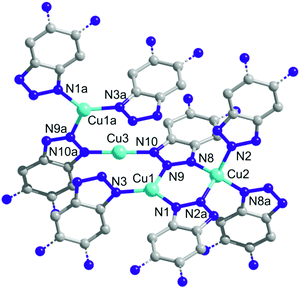
A single crystal X-ray diffraction study reveals that CFA-8 crystallizes in the monoclinic crystal system in the space group C2/c (no. 15), which coincides with the crystal structure described for Cu(I)(bta) which also crystallizes in the monoclinic crystal system, in the same space group.13 The asymmetric unit of CFA-8 consists of three copper, twenty-two carbon, sixteen hydrogen and ten nitrogen atoms (Fig. 3).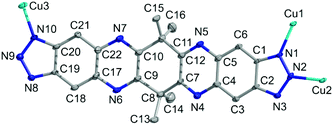 | ||
| Fig. 3 Ball-and-stick model of the asymmetric unit of CFA-8 (grey: C-, blue: N-, cyan: Cu-atoms, H-atoms are omitted for clarity; atoms displayed as 50% probability ellipsoids). | ||
The three crystallographically independent copper ions have different coordination geometries. The Cu3 atom (see asymmetric unit Fig. 3) located on a site with crystallographically imposed twofold symmetry is linearly two-fold coordinated by two nitrogen atoms (N10, N10a) of different tqpt2− ligands. The distances between Cu3 and N10, N10a are 1.874(3) Å and the angle N10–Cu3–N10a is with 178.45(18)° nearly straight (Fig. 4). The trigonally planar coordinated Cu1, located on a general position, binds to three nitrogen atoms (N1, N3 and N9). The Cu1–N1/3/9 bond lengths range from 1.931(3)–1.995(3) Å and the N–Cu1–N angles fall in between 113.28(11)° and 131.78(12)°. The third coordination geometry of Cu(I) ions, located on a site with crystallographically imposed twofold symmetry, is represented by the tetrahedrally coordinated Cu2. The Cu2 ion is bound to four different nitrogen atoms (N2, N2a and N8, N8a). The bond length values are 2.008(3) Å for Cu2–N2/2a and 2.027(3) Å for Cu2–N8/8a. The N–Cu2–N angles range from 107.21(11)–116.84(15)°. These values are in very good agreement with those reported in similar literature-known structures (Table 1) featuring Cu(I) triazolate coordination units.13,23
| Coordination polymer, [Cu(bta)] | CFA-8, [Cu2(tqpt)] | ||||
|---|---|---|---|---|---|
| Wyckoff position | Site symmetry | Wyckoff position | Site symmetry | ||
| Cu1 | 8f | 1 | Cu1 | 8f | 1 |
| Cu2 | 4e | 2 | Cu2 | 4e | 2 |
| Cu3 | 4e | 2 | Cu3 | 4e | 2 |
| Selected geometric parameters | |||
|---|---|---|---|
| Symmetry codes: (i) x, −y, z −1/2; (ii) −x, y, −z + 1/2; (iii) –x, y, −z − 1/2, (iv) x, −y + 1, z + 1/2; (v) x + 1/2, y + 1/2, z; (VI) #3 −x + 2, y, −z + 1/2; (vii) −x + 3/2, y + 1/2, −z + 1/2; (viii) −x + 1, y, −z + 3/2. | |||
| Cu1–N3 | 1.942(3) | Cu1–N1 | 1.931(3) |
| Cu1–N1i | 1.949(3) | Cu1–N3iv | 1.935(3) |
| Cu1–N5 | 2.003(3) | Cu1–N9v | 1.995(3) |
| Cu2–N2 | 2.032(3) | Cu2–N2 | 2.008(3) |
| Cu2–N2ii | 2.032(3) | Cu2–N8v | 2.027(3) |
| Cu2–N6 | 2.032(3) | Cu2–N2avi | 2.008(3) |
| Cu2–N6ii | 2.032(3) | Cu2–N8avii | 2.027(3) |
| Cu3–N4 | 1.865(3) | Cu3–N10 | 1.874(3) |
| Cu3–N4iii | 1.865(3) | Cu3–N10aviii | 1.874(3) |
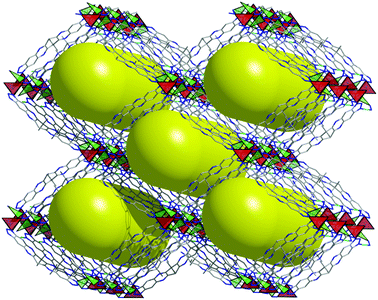
The analysis of the data from single crystal measurement reveals for the metal–organic framework CFA-8 a chemical composition of [Cu2(tqpt)]. A schematic representation of the as-synthesized and solvent-filled MOF, which we refer to as large-pore phase CFA-8 network, is presented in Fig. 5. After activation at 250 °C in vacuum all solvent molecules are evaporated out of the pores. The monoclinic network exhibits channel-like pores along the c-axis, which are illustrated as big yellow rods.
The maximum pore opening diameter of the channels calculated with the Poreblazer software24 is around 7.8 Å (Fig. 6, left). The plot on the right side in Fig. 6 along the b-axis shows clearly that there are no other kinds of pores or channels running in different crystallographic directions in the 3D framework. The cyan dashed field illustrates the copper–nitrogen-strands which also run along the c-direction. The channels in the as-synthesized large-pore-phase of CFA-8 are occupied by disordered solvent molecules (DMA), the positions of which were impossible to resolve and refine from the electron density distribution. According to the crystallographic data there is an electron count of 814 per unit cell (rest of the electron density), which correspond to approximately 17 N,N-dimethylacetamide molecules in the unit cell of CFA-8. Calculations with the SQUEEZE program25 reveals that the initial solvent accessible void volume is 3358.4 Å3, which is about 47% of the unit cell volume (7141.0 Å3).
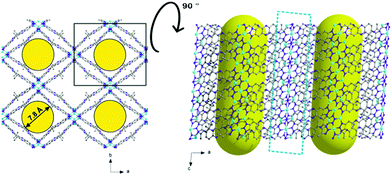 | ||
| Fig. 6 Different plots of the large-pore phase of the copper MOF; along c-axis (left) and tilted by 90° along the a-axis (right). | ||
As mentioned before, CFA-8 exhibits permanent porosity. In order to remove all solvent molecules, which are localized in the channels, the as-synthesized sample was activated at 250 °C for at least twelve hours in high-vacuum. Powder XRD measurements show that the unit cell of CFA-8 is changed upon this activation. In the following the heated and solvent-free CFA-8 network is referred to as activated phase of CFA-8. The most obvious difference is the disappearance of the most intensive peak of the XRD pattern around 4.9° in 2θ and the formation of a new peak at 5.9° in 2θ (Fig. 7). The framework remains crystalline after activation but has a smaller unit cell. This process is fully reversible. Thus, treatment of a completely activated sample of CFA-8 with fresh DMA for several hours results in the regeneration of the original as-synthesized phase (= large-pore phase of CFA-8), as shown by XRPD measurements (Fig. 7). Such breathing effects have been repeatedly reported for different MOF structures.26–29
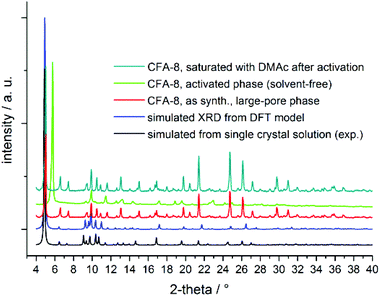 | ||
| Fig. 7 Comparison of diverse XRPD patterns of CFA-8; the activated sample (neon-green XRD graph) was treated at 250 °C in vacuum for 12 hours. | ||
Unfortunately, many attempts to collect a single crystal diffraction pattern of a completely dry single-crystal of CFA-8 were unsuccessful due to the fact that the crystals scattered very badly. A synchrotron measurement of an activated powder sample of the Cu-MOF made it possible to index the diffractogram and to determine at least the cell parameters of the dried phase of CFA-8. These dimensions of the activated unit cell are a = 28.055(4) Å, b = 19.212(1) Å, c = 9.996(1) Å, α, γ = 90.00°, β = 96.80(1)° and the cell volume amounts to V = 5350.0(5) Å3. The proposed space group is P21/c, which represents a subgroup of the space group C2/c for the large-pore phase. A Le Bail fit of the XRPD pattern of the activated CFA-8 phase is presented in Fig. S8.†
To get more details about the observed differences in the powder X-ray diffractograms (Fig. 7), a second post-synthetically modified single crystal was measured. These crystals were obtained by an experiment in order to check, if the phosphorus atom of trimethyl phosphite coordinates to the Cu1 atom as observed for CO gas molecules (see discussion below). Therefore a sample of completely activated CFA-8 crystals was treated with a diluted solution of trimethyl phosphite. Afterwards the modified CFA-8 crystals were dried under mild conditions (vacuum/60 °C/4 h) and the single crystal diffraction data were measured. In this case, the interactions between the phosphorus atom of the remaining trimethyl phosphite molecules and the Cu1 atom of the framework are not strong enough to coordinate to each other. The observed distance between the phosphorus atom and Cu1 is 2.8 Å. The distance for similar compounds in the literature are between 2.122–2.161 Å.30–32 The single crystal structure of this crystal phase, containing trimethyl phosphite guest molecules inside the channels of the porous framework structure, will from now on be referred to as “narrow-pore phase” of CFA-8. The refinement of the data of the narrow-pore phase of CFA-8 leads to the same crystal system and space group as for the large-pore phase (C2/c (no. 15)). The difference of both crystal structures arises from slight variations of the unit cell parameters. The unit cell parameters of the as-synthesized CFA-8 (large-pore phase) single crystal are a = 27.49 Å, b = 23.66 Å, c = 11.00 Å, β = 93.75° with the cell volume of 7141 Å3. In contrast to this solution, the second crystal (narrow-pore phase) shows lattice parameters of a = 32.04 Å, b = 16.79 Å, c = 10.77 Å, α, γ = 90° and β = 92.36° with the unit cell volume of 5789 Å3. More details of the narrow-pore phase are presented in the ESI (Table S4; Fig. S9†).
Thermal analysis and VTXRPD studies
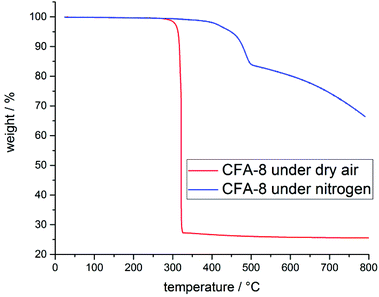
Structural and thermal stability of CFA-8 were investigated by thermogravimetric analysis (TGA) and variable temperature X-ray powder diffraction (VTXRPD) measurements. In the TGA curve of a pre-dried CFA-8 sample (250 °C/vacuum/10 h) no weight loss is detectable until a temperature of 300 °C is reached (Fig. 8). The framework collapses under dry air (red curve) at around 300 °C, because an exothermal reaction takes place and after decomposition of the organic ligand only copper(II) oxide is left. Under inert nitrogen atmosphere CFA-8 is stable up to 400 °C (blue curve). Above 400 °C CFA-8 is not stable and the decomposition of the framework starts. These results from TG analysis are in very good agreement with VTXRPD measurements (Fig. 9), which were performed in a quartz capillary under inert atmosphere. According to the latter, the CFA-8 network is stable up to 350 °C. In the diffractogram recorded at 400 °C, a new phase with peaks at 46° and 51° in 2θ could be detected, which corresponds to elemental copper (PDF no. 4-836). No peaks of the CFA-8 phase can be seen in the XRPD pattern at a temperature greater than 450 °C.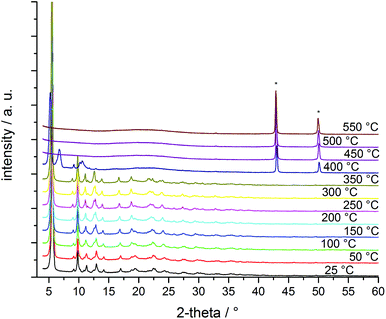 | ||
| Fig. 9 VTXRPD plot of a pre-dried (250 °C, vacuum, 12 h) powder sample of CFA-8 in the temp.-range of 25–550 °C (* diffraction peaks belong to copper, PDF no. 4-836). | ||
Gas sorption measurements
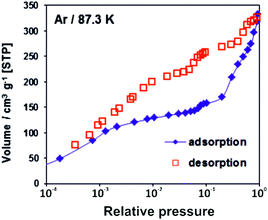
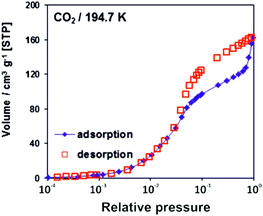
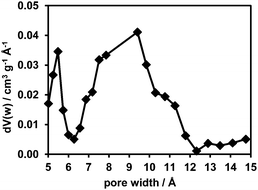
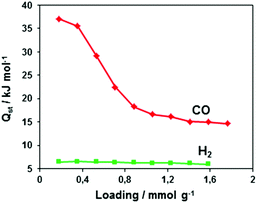
The adsorption/desorption isotherms for CFA-8 measured at 87.3 K for Ar and at 194.7 K for CO2 show in both cases a strong hysteresis, which indicates a flexible character of the MOF structure (Fig. 10 and 11). It should be noted, that Ar isotherms show several steps at p/p0 > 0.05 which probably corresponds to the structural transformation in crystals with different sizes. The CO2 adsorption isotherm shows, in contrast, only one step at p/p0 0.7–0.95 corresponding to the structural transformation. This behavior is confirmed by in situ XRPD measurements under CO2 atmosphere which show structural changes at p/p0 > 0.1 as well (Fig. S13†). Reversible structural changes of CFA-8 are also shown by in situ XRPD measurements under 80% humidity (Fig. S14†). Since argon sorption isotherms seem to be not equilibrated and dependent on the crystal size at p/p0 > 0.05 (probably due to the low measurement temperature), the values of the BET surface areas and pore volumes, obtained from CO2 sorption isotherms, seem to be more reliable. The adsorption branch of the CO2 isotherm in the relative pressure range 0.06–0.1 reveals a BET surface area of 446 m2 g−1 for the activated and totally dried CFA-8 phase. The adsorption branch of the Ar isotherm in the p/p0 range 0.007–0.05 reveals a BET surface area of 518 m2 g−1 for the same phase. The values calculated with the Poreblazer software24 (510 m2 g−1 for argon with a probe diameter of 3.4 Å and 437 m2 g−1 for CO2 with a probe diameter of 3.8 Å) fit very well. The desorption branch of the CO2 isotherm in the p/p0 range 0.06–0.08 reveals a value of 520 m2 g−1 for the BET surface area of the large-pore phase. The calculated value from the Poreblazer software for the large-pore phase of CFA-8 is 556 m2 g−1 for CO2. The pore volume of the activated phase determined from the adsorption branch of the CO2 isotherm at p/p0 = 0.6 is 0.15 cm3 g−1, the volume of the large-pore phase determined from the adsorption branch of the CO2 isotherm at p/p0 = 0.95 is 0.20 cm3 g−1. Analysis of the argon adsorption isotherm at p/p0 < 0.05 using the non-local density functional theory (NLDFT) reveals a quite broad distribution of micropores with two maxima at 5.5 and 9.1 Å (Fig. 12).The isosteric heat of CO adsorption in CFA-8 determined from the adsorption isotherms in the temperature range between 173 K and 193 K is relatively high at low loading (37 kJ mol−1) and decreases to 18 kJ mol−1 at 0.9 mmol g−1 loading (Fig. 13). At higher loading, the isosteric heat of CO adsorption reaches a nearly constant value of about 15–16 kJ mol−1, which corresponds to a typical physisorption value. The value for the isosteric heat of H2 adsorption, in contrast, remains constant at 6 kJ mol−1 over the whole measured range. An enhanced heat of carbon monoxide adsorption at loading below 0.9 mmol g−1 (16–37 kJ mol−1) indicates a weak chemisorption and coordination of CO molecules to Cu(I) sites. The binding of CO molecules in this case is much weaker than reported previously for Cu(I)-MFU-4large, which forms a very stable CO-complex (stable till 200 °C).33 Such weak chemisorption could be advantageous for applications such as gas separation or sensing, because CO binds reversibly at low temperatures and can be easily removed.
As mentioned before, CFA-8 exhibits three different coordinated Cu ions. The value of 0.9 mmol g−1 corresponds to one copper(I) atom per formula unit.
Tetrahedrally coordinated Cu2 ions in the CFA-8 framework cannot interact with CO molecules because of their full coordination environment. Apart from binding stoichiometry the synchrotron powder diffraction measurements of CFA-8 with adsorbed CO molecules indicate formation of a CuI–CO complex between Cu1 (previously trigonally coordinated) and CO (Fig. 14).
 | ||
| Fig. 14 Illustration of the Cu(I) sites in CFA-8 by ball-and-stick models before and after CO loading. | ||
The structure of CFA-8 with adsorbed CO molecules was solved from synchrotron powder diffraction data at 100 K. Under CO gas adsorption, the crystal structure of CFA-8 has monoclinic space group C2/c with lattice parameters of a = 30.866(4) Å, b = 18.881(1) Å, c = 10.851(2) Å, α, γ = 90°, β = 93.29(2)° and a unit cell volume of 6313 Å3, thus having lattice parameters which are between the cell parameters for large-pore and narrow-pore phase of CFA-8. One CO molecule was found to coordinate the Cu1 atom, and additional four molecules were physisorbed in the center of the pores of CFA-8. The originally planar trigonally coordinated CuI atom (Cu1) shows a distorted tetrahedral coordination upon coordination of a single CO molecule. During structure refinement from powder diffraction data, the linear CO molecule was modeled by the single sphere with a position corresponding to the center of gravity of CO molecule. The comparison of structure solution from powder diffraction data with a DFT-calculated model (full lattice relaxation with CASTEP V8.0 PBE-DFT,34 plane-wave norm-conserving pseudo-potentials, Ecut-off = 880 eV), shows good agreement between experimentally determined and theoretically calculated positions of CO molecules binding to the corresponding CuI atoms.
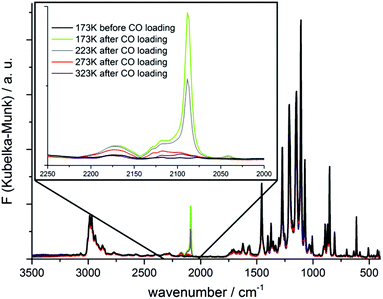
The adsorption of CO in CFA-8 was further studied by diffuse reflectance Fourier-transform IR spectroscopy (DRIFT). The recorded IR spectra are shown in Fig. 15. The pre-dried and activated CFA-8 was cooled down to 173 K and the IR spectrum was recorded under nitrogen atmosphere (black curve Fig. 15). After this measurement the N2 atmosphere in the reaction chamber was replaced by CO (5% CO in Ar) for one minute and changed again to N2 atmosphere. The corresponding FT-IR spectrum pictured in light green shows a strong adsorption band at 2088 cm−1. The temperature was gradually increased resulting in a decrease of the recorded adsorption band. The additional bands arising at 2173 cm−1 and 2117 cm−1 belong to free CO molecules in the gas phase. The recorded band at 2088 cm−1 corresponds to the stretch mode of the CO molecule coordinatively bound at the CuI site. The vibrational frequency is shifted to lower wavenumber as compared to those of the free gas molecule and stays in good agreement with similar literature-known systems.33,35–37
Preliminary examination for catalytic activity
Since the open coordination sits at the coordinatively unsaturated Cu1/Cu3 center in the CFA-8 framework could be very interesting for catalytic applications, a simple oxidation test reaction in liquid phase was performed (Scheme 3). The oxidation of ethylbenzene was previously employed for similar purposes in our reports on 3d transition metal-containing metal–organic frameworks MFU-1 and MFU-4large.15,38 | ||
| Scheme 3 Liquid-phase oxidation of ethylbenzene catalyzed by CFA-8 (0.2 mol%) and NHPI (10 mol%) as a co-catalyst. | ||
Coordinatively unsaturated CuI ions in a porous framework are promising active sites for catalytic applications. The test reaction reported here involves NHPI (N-hydroxyphthalimide) as a co-catalyst and represents an effective strategy to activate oxygen from air under mild conditions in the presence of transition metal ions. The so-formed PINO (phthalimide N-oxyl) radical acts as initiator for the radical oxidation of C–H bonds.15 The mechanism of this type of reaction has been described by Ishii et al. in detail.39–43 An induction period at the beginning of the reaction indicates the slow formation of PINO radicals needed as an initiator. The reaction was performed in acetonitrile under oxygen abstracted from the atmosphere. The only detected product of the oxidation reaction of ethylbenzene catalyzed by CFA-8 is acetophenone. The conversion of ethylbenzene reached after 70 h reaction time is around 60% and is nearly equal to the yield of acetophenone determined by GC/MS analysis (Fig. 16). No 1-phenylethanol as a by-product was detected. Very similar values for the conversion of ethylbenzene and the total yield of acetophenone indicate that no over-oxidation and formation of benzoic acid takes place under these mild reaction conditions. The remaining crystallinity of the recovered catalyst was checked after each run (see Fig. S7†). Also the performance of the recycled copper MOF was proven. At least for three runs the activity for the oxidation reaction and also the crystallinity of the CFA-8 network remains the same. The value for BET surface of the catalyst recovered after complete catalytic reaction is about 503 m2 g−1 – close to the original value of 518 m2 g−1. To confirm the heterogeneous nature of the catalytic test reaction, we performed a hot-filtration experiment, since it was known that even small amounts of leached metal ions in the solution could be a single source of the observed catalytic activity.38 After seven hours, the CFA-8 particles were removed from the reaction mixture by isothermal filtration. The recorded process for the filtered reaction mixture showed no significant conversion after removal of the CFA-8 catalyst.
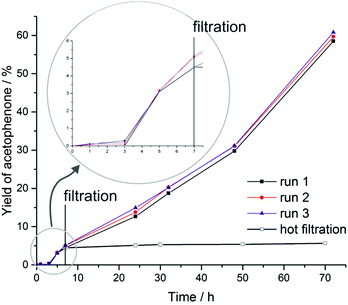 | ||
| Fig. 16 Time-dependent formation of acetophenone in the CFA-8 catalyzed oxidation reaction of ethylbenzene with NHPI as a co-catalyst. | ||
Conclusion
In conclusion, we have synthesized and structurally characterized a novel metal–organic framework CFA-8 constructed from tqpt2− ligands and Cu(I) ions as metal nodes. The Coordination Framework Augsburg University-8 is to the best of our knowledge the first example for a copper(I) MOF incorporating a bistriazolate ligand. A special feature of the here reported structure is its flexible character. The breathing effect, which is common for several MOF structures, is completely reversible as shown by the recorded powder XRD patterns.Owing to the flexible nature of the framework its gas sorption properties are quite complex. Both adsorption/desorption isotherms (Ar and CO2) exhibit a strong hysteresis, which is an indication for the flexible character of the network. The calculated heat of adsorption for hydrogen is constant at 6 kJ mol−1 and typical for physisorbed hydrogen. In contrast the value for reversible chemisorbed hydrogen in CuI-MFU-4large is 37 kJ mol−1.33 A special focus for the CFA-8 is placed on the sorption properties towards carbon monoxide. From low loading on up to 0.9 mmol g−1 the loading-dependent heat of adsorption values range from 37–16 kJ mol−1. From 0.9 mmol g−1 to higher loading the value is nearly constant at 15–16 kJ mol−1. The weak chemisorption of CO molecules at the unsaturated trigonally coordinated Cu(I) ions is very interesting for applications such as gas separation or sensing and was further confirmed by synchrotron powder diffraction and IR measurements which revealed a characteristic absorption band at 2088 cm−1 corresponding to the CuI–CO complex.
A last feature of this novel MOF is the catalytic activity of the framework. A first preliminary examination for the catalytic activity was performed with a simple liquid phase oxidation reaction. The oxidation of ethylbenzene under mild conditions catalyzed by CFA-8 in the presence of NHPI as a co-catalyst leads to acetophenone as a single product. No byproduct, such as 1-phenylethanol or benzoic acid, is detectable. The relatively high conversion of 60% was achieved in this reaction. Further investigations on the sorption properties and the catalytic activity are the research focus in the next time.
Experimental
Materials and methods
All starting materials were of reagent grade and used as received from the commercial supplier. Thermogravimetric analysis (TGA) was performed with a TGA Q500 analyzer in the temperature range of 25–800 °C in flowing nitrogen and synthetic air at a heating rate of 10 K min−1. Ar, CO, CO2 and H2 sorption isotherms were measured with a BELSORP-max instrument combined with a BELCryo system. Adsorbed gas amounts are given in cm3 g−1 [STP], where STP = 101.3 kPa and 273.15 K. Prior to measurements, the sample was heated at 250 °C for 20 h in high vacuum in order to remove occluded solvent molecules. Fourier transform infrared (FTIR) spectra were recorded with ATR in the range 4000–400 cm−1 on a Bruker Equinox 55 FT-IR spectrometer. Energy-dispersive X-ray spectroscopy (EDX) was performed with a Philips XL 30 FEG scanning electron microscope equipped with an EDAX SiLi detector. Elemental analyses were measured with a Vario EL III instrument from Elementar Analysensysteme GmbH. GC/MS measurements were performed on a Hewlett Packard GC System 6890 Series equipped with Rtx-5MS column and mass selective detector MSD 5973. Powder X-ray diffraction data were collected in the 2θ range with 0.02° steps, with a time of 3 s per step, by using a Seifert XRD 3003 TT diffractometer equipped with Meteor 1D detector. The diffuse reflectance Fourier-transform IR spectra (DRIFT) were collected between 3500–400 cm−1 on an Equinox 55 FT-IR spectrometer equipped with a Praying Mantis diffuse reflectance accessory and an environmental chamber (Harrick Scientific Products) and referenced to KBr. The H2-tqpt ligand was synthesized in three steps from commercially available 5,5-dimethylcyclohexane-1,3-dione. The following methylation and oxidation reactions are documented in literature.18,44,45 The 1H-benzotriazole-5,6-diamine was synthesized as described in literature.19–21Synthesis of 6,6,14,14-tetramethyl-6,14-dihydroquinoxalino-[2,3-b]phenazinebistriazole, (H2-tqpt)
The H2-tqpt ligand is synthesized as previously described in literature.22 Accordingly, a suspension of 3,3,6,6-tetramethylcyclohexane-1,2,4,5-tetraone (1.00 g, 5.10 mmol) and 1H-benzotriazole-5,6-diamine (1.60 g, 10.70 mmol) in 200 mL of acetic acid was heated under good stirring to reflux for 24 hours. The obtained dark red solution was cooled with an ice bath and diluted with 400 mL of water to precipitate a solid. The suspension is neutralized with sodium carbonate. During this procedure the suspension turns to yellow. The obtained solid was filtered off and washed with water and a small amount of methanol.Yield: 2.15 g (73%).
Synthesis of CFA-8 (large-pore phase)
A mixture of copper(II)chloride (20.0 mg, 0.15 mmol) and H2-tqpt (5.0 mg, 0.01 mmol) was dissolved in 4 mL of N,N-dimethylacetamide (DMA) and the solution was placed in a glass tube (10 mL). The tube was sealed and heated at 140 °C for 2 days and then cooled to room temperature. The orange precipitate was filtered, washed with DMA (3 × 1 mL) and MeOH (3 × 3 mL) and dried at 250 °C under vacuum.Yield: 7.99 mg (73%). IR (ν (cm−1)): 2968, 1456, 1371, 1272, 1211, 1146, 1105, 850, 806, 613, 426. Elemental analysis calcd (%): C 48.26, H 2.95, N 25.58; found: C 48.29, H 2.99, N 25.70.
N.B.: all trials to synthesize CFA-8 from Cu(I) salt (Cu(I)Cl, Cu(I)Br or Cu(I)Ac) under similar reaction conditions have failed in our hands so far. Similarly, replacing DMA by other organic solvents like N,N-dimethylformamide (DMF), N,N-diethyl-formamide (DEF) or N-methylformamide (NMF) did not yield phase pure CFA-8.
Synthesis of CFA-8 (narrow-pore phase)
An as-synthesized sample of CFA-8 was activated for 20 hours in vacuum at 250 °C. Subsequently the powder sample (15 mg) was suspended in a methanolic solution of trimethyl phosphite (20 mL, 0.3 mmol mL−1). The mixture was stirred for 30 min, filtered and washed with fresh MeOH. The still orange powder was dried for 4 hours at 60 °C per vacuum.Oxidation of ethylbenzene with CFA-8
For preliminary examination for catalytic activity of the Cu(I)-MOF, an easy oxidation reaction was performed with CFA-8 as a catalyst and N-hydroxyphthalimide (NHPI) as a co-catalyst. The XRPD data under CO2 pressure and relative humidity were collected with an Empyrean (PANalytical) Diffractometer equipped with Bragg–BrentanoHD mirror, PIXcel3D 2 × 2 detector and Cryo & humidity Chamber CHC plus+ (Anton Paar).To a solution of ethylbenzene (1.06 g, 10 mmol), NHPI (163 mg, 1.0 mmol) and n-decane (0.71 g, 5 mmol, used as a standard) in acetonitrile/water mixture (98![[thin space (1/6-em)]](https://www.rsc.org/images/entities/char_2009.gif) :
:![[thin space (1/6-em)]](https://www.rsc.org/images/entities/char_2009.gif) 2, 40 mL) was added an activated sample of CFA-8 (27 mg, 0.24 mmol). The suspension was stirred at 40 °C. To analyze the conversion of the reaction 0.1 mL of the mixture was filtered through neutral Al2O3 which was then eluted with Et2O/CH2Cl2/MeOH (10
2, 40 mL) was added an activated sample of CFA-8 (27 mg, 0.24 mmol). The suspension was stirred at 40 °C. To analyze the conversion of the reaction 0.1 mL of the mixture was filtered through neutral Al2O3 which was then eluted with Et2O/CH2Cl2/MeOH (10![[thin space (1/6-em)]](https://www.rsc.org/images/entities/char_2009.gif) :
:![[thin space (1/6-em)]](https://www.rsc.org/images/entities/char_2009.gif) 10
10![[thin space (1/6-em)]](https://www.rsc.org/images/entities/char_2009.gif) :
:![[thin space (1/6-em)]](https://www.rsc.org/images/entities/char_2009.gif) 1) and GC/MS measurements were repeated three times for each sample. Ethylbenzene and acetophenone were used as standards for the determination of the conversion and yield. To check the performance and the recyclability of the CFA-8 MOF the catalysis experiment was repeated three times with the same CFA-8 sample recovered after the reaction. After each experiment the XRPD pattern of the framework was examined.
1) and GC/MS measurements were repeated three times for each sample. Ethylbenzene and acetophenone were used as standards for the determination of the conversion and yield. To check the performance and the recyclability of the CFA-8 MOF the catalysis experiment was repeated three times with the same CFA-8 sample recovered after the reaction. After each experiment the XRPD pattern of the framework was examined.
Single-crystal X-ray diffraction
For the single-crystal X-ray measurements, the crystals of [Cu2(tqpt)]·4.25DMA (large-pore phase) were taken from the mother liquor, while the crystals of [Cu2(tqpt)]·0.94P(CH3O)3 (narrow-pore phase) were dried in vacuum (4 h/60 °C) prior to the measurements. The refined solution of the crystals with the composition [Cu2(tqpt)]·0.94P(CH3O)3 describes the crystal system for the narrow-pore phase of CFA-8. These crystals were obtained by an experiment in order to check, if the phosphorus atom of trimethyl phosphite coordinates to the Cu1 atom as observed for CO gas molecules. In this case, the interactions between the P donor atom and the Cu1 atom are not strong enough, but the single crystal structure of the narrow-pore phase of CFA-8 could be solved. The crystals were mounted on a MiTeGen MicroMount and tested on a Bruker diffractometer. X-ray diffraction data for the single crystal structure analysis were collected on a Bruker D8 Venture diffractometer. Intensity measurements were performed using monochromated (doubly curved silicon crystal) MoKα radiation (0.71073 Å) from a sealed microfocus tube. Generator settings were 50 kV, 1 mA. Data collection temperature was −173 °C. APEX2 software was used for preliminary determination of the unit cell.46 Determination of integrated intensities and unit cell refinement were performed using SAINT.47 The structure was solved and refined using the Bruker SHELXTL Software Package.48,49 Selected crystal data and details of structure refinements for CFA-8·4.25DMA and CFA-8·0.94(CH3O)3P are provided in Tables 2 and S3.† Complete crystallographic data for the structures reported in this paper have been deposited in the CIF format with the Cambridge Crystallographic Data Center, 12 Union Road, Cambridge CB21EZ, UK as supplementary publication no. CCDC 1483639–1483641.| CFA-8·4.25 DMA, large-pore phase | |
|---|---|
| Empirical formula | C61H70.25Cu4N24.25O4.25 |
| Formula weight | 1465.32 |
| Temperature (K) | 100(2) |
| Wavelength (Å) | 0.71073 |
| Crystal system | Monoclinic |
| Space group | C2/c (no. 15) |
| Unit cell dimensions (Å) | a = 27.4916(12) Å |
| b = 23.6639(11) Å | |
| c = 11.0002(5) Å | |
| β = 93.7500(14)° | |
| Volume | 7141.0(6) Å3 |
| Z | 4 |
| Density (calculated) (g cm−3) | 1.363 |
| Absorption (mm−1) | 1.237 |
| F(000) | 3024 |
| Crystal size (mm3) | 0.117 × 0.04 × 0.03 |
| Theta range for data collection (°) | 2.27 to 25.09 |
| Refls. collected | 38![[thin space (1/6-em)]](https://www.rsc.org/images/entities/char_2009.gif) 185 185 |
| Refls. unique | 6325 [R (int) = 0.0867] |
| Data/restraints/parameters | 6325/0/312 |
| GooF | 1.047 |
| R 1 [I > 2σ(I)] | 0.0460 |
| wR2 (all data) | 0.1171 |
| Largest diff. peak and hole (e Å−3) | 0.734 and −0.829 |
(VT-)X-ray powder diffraction
VT-XRPD measurements were performed with a Bruker D8 Advance θ–2θ diffractometer in transmittance Bragg–Brentano geometry employing a Göbel mirror, Cu-radiation and equipped with a LYNXEYE 1-D detector. The sample was ground in an agate mortar and loaded into quartz capillaries (Hilgenberg) with 0.5 mm diameter and 0.01 mm wall thickness. The patterns were recorded in a temperature range of 30 to 550 °C, in the 3–60° 2θ range, with a step time of 1 s and a step width of 0.02° 2θ. Temperature program between measurements: 0.5 °C s−1 heating rate, followed by 10 min isothermal steps required for recording diffraction data sets.Variable-temperature synchrotron X-ray powder diffraction measurements of evacuated CFA-8 were performed at temperatures 500 K, 270 K, 170 K, 130 K, 100 K at beamline I12 at Diamond (UK).50 Synchrotron X-ray powder diffraction measurements of CO adsorption in CFA-8 were performed at 100 K, 100 kPa gas pressure. Sample was evacuated before gas loading, cooled down to 100 K, and exposed to CO gas.
Indexing and structure solution by simulated annealing of the crystal structure of CFA-8 with adsorbed CO molecules was performed using TOPAS.51 Subsequent Rietveld refinement52,53 confirmed the crystal structure.
Acknowledgements
Financial support by the DFG (Priority Program SPP 1928 “COORNETs”) is gratefully acknowledged. We thank Diamond Light Source for access to beamline I12-JEEP that contributed to the results presented here.Notes and references
- Procter and Gamble, Ltd., British Patent, 652339, 1947 Search PubMed.
- R. Walker, Anti-Corros. Methods Mater., 1970, 17, 9–15 CrossRef CAS.
- R. Walker, Corrosion, 1973, 29, 290–298 CrossRef CAS.
- J. B. Cotton and I. R. Scholes, Br. Corros. J., 1967, 2, 1–5 CrossRef CAS.
- B.-S. Fang, C. G. Olson and D. W. Lynch, Surf. Sci., 1986, 176, 476–490 CrossRef CAS.
- M. Finšgar, J. Kovač and I. Milošev, J. Electrochem. Soc., 2010, 157, C52–C60 CrossRef.
- Y. Ling, Y. Guan and K. N. Han, Corrosion, 1995, 51, 367–375 CrossRef CAS.
- R. F. Roberts, J. Electron Spectrosc. Relat. Phenom., 1974, 4, 273–291 CrossRef CAS.
- N. Morito and W. Suetaka, J. Jpn. Inst. Met., 1973, 37, 216–221 CAS.
- J. Xiao, B. Y. Liu, G. Wei and X. C. Huang, Inorg. Chem., 2011, 50, 11032–11038 CrossRef CAS PubMed.
- G. Xue and J. F. Ding, Appl. Surf. Sci., 1990, 40, 327–332 CrossRef CAS.
- G. Xue, J. F. Ding, P. Lu and J. Dong, J. Phys. Chem., 1991, 95, 7380–7384 CrossRef CAS.
- J.-J. Liu, Z.-Y. Li, X. Yuan, Y. Wang and C.-C. Huang, Acta Crystallogr., Sect. C: Cryst. Struct. Commun., 2014, 70, 599–602 CAS.
- G. W. Poling, Corros. Sci., 1970, 10, 359–370 CrossRef CAS.
- D. Denysenko, J. Jelic, K. Reuter and D. Volkmer, Chem. – Eur. J., 2015, 21, 8188–8199 CrossRef CAS PubMed.
- D. Denysenko, J. Jelic, O. V. Magdysyuk, K. Reuter and D. Volkmer, Microporous Mesoporous Mater., 2015, 216, 146–150 CrossRef CAS.
- Y. Yu, X.-M. Zhang, J.-P. Ma, Q.-K. Liu, P. Wang and Y.-B. Dong, Chem. Commun., 2014, 50, 1444–1446 RSC.
- Y. Gaoni and E. Wenkert, J. Org. Chem., 1966, 31, 3809–3814 CrossRef CAS.
- A. Kleineweischede and J. Mattay, Eur. J. Org. Chem., 2006, 4, 947–957 CrossRef.
- N. Proust, J. C. Gallucci and L. A. Paquette, J. Org. Chem., 2009, 74, 2897–2900 CrossRef CAS PubMed.
- J. A. Rombouts, J. Ravensbergen, R. N. Frese, J. T. M. Kennis, A. W. Ehlers, J. C. Slootweg, E. Ruijter, K. Lammertsma and R. V. A. Orru, Chem. – Eur. J., 2014, 20, 10285–10291 CrossRef CAS PubMed.
- P. Schmieder, M. Grzywa, D. Denysenko, M. Hambach and D. Volkmer, Dalton Trans., 2015, 44, 13060–13070 RSC.
- J. Xiao, B.-Y. Liu, G. Wei and X.-C. Huang, Inorg. Chem., 2011, 50, 11032–11038 CrossRef CAS PubMed.
- L. Sarkisov and A. Harrison, Mol. Simul., 2011, 37, 1248–1257 CrossRef CAS.
- A. Spek, J. Appl. Crystallogr., 2003, 36, 7–13 CrossRef CAS.
- M. Alhamami, H. Doan and C.-H. Cheng, Materials, 2014, 7, 3198 CrossRef.
- M. Grzywa, C. Gessner, D. Denysenko, B. Bredenkötter, F. Gschwind, K. Fromm, W. Nitek, E. Klemm and D. Volkmer, Dalton Trans., 2013, 42, 6909–6921 RSC.
- A. S. Munn, R. S. Pillai, S. Biswas, N. Stock, G. Maurin and R. I. Walton, Dalton Trans., 2016, 45, 4162–4168 RSC.
- A. Schneemann, V. Bon, I. Schwedler, I. Senkovska, S. Kaskel and R. A. Fischer, Chem. Soc. Rev., 2014, 43, 6062–6096 RSC.
- I. Krummenacher, H. Ruegger and F. Breher, Dalton Trans., 2006, 1073–1081 RSC.
- M. Yan, Z.-Y. Zhou and A. S. C. Chan, Chem. Commun., 2000, 115–116 RSC.
- P. G. Rasmussen, J. E. Anderson and J. C. Bayón, Inorg. Chim. Acta, 1984, 87, 159–164 CrossRef CAS.
- D. Denysenko, M. Grzywa, J. Jelic, K. Reuter and D. Volkmer, Angew. Chem., Int. Ed., 2014, 53, 5832–5836 CrossRef CAS PubMed.
- S. J. Clark, M. D. Segall, C. J. Pickard, P. J. Hasnip, M. I. Probert, K. Refson and M. C. Payne, Z. Kristallogr., 2005, 220, 567–570 CAS.
- E. T. Papish, T. M. Donahue, K. R. Wells and G. P. A. Yap, Dalton Trans., 2008, 2923–2925 RSC.
- K. Fujisawa, T. Ono, Y. Ishikawa, N. Amir, Y. Miyashita, K.-i. Okamoto and N. Lehnert, Inorg. Chem., 2006, 45, 1698–1713 CrossRef CAS PubMed.
- L. M. Berreau, J. A. Halfen, V. G. Young Jr. and W. B. Tolman, Inorg. Chim. Acta, 2000, 297, 115–128 CrossRef CAS.
- M. Tonigold, Y. Lu, A. Mavrandonakis, A. Puls, R. Staudt, J. Möllmer, J. Sauer and D. Volkmer, Chem. – Eur. J., 2011, 17, 8671–8695 CrossRef CAS PubMed.
- Y. Ishii, T. Iwahama, S. Sakaguchi, K. Nakayama and Y. Nishiyama, J. Org. Chem., 1996, 61, 4520–4526 CrossRef CAS PubMed.
- Y. Ishii, S. Sakaguchi and T. Iwahama, Adv. Synth. Catal., 2001, 343, 393–427 CrossRef CAS.
- Y. Yoshino, Y. Hayashi, T. Iwahama, S. Sakaguchi and Y. Ishii, J. Org. Chem., 1997, 62, 6810–6813 CrossRef CAS.
- S. Coseri, Catal. Rev., 2009, 51, 218–292 CAS.
- I. Hermans, L. Vereecken, P. A. Jacobs and J. Peeters, Chem. Commun., 2004, 1140–1141 RSC.
- T. Doerner, R. Gleiter and F. A. Neugebauer, Eur. J. Org. Chem., 1998, 8, 1615–1623 CrossRef.
- R. Gleiter, T. Doerner and H. Irngartinger, Liebigs Ann., 1996, 3, 381–391 Search PubMed.
- APEX2 Version 2011.6, Bruker AXS Inc., 2011.6 edn Search PubMed.
- SAINT Version 8.32B 2013, Bruker AXS Inc Search PubMed.
- G. M. Sheldrick, XL Version 2013/3 Search PubMed.
- G. Sheldrick, Acta Crystallogr., Sect. A: Fundam. Crystallogr., 2008, 64, 112–122 CrossRef CAS PubMed.
- M. Drakopoulos, T. Connolley, C. Reinhard, R. Atwood, O. Magdysyuk, N. Vo, M. Hart, L. Connor, B. Humphreys, G. Howell, S. Davies, T. Hill, G. Wilkin, U. Pedersen, A. Foster, N. De Maio, M. Basham, F. Yuan and K. Wanelik, J. Synchrotron Radiat., 2015, 22, 828–838 CrossRef CAS PubMed.
- A. Coelho, TOPAS (Version 4.2), Coelho Software, Brisbane, Australia, 2007 Search PubMed.
- H. Rietveld, J. Appl. Crystallogr., 1969, 2, 65–71 CrossRef CAS.
- H. Rietveld, Acta Crystallogr., 1967, 22, 151–152 CrossRef CAS.
Footnote |
| † Electronic supplementary information (ESI) available: IR spectra, details of gas sorption measurements, UV/vis spectrum and crystallographic data. CCDC 1483639–1483641. For ESI and crystallographic data in CIF or other electronic format see DOI: 10.1039/c6dt02672a |
| This journal is © The Royal Society of Chemistry 2016 |


