Crystal phase-controlled synthesis, properties and applications of noble metal nanomaterials
Zhanxi
Fan
and
Hua
Zhang
*
Center for Programmable Materials, School of Materials Science and Engineering, Nanyang Technological University, 50 Nanyang Avenue, Singapore 639798, Singapore. E-mail: hzhang@ntu.edu.sg; http://www.ntu.edu.sg/home/hzhang; Fax: +65 67909081
First published on 19th November 2015
Abstract
The functional properties of noble metal nanomaterials are determined by their size, shape, composition, architecture and crystal structure/phase. In recent years, the crystal phase control of noble metal nanomaterials has emerged as an efficient and versatile strategy to tune their properties. In this tutorial review, we will give an overview of the latest research progress in the crystal phase-controlled synthesis of noble metal nanomaterials. Moreover, the crystal phase-dependent chemical and physical properties (e.g. chemical stability, magnetic, electrical and optical properties) and catalytic applications (e.g. oxygen reduction reaction, and oxidation reactions of formic acid, methanol and carbon monoxide) of noble metal nanomaterials are also briefly introduced. Finally, based on the current research status of the crystal phase-controlled synthesis of noble metal nanomaterials, we will provide some perspectives on the challenges and opportunities in this emerging research field.
Key learning points(1) General crystal phase-controlled methods for synthesis of noble metal nanomaterials.(2) The crystal structure of noble metals could change from their bulk phase when the size shrinks to the nanometer scale. (3) Synthetic approaches to 2H and/or 4H hexagonal phases of noble metal nanomaterials, e.g. Au, Ag, Pd and Pt. (4) The chemical and physical properties of noble metal nanomaterials can be significantly affected by their crystal phase. (5) Demonstration of the catalytic activities improved by the rational crystal phase engineering of noble metal nanomaterials. |
1. Introduction
Noble metal nanomaterials have attracted great research interest in the past two decades because of their unique properties associated with a wide range of applications, such as surface enhanced Raman scattering (SERS), near-infrared photothermal therapy, catalysis, clean energy and sensing.1–3 The size, shape, composition, architecture and crystal structure/phase of noble metal nanomaterials are key factors to determine their physical and chemical properties.1,4,5 Until now, the size, shape, composition and architecture-controlled syntheses of noble metal nanomaterials have been well studied.1 Take the shape as a typical example, noble metal nanomaterials with various kinds of shapes, such as nanospheres, nanorods, nanowires (NWs), nanoribbons (NRBs), nanoplates, nanosheets, nanopolyhedra, nanotubes, nanomultipods and nanoframes, have been successfully prepared.1 Moreover, dendritic nanostructures of noble metals, such as hyperbranched Pt nanospheres,6 Au@Pd@Pt and Ag@Pt core–shell nanocrystals with a nanoporous shell,7,8 have also been obtained. However, the crystal phase-controlled synthesis of noble metal nanomaterials still remains a great challenge.Some bulk noble metals, e.g. Au, Ag, Pd, Pt, Rh and Ir, normally crystallize into a very simple high symmetry face-centered cubic (fcc) structure. However, when their size shrinks to the nanometer scale, the surface energy dominates the total systemic energy.9 As a result, the crystal structure of noble metal nanomaterials may change and be different from their bulk counterpart.9–13 For instances, hexagonal close-packed (hcp, 2H type)11 and 4H Au,12 body-centered tetragonal (bct) Ag,14 and hcp Rh nanostructures15 have been prepared recently. Moreover, fcc Ru nanoparticles (NPs) were also synthesized although the bulk Ru crystallizes in the hcp phase.16 In addition, the crystal structure of noble metal nanomaterials can be modulated by changing the external conditions (e.g. temperature3,17 and pressure18) or surface modification.12,19,20 For example, recent studies confirmed that the face-centered tetragonal (fct) bimetallic FePt and trimetallic FePtAu NPs can be prepared from their fcc NPs at high temperature (600 °C).17,21 Another study showed that a phase transformation of Pd nanocubes from fcc to fct structures can be achieved at high pressure (24.8 GPa).18 Our recent studies demonstrated that a complete 2H-to-fcc phase transformation can be realized under ambient conditions by simple ligand exchange or metal coating on the surface of hcp Au square sheets (AuSSs).19,20 Moreover, the 4H-to-fcc phase transformation was also realized via ligand exchange on the surface of 4H Au NRBs under ambient conditions.12
Importantly, the functional properties of noble metal nanomaterials can be significantly tuned via the modulation of their crystal structures.2,4,16,17,22,23 For examples, the chemical stability and catalytic activity of FePt NPs can be greatly improved by changing their crystal structure from the common chemically disordered fcc phase to the chemically ordered fct phase.4 Recently, it was found that the catalytic activity of fcc Ru NPs towards the CO oxidation increases with their particle size, while for the hcp Ru NPs, their catalytic activity decreases with the increase of the particle size.16 As another example, the 2H Ag NW exhibits low-frequency electrical noise of two to six orders of magnitude lower than that of the conventional fcc Ag NW.22 The 4H hexagonal Ag film has much stronger localized surface plasmon resonance (LSPR) absorption in the visible region as compared to that of the general fcc Ag film.23 Therefore, the crystal phase-controlled synthesis of noble metal nanomaterials is of paramount importance. It will provide a new platform for studying their crystal phase-dependent properties and exploring their various promising applications.
In this tutorial review, the recent development of crystal phase-controlled synthesis of noble metal nanomaterials will be summarized by systematically introducing different kinds of synthetic methods, such as high temperature, high pressure, anodized aluminum oxide (AAO)-assisted electrochemical deposition, graphene oxide (GO)-templated synthesis, polyol method, solvothermal synthesis, colloidal method, ligand exchange and metal coating. Then we will briefly discuss the crystal phase-dependent properties of noble metal nanomaterials. After that, the effect of the crystal phase on the catalytic applications of noble metal nanomaterials will be highlighted. Finally, we will provide some perspectives on the challenges and opportunities in this emerging research area.
2. Crystal phases of noble metal nanomaterials
Except Ru and Os, noble metal nanomaterials usually adopt the common fcc structure, giving a characteristic stacking sequence of “ABC” along the [111]f close-packed direction. However, besides the aforementioned fcc structure, recent studies have revealed that noble metal nanomaterials can also crystallize in many other kinds of crystal phases. For instance, although many Au nanocrystals show the simple fcc structure, our recently synthesized ultrathin Au square sheets are observed to crystallize in an uncommon hcp phase, which shows a characteristic stacking sequence of “AB” along the [001]h close-packed direction.11 Our another study indicated that a unique 4H hexagonal phase, which shows a characteristic stacking sequence of “ABCB” along the [001]4H close-packed direction, can be stabilized in ultrathin Au NRBs.12 Theoretical calculations have suggested that the order of structure stability is fcc > 4H > hcp, especially for Au and Ag.23 Take Au as a typical example, the cohesive energy per atom in the fcc, 4H and hcp structures is calculated to be 0 meV, 2.0 meV and 4.9 meV, respectively.23 Meanwhile, bimetallic nanocrystals consisting of noble and 3d-transition metals can crystallize in fct or simple cubic (sc) phases, in which the noble and 3d-transition metal atoms are intermetallically stacked.2,5 Furthermore, structure transformations along the 3- and 4-fold rotational axes of the fcc phase can lead to the formation of trigonal and bct phases, respectively, which have been found in Ag nanocrystals.14,243. Crystal phase-controlled synthetic methods of noble metal nanomaterials
Until now, various kinds of methods have been developed for the crystal phase-controlled synthesis of noble metal nanomaterials. Generally, these methods can be divided into two categories: direct synthesis and crystal phase transformation. The direct synthetic methods, using metal salts as precursors, include the AAO-assisted electrochemical deposition,9,13 GO-templated synthesis,11,25 polyol method,14,16 solvothermal synthesis15 and colloidal method.12,26 On the other hand, strategies based on crystal phase transformation, such as high temperature,2,17,27 high pressure,18,28 ligand exchange12,20 and metal coating,12,19,20 have also been carried out. In this section, we will focus on the introduction of the aforementioned synthetic methods for the crystal phase control of noble metal nanomaterials, as summarized in Table 1.| Synthetic method | Synthesized material | Crystal phase | Shape | Starting material | Ref. |
|---|---|---|---|---|---|
| High temperature | FePt, CoPt, FePtAu | fct | Nanoparticle | fcc FePt, CoPt and FePtAu nanoparticles | 5, 17, 21, 27 and 29–31 |
| CoPt3, Cu3Pt, FePd3, FeAu3, Fe3Au | sc | Nanowire, nanoparticle | fcc CoPt3 nanowires and nanoparticles, fcc Cu3Pt, FePd3, FeAu3 and Fe3Au nanoparticles | 2, 32–35 | |
| High pressure | Pd, Ag | fct | Nanocube, nanoplate | fcc Pd nanocubes, fcc Ag nanoplates | 18 and 28 |
| Ag | Trigonal | Nanoparticle | fcc Ag nanoparticles | 24 | |
| AAO-assisted electrochemical deposition | Ag | 4H | Nanowire | AgNO3 | 9, 13 and 37 |
| 2H | 13 | ||||
| GO-templated synthesis | Au | hcp | Square sheet | HAuCl4 | 11 |
| hcp/fcc | Square-like plate, nanowire | 25 and 38 | |||
| Polyol method | Ag | bct | Nanowire | AgNO3 | 14 |
| Ru | fcc | Nanoparticle | Ru(acac)3 | 16 | |
| Solvothermal synthesis | Rh | hcp | Nanosheet | Rh(acac)3 | 15 |
| Colloidal method | PbPt, BiPt | hcp | Nanorod, nanoplate | Pb(acac)2 and Pt(acac)2, Bi(NE)3 and Pt(acac)2 | 26 and 41 |
| Au | 4H | Nanoribbon | HAuCl4 | 12 | |
| Ligand exchange | Au | fcc | Square sheet, nanoribbon | hcp Au square sheets, 4H Au nanoribbons | 12 and 20 |
| Metal coating | Au@Ag, Au@Pd, Au@Pt | fcc | Square sheet, Rhombic nanoplate | hcp Au square sheets | 19 and 20 |
| Au@Ag | hcp/fcc | Square sheet | hcp Au square sheets | 20 | |
| Au@Ag, Au@Pd, Au@Pt | 4H/fcc | Nanoribbon | 4H Au nanoribbons | 12 | |
3.1. High temperature
Normally, high temperature is used to control the crystal phase of bimetallic nanomaterials, consisting of noble and 3d-transition metals.2,17,27 Typically, bimetallic nanomaterials with the fcc structure are first synthesized and then treated at high temperature, which can initiate the interdiffusion of metal atoms within the crystal lattice and thus result in the formation of new crystal structures.27 In 2000, Sun et al. reported that the crystal structure of FePt NPs can be changed from the fcc to fct phases at high temperature (Fig. 1a).17 In a typical experiment, monodispersed fcc FePt NPs with a tunable size of 3–10 nm were synthesized by the reduction of Pt(acac)2 (acac = acetylacetonate) with diol and the decomposition of Fe(CO)5 in the presence of oleylamine and oleic acid as the capping agents. The obtained FePt NPs showed a chemically disordered fcc structure, in which the Fe and Pt atoms are randomly distributed (Fig. 1b). However, after annealing in high temperature up to 600 °C in a N2-filled glove box, the crystal structure of FePt NPs was transformed from the fcc to chemically ordered fct phase, in which the Fe and Pt atoms are intermetallically stacked (Fig. 1c). Unfortunately, the serious aggregation and sintering of FePt NPs always occurred after annealing at such a high temperature (usually > 500 °C).29 Later, it was found that coating of MgO on the preformed fcc FePt NPs can successfully prohibit the aggregation or sintering during the high-temperature thermal annealing process.30 Importantly, after the thermal treatment, the MgO shell is easily removed with a dilute acid (HCl, 0.5 M), resulting in the formation of well-dispersed fct FePt NPs. But the direct coating of MgO on FePt NPs limited the mobility of Fe and Pt atoms, making it difficult to realize the conversion from fcc to fct structures.30 A following study solved this problem through the formation of Fe3O4 on the surface of FePt NPs before the coating of MgO.31 After the Pt-rich fcc-FePt@Fe3O4@MgO NPs were prepared, which were then converted to the fct-FePt@MgO NPs under reductive annealing, the well ordered fct FePt NPs were obtained by washing them with dilute acid. Very recently, another study demonstrated that fully ordered fct FePt NPs were successfully prepared via high-temperature treatment of the MgO-coated dumbbell-like fcc-FePt–Fe3O4 NPs followed by washing with dilute nitric acid to remove the MgO coating.5 In addition to fct FePt NPs, the CoPt and FePtAu NPs with the chemically ordered fct structure have also been prepared by using the thermal annealing method.21,27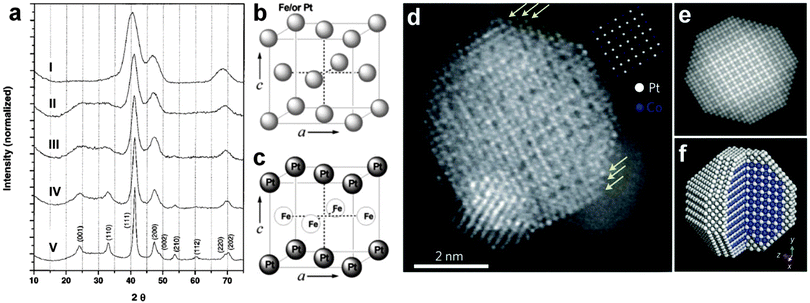 | ||
| Fig. 1 (a) X-ray diffraction (XRD) patterns of (I) 4 nm FePt nanoparticle assembly and (II–V) a series of FePt nanoparticle assemblies annealed under atmospheric N2 gas for 30 min at temperatures of 450 °C (II), 500 °C (III), 550 °C (IV) and 600 °C (V). Reproduced with permission from ref. 17. Copyright 2000, American Association for the Advancement of Science. (b and c) Schematic illustration for the crystal unit cells of fcc (b) and fct (c) FePt NPs. Reproduced with permission from ref. 4. Copyright 2010, American Chemical Society. (d) High angle annular dark field-scanning TEM (HAADF-STEM) image of a chemically ordered sc CoPt3 NP. The yellow arrows indicate the Pt-rich surface. The inset in (d) shows the projected unit cells along the [001] zone axis. (e) Multislice simulated HAADF-STEM image of the idealized NP shown in (d). (f) Idealized atomic structure of the sc CoPt3 NP with a Pt-rich surface. Reproduced with permission from ref. 2. Copyright 2013, Nature Publishing Group. | ||
Besides the aforementioned fct structure, high-temperature annealing of noble metal-based bimetallic nanomaterials can also lead to the formation of the sc phase.2,32–34 As a typical example, Liu et al. found that sc CoPt3 NWs could be synthesized from the fcc CoPt3 NWs by thermal heating.32 Briefly, the fcc CoPt3 NWs with a diameter of approximately 60 nm were first prepared within AAO templates by electrochemical deposition from H2PtCl6 and CoSO4 at a constant potential of 0.73 V. Then the CoPt3 nanowire arrays were annealed at 700 °C for 5 h in 5% H2/N2 to induce a complete phase transformation from chemically disordered fcc to chemically ordered sc structures via a “cluster-in-cluster” transition state by the interdiffusion process.32 After that, free standing sc CoPt3 NWs were obtained by removal of the AAO template in NaOH aqueous solution. Recently, Abruña et al. reported the synthesis of ordered intermetallic sc CoPt3 NPs with a small diameter of 7.2 ± 1.0 nm on the carbon support (Fig. 1d–f).2 In their experiment, the metal salts, i.e. H2PtCl6 and CoCl2, were first adsorbed and well dispersed on the carbon support. After heating the salts at 150 °C for 2 h in H2/N2, fcc CoPt3 NPs on the carbon support were fabricated. Finally, the sc CoPt3 NPs were obtained by annealing of the as-prepared fcc CoPt3 NPs at 700 °C for 2 h in H2. Furthermore, by using the method similar to that for sc CoPt3 NPs, the same group also synthesized ordered intermetallic sc Cu3Pt NPs with an average size of about 12 nm but at a much higher annealing temperature of 1000 °C.34 Moreover, Pd- and Au-based sc bimetallic nanomaterials, such as FePd3, FeAu3 and Fe3Au NPs, have also been obtained by using the high temperature method.33,35
3.2. High pressure
High pressure is another conventional method to realize the crystal phase control of noble metal nanomaterials under harsh conditions.18,28,36 Typically, noble metal nanomaterials with the fcc structure are firstly synthesized and then loaded into a diamond anvil cell. After that, non-fcc structures can be obtained by imposing a high pressure on the fcc noble metal nanomaterials. The pressure-induced crystal phase transformation of noble metal nanomaterials can be in situ monitored by the synchrotron X-ray diffraction. For example, Guo et al. used this method to prepare fct Pd nanostructures by compressing the preformed fcc Pd nanocubes (Fig. 2a).18 The fcc Pd nanocubes with an average edge length of about 9 nm were first synthesized through the reduction of NaPdCl4 in the presence of KBr (Fig. 2b). By loading a pressure of up to 24.8 GPa on the fcc Pd nanocrystals, an uncommon fct structure with a = 3.827 Å, c = 3.705 Å and c/a = 0.968 gradually appeared (Fig. 2c). In contrast, high-pressure compression of Pd nanoplates up to 20.1 GPa cannot realize their fcc-to-fct structure transition. It suggests that the internal crystallinity difference between the nanocubes (single crystal) and nanoplates (contain stacking faults along the [111]f direction) may account for this phenomenon.18 However, Sun et al. recently observed a multiple-step phase change in fcc Ag nanoplates under high pressures.28 The local hcp lamellae, existing as stacking faults in the as-prepared fcc Ag nanoplates, first transformed into a fcc structure at a pressure of 1.03 GPa. A subsequent structure transition of fcc-to-fct was observed at a pressure of 12 GPa. It should be pointed out that the used fcc Ag nanoplates were prepared via a Galvanic reaction between AgNO3 aqueous solution and a heavily doped n-type GaAs wafer in the absence of any organic surfactant molecules and thus they have a clean surface. Therefore, besides the aforementioned internal crystallinity factor, the surface capping organic layers may also affect the structure/phase change of noble metal nanomaterials under high pressure.28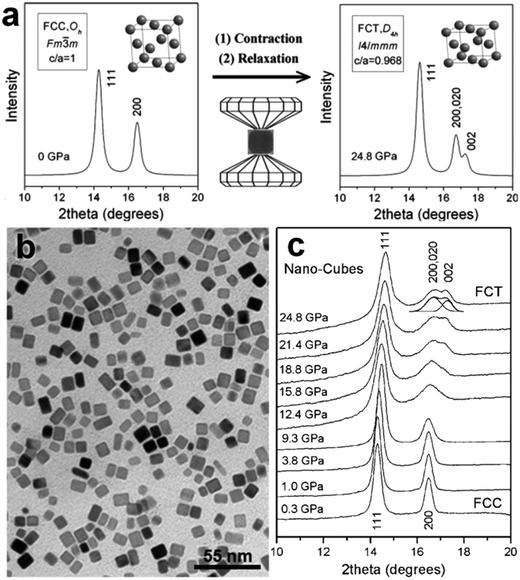 | ||
| Fig. 2 (a) The crystal structures and simulated XRD patterns of fcc and fct phases, and their phase transformation process occurred under high pressure. The axial ratio of c/a for the fct phase was set as 0.88 (≪0.968) in drawing its unit cell. (b) TEM image of the as-prepared fcc Pd nanocubes. (c) XRD patterns of the obtained Pd nanocubes under pressure from 0.3 GPa to 24.8 GPa. Reproduced with permission from ref. 18. Copyright 2008, American Chemical Society. | ||
In addition, it was found that the size can also significantly affect the high pressure-induced phase transformation of noble metal nanomaterials.24,36 Guo et al. have investigated Ag nanocrystals and microcrystals with a size of 50–100 nm and 2–3.5 μm, respectively, by uniaxial compression up to 30 GPa at room temperature.24 Although both Ag nanocrystals and microcrystals underwent a cubic-to-trigonal structure distortion along the three-fold rotational axis, the structure distortion in Ag nanocrystals is much more obvious compared to that occurred in Ag microcrystals.24 Meanwhile, another study showed that Ag NPs with a very small size of 5–10 nm exhibited a structure distortion from cubic to rhombohedral under high pressures of up to 10 GPa.36 Importantly, the high pressure-induced cubic-to-rhombohedral structure change in these small Ag NPs is reversible and linearly pressure-dependent.36
3.3. Anodized aluminum oxide-assisted electrochemical deposition
The AAO-assisted electrochemical deposition is an effective method for the crystal phase-controlled preparation of noble metal nanomaterials, particularly for Ag nanostructures.9,13,37 Typically, porous AAO templates with different pore sizes (from 10 to 100 nm) are first fabricated by the anodization process of aluminum foil. Then the Ag NWs are electrochemically deposited into the as-prepared porous AAO templates in AgNO3 aqueous solution at a constant voltage. Finally, the porous AAO templates are etched away in NaOH solution under ambient conditions to give the free-standing Ag NWs with a controlled crystal structure. In 2002, Zhu et al. observed the 4H structure of Ag in the Ag–Si nanowire heterostructures by using a porous AAO template with pore sizes of 60–140 nm to direct the electrochemical deposition of Ag with alternating current.37 Later on, Ag NWs with the 4H structure were successfully synthesized by using the AAO-assisted electrochemical deposition method (Fig. 3).9 Interestingly, they revealed that the yield of a 4H structure in the final products could be efficiently increased by controlling the diameter of Ag NWs. By tuning the pore size of porous AAO templates, a series of Ag NWs with different diameters of 8–75 nm were prepared. It was found that the production yield of the 4H-phase Ag NWs with a diameter of around 30 nm is the highest. Theoretical calculations indicated that the size effect on the crystal phase of Ag NWs stems from the fact that 4H Ag NWs have a much more favorable surface configuration but higher volume internal energy compared to their fcc counterparts.9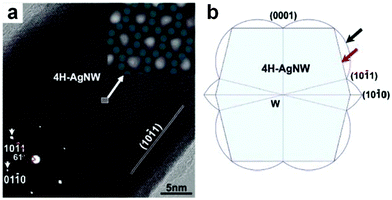 | ||
Fig. 3 (a) High-resolution TEM (HRTEM) image of a typical 4H Ag NW. Insets: the bottom-left inset shows the corresponding selected area electron diffraction (SAED) pattern of the 4H Ag NW shown in (a); the top-right inset shows the zoom-in image of the marked region in (a), which is overlayed with some jade-green dots to indicate the atomic projection of 4H Ag NW paralleling to the zone axis of [![[2 with combining macron]](https://www.rsc.org/images/entities/char_0032_0304.gif) 113]. (b) The simulated cross-section of a typical 4H Ag NW with the Wulff's construction and broken-bond rule, in which the surface of Ag NWs is marked by the red arrow and enclosed by {10 113]. (b) The simulated cross-section of a typical 4H Ag NW with the Wulff's construction and broken-bond rule, in which the surface of Ag NWs is marked by the red arrow and enclosed by {10![[1 with combining macron]](https://www.rsc.org/images/entities/char_0031_0304.gif) 1} and {0001} planes, and the surface energy plot is marked by the black arrow. Reproduced with permission from ref. 9. Copyright 2006, American Chemical Society. 1} and {0001} planes, and the surface energy plot is marked by the black arrow. Reproduced with permission from ref. 9. Copyright 2006, American Chemical Society. | ||
Importantly, recent studies suggested that the kinetics of electrochemical deposition also plays an important role in the formation of different crystal phases of Ag nanostructures.13 For example, Ayyub et al. found that Ag nanostructures with different crystal phases could be obtained by simply adjusting the growth kinetics, which was realized by changing the electrochemical potential.13 In a typical experiment, a mixture of AgNO3 and H3BO4 at a pH value of about 2.5 was used as the electrolyte. The electrochemical deposition of Ag nanostructures within AAO templates was conducted over a wide range of voltages with direct current. As a result, fcc, 4H and 2H (or hcp) polytypes of Ag nanostructures were prepared at constant electrochemical potentials of 3 V, 200 mV and 2 mV, respectively. These polytypes differ from each other with respect to the characteristic stacking sequences along the close-packed directions: “ABC” along the [111]f direction for the fcc polytype, “ABCB” along the [001]4H direction for the 4H polytype, and “AB” along the [001]2H direction for the 2H polytype.13 Moreover, the lattice parameters of the 4H and 2H polytypes of Ag have been calculated to be a = 2.88 Å, c = 10.00 Å and a = 2.83 Å, c = 6.38 Å, respectively.13
3.4. Graphene oxide-templated synthesis
GO sheets, derived from the heavily oxidized graphite, are rich in oxygen functional groups, such as –COOH and –OH, making them promising templates for the nucleation and growth of noble metal nanomaterials.25 Recently, our group developed a GO-templated method for the crystal phase-controlled synthesis of noble metal nanomaterials, especially for the ultrathin anisotropic Au nanostructures.11,25 In 2011, for the first time, we reported the synthesis of ultrathin AuSSs with an uncommon crystal structure of hcp by using GO as a template (Fig. 4).11 In a typical experiment, GO sheets, HAuCl4 (4 mM) and oleylamine were first mixed in a mixed solvent of hexane and ethanol (v/v = 23/2). After that, the mixture in a sealed glass vial was heated in a water bath at 55 °C for 16 h. Finally, hcp AuSSs supported on the GO sheets were collected by centrifugation. These AuSSs have an edge length of 200–500 nm and an ultra-small thickness of about 2.4 nm, corresponding to approximately 16 Au atomic layers. The lattice parameters of hcp AuSSs have been calculated to be a = 2.96 Å and c = 4.84 Å.11 The control experiment indicated that although AuSSs can also be synthesized in the absence of GO sheets, the yield, quality and uniformity of AuSSs are significantly improved by using GO sheets as the template. Time-dependent experiments showed that square-like assembled structures from Au nanodots first formed on the GO sheets at the early stage. Then these Au nanodots gradually fused together to generate square-like Au dendritic nanostructures that were rich in crystal defects. As the reaction proceeds, the square sheet architectures started to appear from the center of dendritic nanostructures and finally evolved into well-defined AuSSs at the expense of the surrounded dendrites via processes of oxidative etching and smoothing.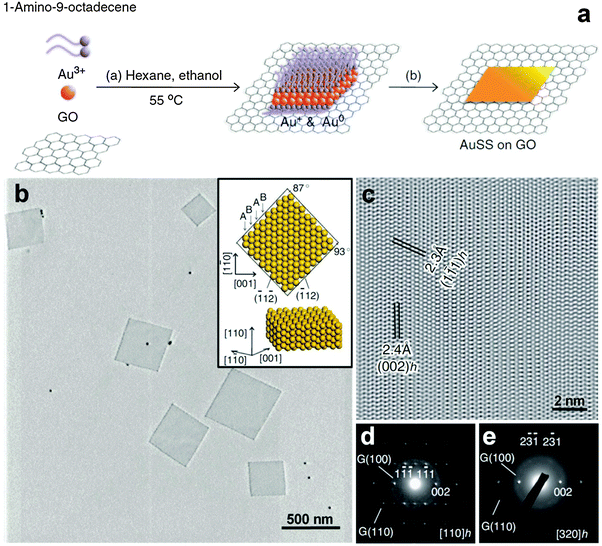 | ||
| Fig. 4 (a) Schematic illustration for the synthetic process of hcp AuSSs on GO sheets. (b) TEM image of hcp AuSSs on the GO surface. Inset: crystallographic models of an hcp AuSS with its basal plane along the zone axis of [110]h. (c) A typical HRTEM image of the hcp AuSSs. (d and e) SAED patterns of a representative hcp AuSS taken along the [110]h (d) and [320]h (e) zone axes. Reproduced with permission from ref. 11. Copyright 2011, Nature Publishing Group. | ||
Interestingly, these hcp AuSSs are electron beam sensitive and undergo a hcp-to-fcc phase transformation after a short time (less than 20 s) of electron beam irradiation.11 Meanwhile, it was observed that when the thickness of AuSSs increases from 2.4 to 6 nm as the reaction time increases from 16 to 28 h, fcc domains begin to appear in the AuSSs, leading to the formation of hcp/fcc mixed structures.11 Actually, besides increasing the reaction time, the thickness of hcp AuSSs can also be increased through the secondary growth of Au on their surfaces.38 Briefly, the as-prepared hcp AuSSs were washed and redispersed into a freshly prepared growth solution that contains HAuCl4 (3 mM), oleylamine, and the mixture of hexane and ethanol (v/v = 23/2), and then heated at 58 °C for 10 h. As a result, Au square-like plates with a thickness of about 5 nm in the center and 7.3 nm in the edge region were obtained (Fig. 5a). Importantly, these Au square-like plates demonstrate the alternating hcp/fcc structure in their center region and a pure fcc structure in their edge area (Fig. 5b–d).
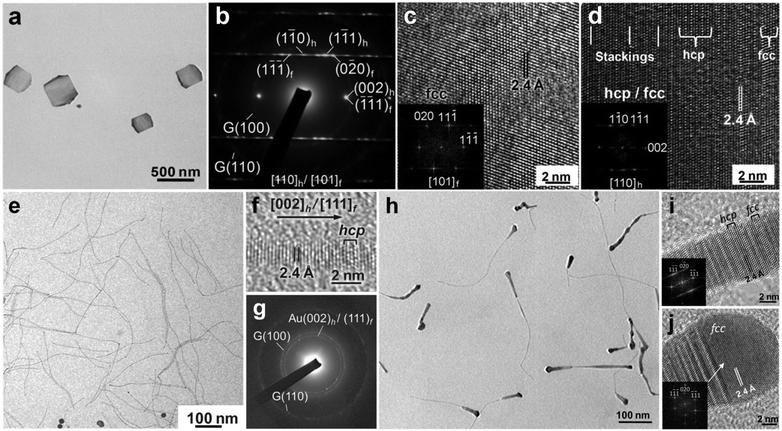 | ||
| Fig. 5 (a) TEM image of typical hcp/fcc Au square-like plates on GO sheets. (b) SAED pattern of a typical hcp/fcc Au square-like plate. (c and d) HRTEM images collected from the edge (c) and center (d) regions of a typical hcp/fcc Au square-like plate. Insets in (c and d): the corresponding fast Fourier transform (FFT) patterns of the HRTEM images shown in (c and d). Reproduced with permission from ref. 38. Copyright 2011, John Wiley & Sons, Inc. (e) TEM image, (f) HRTEM image and (g) SAED pattern of ultrathin hcp/fcc Au NWs on GO sheets. (h) TEM and (i and j) HRTEM images of tadpole-shaped hcp/fcc Au NWs on GO sheets. Inset in (i): the corresponding FFT pattern of the HRTEM image shown in (i). Inset in (j): the corresponding FFT pattern of the fcc domain in the HRTEM image shown in (j). Reproduced with permission from ref. 25. Copyright 2012, John Wiley & Sons, Inc. | ||
In addition to the aforementioned two-dimensional Au nanostructures, i.e. AuSSs and Au square-like plates, we also used the GO-templated method to synthesize ultrathin one-dimensional Au NWs with controlled crystal structures.25 For instance, ultrathin Au NWs with a diameter of about 1.6 nm were successfully synthesized.25 Briefly, the Au NWs were obtained by heating a mixture consisting of GO sheets, HAuCl4 (4 mM), oleylamine and hexane at 55 °C for 36 h. Importantly, the obtained Au NWs exhibit alternating hcp/fcc structures (Fig. 5e–g). The difference of structure and morphology between AuSSs and Au NWs might arise from the solvent polarity effect since the main difference of synthetic conditions is the solvent, i.e. the mixed hexane/ethanol (v/v = 23/2) for AuSSs, and pure hexane for Au square-like plates.11,25 Furthermore, the control experiment revealed that although Au NWs can also be synthesized without GO sheets, the Au NWs prepared on GO sheets do not form densely packed bundles and are well-dispersed on the GO surface because of the hydrophobic interaction between the capping agent (i.e. oleylamine) and GO sheets.25 Interestingly, if the growth solution of Au NWs were heated at 55 °C for 10 h, and then aged at room temperature for another two days, tadpole-shaped Au NWs were obtained, which display the alternating hcp/fcc and pure fcc structures in the tail and head parts, respectively (Fig. 5h–j).25
3.5. Polyol method
Previously, the polyol method was used as an effective and versatile synthetic strategy towards the shape control of various noble metal nanomaterials.1 Recently, it was also used for the crystal phase-controlled synthesis of noble metal nanomaterials, such as Ag and Ru.14,16 Generally, this method involves the use of poly(N-vinyl-2-pyrrolidone) (PVP) as the stabilizing/capping agents, and polyols (e.g. ethylene glycol (EG) and triethylene glycol (TEG)) with high boiling points as both solvents and reducing agents. After the noble metal salts and PVP are dissolved in the polyol solvent, the mixture is heated to reflux, resulting in the nucleation and growth of noble metal nanomaterials. In 2012, Sun et al. observed that a bct phase is stabilized in Ag NWs that are synthesized by the polyol method (Fig. 6a and b).14 Briefly, the Ag NWs with a five-fold twinning structure were synthesized by heating a mixture containing AgNO3, PVP and EG in the presence of a little amount of NaCl and Fe(acac)3 at 160 °C for 1.5 h. The obtained Ag NWs own a pentagonal cross-section (inset in Fig. 6a), which could be regarded as being composed of five fcc subunits that are single crystalline and share their {111}f crystallographic faces. However, according to the simple solid-geometry model, these five subunits cannot fully fill the space and thus result in a solid-angle deficiency of 7.35°, which leads to the generation of lattice strains/defects in the obtained Ag NWs to fill the gap.14 As a result, the bct structure is formed within the Ag NWs owing to the structure distortion induced by the strong lattice strains.14 Meanwhile, it is worth mentioning that every Ag NW is actually a core/shell structure with a tetragonally distorted core and a little distorted shell corresponding to the bct and fcc phases, respectively. Importantly, the bct phase of Ag is stable and can be stored for more than two years under ambient conditions. Furthermore, such a bct phase has also been observed in decahedral Ag NPs with a five-fold twinning structure.14 This further indicates that the five-fold twinning structure is able to generate large lattice strain that is responsible for the tetragonal structure distortion observed in the aforementioned Ag nanostructures.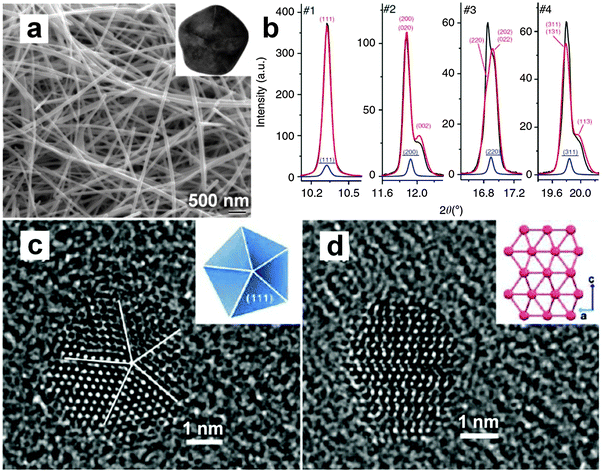 | ||
| Fig. 6 (a) Scanning electron microscopy (SEM) image of mixed bct/fcc Ag NWs. Inset: TEM image of the cross-section of a typical bct/fcc Ag NW. (b) Curves of the experimental high-resolution XRD pattern (black line) of Ag NWs and the fitted XRD patterns against the fct phase (red line) and the fcc phase (blue line). The fct fitting is plotted in the full scale, but the fcc fitting plot in a scale divided by ten. Note that each unit cell of the fct phase here is consisted of two bct unit cells. Reproduced with permission from ref. 14. Copyright 2012, Nature Publishing Group. (c) HRTEM image of a typical fcc Ru NP. Inset: schematic illustration of the decahedral structure. (d) HRTEM image of a representative hcp Ru NP. Inset: schematic illustration of the hcp lattice observed along the [110] direction. Reproduced with permission from ref. 16. Copyright 2013, American Chemical Society. | ||
Importantly, besides the aforementioned five-fold twinning structure, other kinds of internal structures or crystal defects have also been observed in noble metal nanomaterials, such as singly twinning in bypyramids, multiply twinning in icosahedra, and stacking faults in nanoplates.1 As a typical example, Xia et al. found that the internal structure of Pd nanocrystals can be well controlled by tuning the reduction rate of the Pd precursor, which is determined by different kinds of polyols used and the reaction temperature.39 Briefly, if Na2PdCl4 is quickly reduced by EG at 140 °C, truncated octahedral Pd nanocrystals with a single crystalline feature are obtained. If Na2PdCl4 is slowly reduced by diethylene glycol (DEG) at 140 °C, multiple twinned Pd icosahedra are prepared. Interestingly, if the reduction rate of Na2PdCl4 with DEG is decreased by reducing the temperature from 140 °C to 75 °C, stacking-fault-lined Pd nanoplates together with a small amount of multiple twinned Pd icosahedra are synthesized.
In addition to Ag, the polyol method can also be used for the crystal phase-controlled synthesis of Ru NPs.16 For example, Kitagawa et al. have prepared Ru NPs by using Ru(acac)3 or RuCl3·nH2O as the metal precursor, PVP as the capping agent, EG or TEG as the solvent and the reductant.16 Interestingly, they found that the metal precursor and solvent play an important role in the crystal structure of the obtained Ru NPs. By using Ru(acac)3 and TEG as the metal precursor and the solvent, respectively, pure fcc Ru NPs were obtained (Fig. 6c). In contrast, pure hcp Ru NPs were synthesized when RuCl3·nH2O and EG were used as the metal precursor and the solvent, respectively (Fig. 6d). Note that bulk Ru normally adopts the hcp structure. Importantly, the thermal stability test revealed that the fcc-phase Ru NPs are stable up to 450 °C. Besides, the size of fcc Ru NPs could be tuned from 2.4 to 5.4 nm by simultaneously increasing the concentration of Ru(acac)3 and decreasing the concentration of PVP.16
3.6. Solvothermal synthesis
The solvothermal synthesis is typically carried out by heating the growth solution in a tightly sealed autoclave at high temperature. Very recently, for the first time, Li et al. have successfully used this method to synthesize single-layer Rh nanosheets with a unique hcp crystal structure (Fig. 7).15 Note that bulk Rh crystallizes in the common fcc phase. In a typical synthesis, Rh(acac)3 and PVP were firstly dissolved in a mixed solution of benzyl alcohol and formaldehyde. Then the mixture was loaded into a Teflon-lined stainless steel autoclave and heated at 180 °C for 8 h. The obtained hcp Rh nanosheets with an edge length of about 500–600 nm are semitransparent. Similar to the aforementioned ultrathin hcp AuSSs (Fig. 4b), these Rh nanosheets are also electron beam sensitive, indicating their ultrathin thickness. Extended X-ray absorption fine structure (EXAFS) analysis of these Rh nanosheets revealed that the Rh atoms have a very small coordination number of 6.4 ± 0.7, suggesting the single-layer feature of the as-prepared Rh sheets. Importantly, theoretical calculations indicate that the surface energy of the bare Rh sheet can be greatly decreased from 0.126 to 0.071 eV Å−2 upon the adsorption of PVP molecules onto the Rh sheet.15 Indeed, seriously aggregated Rh nanosheets were obtained in the absence of PVP. Moreover, it should be pointed out that the use of formaldehyde might also be of high importance for the successful synthesis of these ultrathin Rh nanosheets. As known, formaldehyde is easily decomposed at high temperature to produce CO molecules, which have been efficiently used for the synthesis of ultrathin Pd nanosheets by Zheng and coworkers because of the particularly strong and unique interaction between transition metal atoms and CO molecules.40 Therefore, the CO molecules may also contribute to the growth and stabilization of these single-layer Rh nanosheets.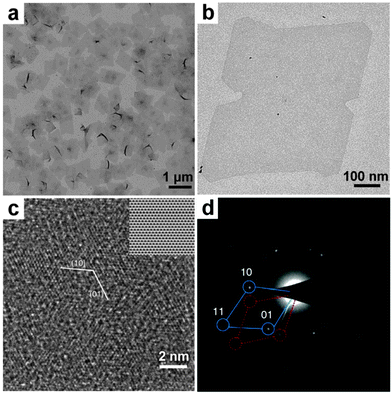 | ||
| Fig. 7 (a) Low- and (b) high-magnification TEM images of hcp Rh nanosheets. (c) Aberration-corrected HRTEM image of hcp Rh nanosheets. Inset: the corresponding filtered HRTEM image using the crystallographic method. (d) A typical SAED pattern of hcp Rh nanosheets. Reproduced with permission from ref. 15. Copyright 2014, Nature Publishing Group. | ||
3.7. Colloidal method
The colloidal method is a traditional way to synthesize inorganic nanocrystals including semiconductors and metals. Recently, it has been successfully used for the crystal phase-controlled synthesis of different noble metal nanomaterials, such as PbPt, BiPt and Au.12,26,41 In 2008, Yang et al. reported the colloidal synthesis of PbPt nanorods with a unique hcp structure by using the standard Schlenk line technique.26 Note that bulk Pb and Pt adopt the simple fcc structure. In a typical experiment, Pb(acac)2 and Pt(acac)2 were co-reduced with tert-butylamineborane in the presence of hexadecanethiol, adamantanecarboxylic and hexadecylamine in diphenylether at 180–200 °C. Interestingly, it was found that the crystal structure of the obtained PbPt nanorods can be controlled by adjusting the temperature and reaction time. High temperature and long reaction time result in the formation of PbPt nanorods with the hcp phase, while Pt-rich PbPt nanorods with the common fcc structure are obtained at a relatively low temperature and short reaction time. By using the same technique, i.e. the Schlenk line technique, the synthesis of hcp BiPt nanoplates was reported by Hou et al.41 Briefly, Pt(acac)2 and Bi(NE)3 (NE = neodecanoate) were simultaneously reduced with oleylamine in the presence of NH4Br at 200 °C. As a result, the BiPt nanoplates with a lateral size of about 42 nm and a thickness of about 6 nm were obtained.Very recently, for the first time, our group reported the high-yield synthesis of Au NRBs with an unprecedented 4H structure by using the colloidal method under mild conditions (Fig. 8).12 In a typical synthetic process, HAuCl4 (3 mM) and oleylamine were first dissolved in a mixed solvent of hexane and 1,2-dichloropropane (v/v = 14/1). The mixture in a sealed glass vial was heated in a water bath at 58 °C for 16 h. After that, 4H Au NRBs were collected by centrifugation. These Au NRBs have a length of 0.5–6.0 μm, a width of 15.0–61.0 nm, and a thickness of 2.0–6.0 nm. The lattice parameters of 4H Au NRBs are estimated to be a = 2.866 Å and c = 9.662 Å (Fig. 8f).12 Control experiment showed that Au NPs with the common fcc structure were obtained in the absence of 1,2-dichloropropane. It is proposed that the addition of 1,2-dichloropropane may affect the reaction kinetics and thus benefit the anisotropic growth of Au to form NRBs with a metastable 4H hexagonal structure.42 Meanwhile, the formation mechanism of these 4H Au NRBs was investigated by time-dependent experiments.12 Ultrathin Au NWs with a diameter of 1.4–2.0 nm, which contains short-range 2H structures together with many random stacking faults, were first formed at the reaction time of 4 h. Then these Au NWs gradually grew into ribbon-like nanostructures with a width of 2.8–5.8 nm by increasing the reaction time from 4 h to 8 h. Impressively, small hexagonal 4H domains were observed in these ribbon-like nanostructures. At the reaction time of 12 h, the width of Au NRBs became 8.0–20.0 nm, along with a 4H hexagonal phase formed over their entire structures. The 2H-to-4H phase transition observed here may be driven by their energy difference as theoretical calculations suggested that 4H Au is much more stable than 2H Au due to its larger cohesive energy per atom.13
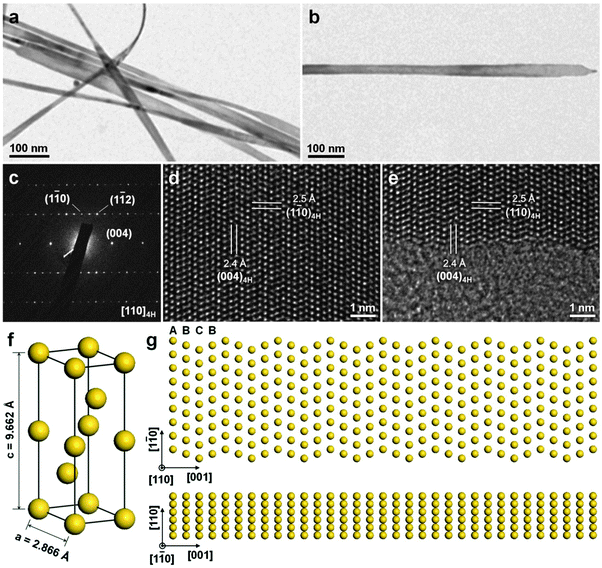 | ||
| Fig. 8 (a) TEM image of typical 4H Au NRBs. (b) TEM image and (c) the corresponding SAED pattern collected along the [110]4H zone axis of a representative 4H Au NRB. (d and e) Aberration-corrected HRTEM images of a typical 4H Au NRB. (f) Schematic illustration of a crystal unit cell of 4H Au. (g) Atomic models showing the top (top panel) and side (bottom panel) views of a typical 4H Au NRB. Reproduced with permission from ref. 12. Copyright 2015, Nature Publishing Group. | ||
3.8. Ligand exchange
Although the aforementioned methods like high temperature and high pressure have been widely used to induce the crystal phase transformation of noble metal NPs, they are not suitable for modulating the crystal phase of ultrathin anisotropic noble metal nanostructures while keeping their sizes and shapes unchanged, since under such extreme conditions, i.e. high temperatures and high pressures, the ultrathin anisotropic noble metal nanostructures are prone to aggregation and/or size or shape change/degradation along with the structure transformation.28,29 Note that the surface energy starts to dominate the total systemic energy of nanomaterials when their size is decreased to the ultrasmall nanoscale.9 Thus it may be possible to manipulate the crystal structure of ultrathin nanomaterials by changing their surface energy via surface modification. Recently, our group has established a method of ligand exchange to induce the crystal structure transition of ultrathin anisotropic noble metal nanostructures.12,20 Different to the high temperature and high pressure methods, this approach is conducted under ambient conditions. As a typical example, we found that ligand exchange on the surface of hcp AuSSs can induce a complete phase transition from hcp to fcc structures, leading to the formation of fcc AuSSs with a unique orientation of (100)f (Fig. 9a–d).20 Typically, the ligand exchange reaction was conducted by simply mixing the hcp AuSS solution with a freshly prepared octadecanethiol (ODT) solution, and then vortexed for 5 min under ambient conditions. Interestingly, in our experiment, the phase transformation of AuSSs is quite sensitive to the concentration of ODT. Low concentration of ODT (<20 mM) resulted in the formation of poorly crystallized Au structures with irregular shape, while well-defined AuSSs with good crystallinity were formed at high concentration (≥20 mM) of ODT. This experiment suggests that a complete and uniform phase transformation over the entire structure of hcp AuSS requires a sufficient amount of thiol molecules to completely replace the originally capped oleylamine.20 Meanwhile, besides ODT, various kinds of thiol molecules could induce such a phase transformation of hcp AuSSs, no matter they are hydrophobic (e.g. 1-dodecanethiol, 1-octanethiol and 1-propanethiol), hydrophilic (e.g. 11-mercapto-1-undodecanol, 6-mercapto-1-hexanol and 3-mercaptopropionic acid), aromatic (e.g. benzeneethanethiol) or dithiol (e.g. 1,6-hexanedithiol).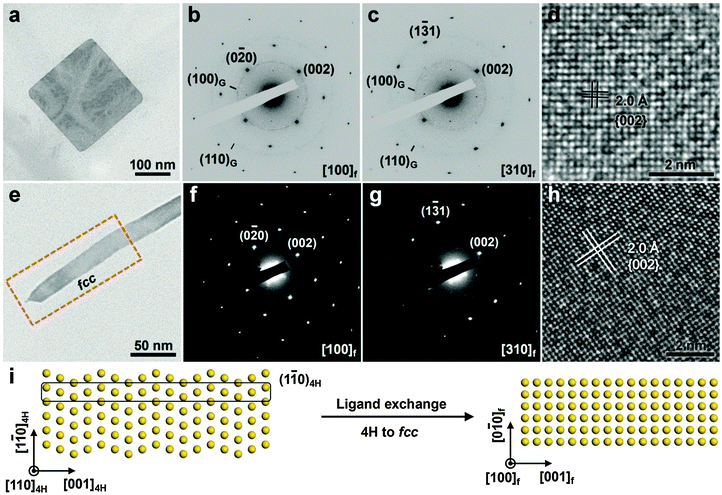 | ||
| Fig. 9 (a) TEM image and (b and c) the corresponding SAED patterns taken along the [100]f (b) and [310]f (c) zone axes of a typical fcc AuSS on GO sheets. (d) A typical HRTEM image of the obtained fcc AuSS. Reproduced with permission from ref. 20. Copyright 2015, Nature Publishing Group. (e) TEM image of a typical 4H Au NRB after the ligand exchange. (f and g) SAED patterns taken from the marked area in (e) along the [100]f (f) and [310]f (g) zone axes. (h) A typical HRTEM image collected from the marked area in (e). (i) Schematic illustration of the ligand exchange induced phase transformation of 4H Au NRBs. Reproduced with permission from ref. 12. Copyright 2015, Nature Publishing Group. | ||
Remarkably, it was found that the close-packed directions (i.e. [001]h for hcp and [111]f for fcc) of AuSSs were changed after the ligand exchange-induced phase transformation, which is a new phase transformation mechanism of metals.20 Note that the phase transitions of metals with close-packed structures (e.g. hcp and fcc) normally proceed by the motion of partial dislocations on their close-packed planes, leading to the formation of twins/stacking faults or the mixed hcp/fcc structures.11,38 Meanwhile, the close-packed directions are usually preserved during the phase transformations of metals.11,38 Previous studies suggest that sulfur-containing chemical species can cause surface reconstructions of metal films and tend to form overlayers with high coordination numbers (e.g. fcc(100) that has a four-fold hollow site).43 Furthermore, H2S molecules have been observed to induce the faceting of spherical Pt NPs to form {100}f enclosed nanocubes.44 Therefore, the thiol molecule-induced phase transformation of hcp AuSSs may be initiated by a (100)f surface reconstruction, followed by a complete phase transformation over their entire structures.20
In addition to the aforementioned hcp AuSSs, the ligand exchange method can also be used for the structure manipulation of 4H Au NRBs.12 Briefly, the ligand exchange-induced phase change of 4H Au NRBs was conducted by mixing the Au NRB solution with a fresh 1-dodecanethiol solution and then vortexed for 5 min under ambient conditions. Interestingly, the close-packed direction of Au NRBs was also changed after the phase transition, resulting in the formation of a (100)f-oriented fcc nanostructure (Fig. 9e–h). Such a unique phase transformation from the (110)4H-oriented 4H to (100)f-oriented fcc structures could be seen as a process of the flattening of (1![[1 with combining macron]](https://www.rsc.org/images/entities/char_0031_0304.gif) 0)4H planes (Fig. 9i).12 This experimental observation further indicates that thiol molecules may favor the formation of overlayers with high coordination numbers upon their adsorption on the metal surface.
0)4H planes (Fig. 9i).12 This experimental observation further indicates that thiol molecules may favor the formation of overlayers with high coordination numbers upon their adsorption on the metal surface.
3.9. Metal coating
Metal coating is another kind of surface modification strategy to realize the crystal phase control of ultrathin anisotropic noble metal nanostructures under ambient conditions.20 Importantly, the metal coating method has provided a new way to synthesize noble bimetallic nanomaterials with controlled or novel shape and crystal structures, which cannot be obtained via conventional wet-chemical strategies.12,19,20 Recently, for the first time, our group observed that the coating of Ag on the surface of hcp AuSSs could induce a complete phase transformation from (110)h-oriented hcp to (100)f-oriented fcc structures under ambient conditions, leading to the formation of fcc bimetallic Au@Ag core–shell square sheets with a unique orientation of (100)f (Fig. 10a–d).20 In a typical synthesis, Ag was deposited onto hcp AuSSs by reducing AgNO3 with L-ascorbic acid or NaBH4 in the absence of oleylamine. The fcc Au@Ag square sheets with a thickness of 3.0–4.6 nm were obtained. Similar to the aforementioned ligand exchange, the Ag coating induced phase change of hcp AuSSs is quite sensitive to the concentration of AgNO3. Low concentration of AgNO3 could lead to the formation of irregularly shaped Au@Ag nanostructures with a poor crystallinity. Importantly, the Ag shell was epitaxially grown on the Au core in the obtained fcc Au@Ag core–shell square sheets (Fig. 10e).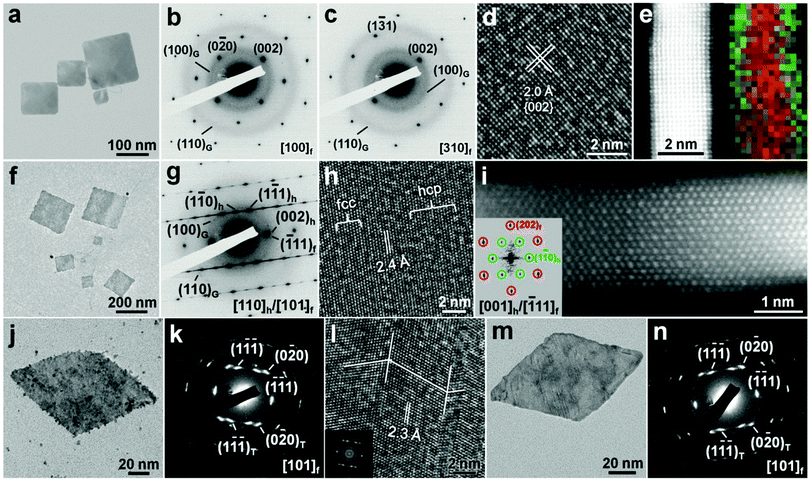 | ||
Fig. 10 (a) Bright-field TEM image of typical fcc Au@Ag square sheets on GO sheets. (b and c) SAED patterns taken along the [100]f (b) and [310]f (c) zone axes of an fcc Au@Ag square sheet. (d) A typical HRTEM image of fcc Au@Ag square sheets. (e) Aberration-corrected HAADF-STEM image and the corresponding overlapped STEM-EDS elemental mapping (Au: red color; Ag: green color) showing the cross-section of a typical fcc Au@Ag square sheet. (f) Bright-field TEM image of typical hcp/fcc Au@Ag square sheets on GO sheets. (g) SAED pattern and (h) HRTEM image of a representative hcp/fcc Au@Ag square sheet. (i) Aberration-corrected HAADF-STEM image of the cross-section of an hcp/fcc Au@Ag square sheet collected along the [001]h/[![[1 with combining macron]](https://www.rsc.org/images/entities/char_0031_0304.gif) 11]f zone axes. Inset: the corresponding FFT pattern of the HAADF-STEM image shown in (i). Reproduced with permission from ref. 20. Copyright 2015, Nature Publishing Group. (j) TEM image, (k) SAED pattern and (l) HRTEM image of a typical fcc Au@Pt rhombic nanoplate. Inset in (l): the corresponding FFT pattern of the HRTEM image shown in (l). (m) TEM image and (n) the corresponding SAED pattern of a typical fcc Au@Pd rhombic nanoplate. Reproduced with permission from ref. 19. Copyright 2015, John Wiley & Sons, Inc. 11]f zone axes. Inset: the corresponding FFT pattern of the HAADF-STEM image shown in (i). Reproduced with permission from ref. 20. Copyright 2015, Nature Publishing Group. (j) TEM image, (k) SAED pattern and (l) HRTEM image of a typical fcc Au@Pt rhombic nanoplate. Inset in (l): the corresponding FFT pattern of the HRTEM image shown in (l). (m) TEM image and (n) the corresponding SAED pattern of a typical fcc Au@Pd rhombic nanoplate. Reproduced with permission from ref. 19. Copyright 2015, John Wiley & Sons, Inc. | ||
Interestingly, if the coating of Ag on hcp AuSSs was carried out by using oleylamine as the reducing agent, bimetallic Au@Ag core–shell square sheets with mixed hcp/fcc structures were synthesized (Fig. 10f–h).20 These alternating hcp/fcc Au@Ag square sheets have a thickness of about 2.8 nm. Cross-section analysis indicated that these two metals (i.e. Au and Ag) also have an epitaxial relationship (Fig. 10i). Note that the fcc structure in these hcp/fcc mixed Au@Ag square sheets shows an orientation of (101)f. This kind of phase transformation from (110)h-oriented hcp to (101)f-oriented fcc structures is commonly observed in metals, and can be easily realized by changing the stacking sequence of planes along the close-packed directions.11,38 Meanwhile, the close-packed directions regarding the orientation of nanostructures are preserved after the structure transition.11,38 In addition, control experiments were conducted to study the role of oleylamine in the Ag coating-induced phase transformation. It was found that mixed hcp/fcc Au@Ag square sheets could still be obtained by replacing oleylamine with octylamine (primary amine). However, when oleylamine was replaced with dioctylamine (secondary amine), the (100)f-oriented fcc Au@Ag square sheets were obtained. These experimental results indicate that primary amines may favor the formation of hcp structures.20
Besides Ag coating, the Pt and Pd coating can also induce the phase transformation of hcp AuSSs under ambient conditions, leading to the formation of fcc Au@Pt and Au@Pd core–shell rhombic nanoplates (Fig. 10j–n).19 In a typical synthetic process, Pt and Pd were grown onto hcp AuSSs by reducing H2PtCl6 and H2PdCl4 with NaBH4 in the absence of oleylamine, respectively. The obtained fcc Au@Pt and Au@Pd rhombic nanoplates have a thickness of about 3.5 nm and 3.4 nm, respectively. TEM analysis revealed that both Pt and Pd shells are epitaxially grown on the Au cores. Different from the aforementioned Ag coating in the absence of oleylamine (Fig. 10f–h), the coating of Pt and Pd on hcp AuSSs induced a complete phase transition from the (110)h-oriented hcp structure to the (101)f-oriented fcc structure containing many twins, along with a shape change from square to rhombic (Fig. 10j–n). Such a difference may arise from the much larger lattice mismatch between Pt or Pd and Au compared to that between Ag and Au.19 Besides, it should be pointed out that a little amount (<10%) of (100)f-oriented single-crystalline fcc Au@Pt and Au@Pd square nanoplates was also found to be coexisting with the main products (>90%) of (101)f-oriented fcc Au@Pt and Au@Pd rhombic nanoplates, respectively.19 This phenomenon suggests that other experimental factors, such as solvent polarity, may also affect the metal coating induced phase change of hcp AuSSs.11,25
Alternatively, our group demonstrated that the metal coating method can also be used for the crystal structure modulation of 4H Au NRBs, resulting in the formation of a novel class of polytypic 4H/fcc bimetallic Au@Ag, Au@Pd and Au@Pt core–shell NRBs (Fig. 11).12 Briefly, the Ag coating on 4H Au NRBs was realized by reducing AgNO3 with oleylamine, while the surface coating of Pd and Pt was achieved via the reduction of H2PdCl4 and H2PtCl6 with NaBH4 in the absence of oleylamine, respectively. Different from the aforementioned complete hcp-to-fcc phase change of hcp AuSSs by Pd and Pt coating (Fig. 10j–n), the coating of Pd and Pt on 4H Au NRBs only resulted in a partial phase transition, leading to the formation of mixed 4H/fcc Au@Pd and Au@Pt NRBs (Fig. 11). These experimental findings further indicate that the 4H structure of Au is relatively more stable than the hcp (or 2H) structure.13 Importantly, these metals, i.e. Ag, Pd and Pt, all expitaxially grew on the surface of Au NRBs (Fig. 11c, i and o). Moreover, it is worthy to mention that this is the first-time observation of 4H hexagonal Pd and Pt structures (Fig. 11i and o).12 Therefore, the metal coating method can provide a new way to prepare non-fcc noble metal nanostructures.
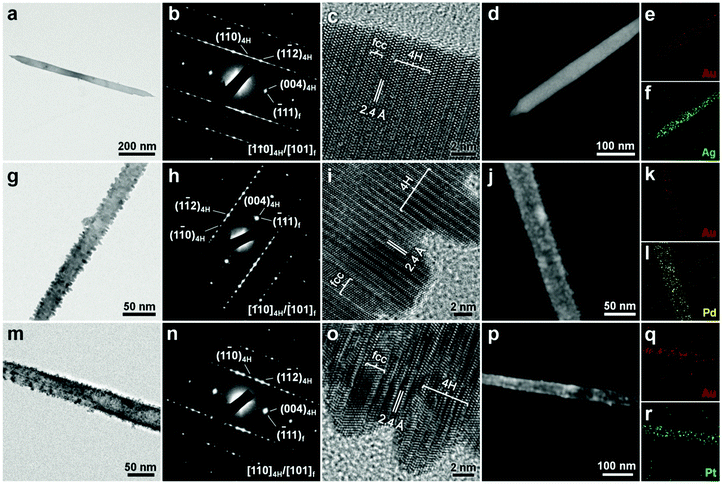 | ||
| Fig. 11 (a) Bright-field TEM image, (b) SAED pattern and (c) HRTEM image of a typical 4H/fcc Au@Ag NRB. (d) HAADF-STEM image and (e and f) the corresponding STEM-EDS elemental mappings of a 4H/fcc Au@Ag NRB. (g) Bright-field TEM image, (h) SAED pattern and (i) HRTEM image of a typical 4H/fcc Au@Pd NRB. (j) HAADF-STEM image and (k and l) the corresponding STEM-EDS elemental mappings of a 4H/fcc Au@Pd NRB. (m) Bright-field TEM image, (n) SAED pattern and (o) HRTEM image of a typical 4H/fcc Au@Pt NRB. (p) HAADF-STEM image and (q and r) the corresponding STEM-EDS elemental mappings of a 4H/fcc Au@Pt NRB. Reproduced with permission from ref. 12. Copyright 2015, Nature Publishing Group. | ||
4. Crystal phase-dependent properties of noble metal nanomaterials
4.1. Chemical stability
The chemical stability of noble metal nanomaterials is one of the most basic requirements for their various important applications.1 As known, the harsh chemical environments, such as strong acidic and vigorous oxidizing conditions, are always involved in the real applications. Under such rigorous chemical conditions, noble metal nanomaterials are prone to de-alloying or oxidation, especially for the bi- and tri-metallic nanostructures consisting of noble metals and 3d-transition metals.4,21 Therefore, it is of high importance to develop new methods to improve the chemical stability of these noble metal nanomaterials. Recently, it was found that FePt NPs become chemically robust towards the strong acidic condition after changing their crystal structure from the chemically disordered fcc to ordered fct structures.4 The fct FePt NPs show no obvious Fe leaching after immersing in 0.5 M H2SO4 solution for 6 h, while the fcc FePt NPs have a heavy Fe loss up to 36.5% within 1 h of being immersed in 0.5 M H2SO4 solution (Fig. 12a). Later on, a following study revealed that the chemical stability of FePt NPs can be further increased through the formation of fully ordered fct FePt NPs.5 Importantly, this kind of crystal structure-dependent chemical stability has also been observed in the other bi- and tri-metallic nanomaterials, such as CoPt3, FePd3, and FePtAu.2,21,33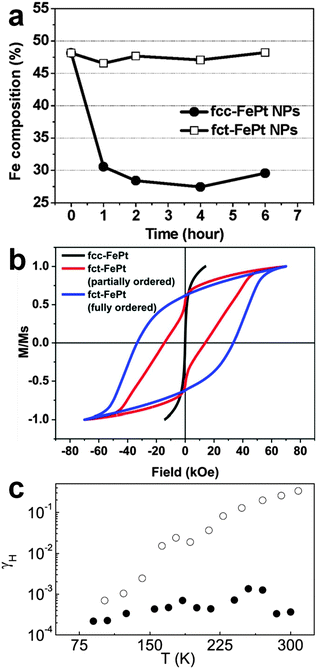 | ||
| Fig. 12 (a) The composition changes of fcc and fct FePt NPs immersed in 0.5 M H2SO4 solution at different times. Reproduced with permission from ref. 4. Copyright 2010, American Chemical Society. (b) Magnetic hysteresis loops of fcc FePt NPs, and partially and fully ordered fct FePt NPs. Reproduced with permission from ref. 5. Copyright 2015, American Chemical Society. (c) The change of Hooge parameter γH (f = 1 Hz) with temperature for the fcc (open circles) and hcp (filled circles) Ag NWs. Reproduced with permission from ref. 22. Copyright 2008, American Institute of Physics. | ||
4.2. Magnetic properties
Some metal nanomaterials, such as FePt NPs, have demonstrated great potential for applications in ultrahigh-density data storage and high-performance permanent magnets because of their unique magnetic properties.17 Interestingly, the magnetic properties of FePt NPs is highly structure-dependent.5,17,30,31 In 2000, Sun et al. observed that the as-prepared FePt NPs with a chemically disordered fcc phase are superparamagnetic (coercivity Hc = 0 Oe) at room temperature, while the high temperature (550–600 °C) annealed FePt NPs with a chemically ordered fct phase are ferromagnetic and have an in-plane coercivity of 1.8 kOe, owing to the strong d-electron interactions between Fe and Pt in the ordered fct phase.17 A following study showed that fct FePt NPs prepared from higher temperature (≥700 °C) annealing of fcc-FePt@MgO NPs are well ordered with a coercivity up to 10 kOe (or 1 T) and a magnetization of 56.4 emu g−1 at room temperature.30 Note that the direct coating of MgO on FePt NPs decreases the atomic mobility of Fe and Pt, and thus makes it difficult to realize the phase change from fcc to fct.30 Later on, it was reported that fct FePt NPs prepared from annealing of fcc-FePt@Fe3O4@MgO NPs at 650 °C are highly ordered and exhibit a coercivity up to 20 kOe (or 2 T) at room temperature.31 In order to further improve the ferromagnetic properties of FePt NPs, very recently, the same group has developed another method to prepare fct FePt NPs by annealing of MgO-coated dumbbell-like fcc-FePt-Fe3O4 NPs at 700 °C.5 Interestingly, both partially and fully ordered fct FePt NPs could be easily obtained by annealing the fcc FePt NPs at 700 °C for 1 h and 6 h, respectively. As expected, the fully ordered fct FePt NPs display the highest coercivity up to 33 kOe (or 3.3 T) compared to that of partially ordered fct FePt NPs (14 kOe) at room temperature (Fig. 12b). In addition to FePt NPs, the phenomenon of structure ordering-induced magnetic enhancement has also been found in CoPt3 NWs, FeAu3 and Fe3Au NPs.32,354.3. Electrical properties
Noble metal nanomaterials, especially one-dimensional nanostructures like NWs, hold great promise for being used as interconnects in integrated circuits because of their high chemical stability and excellent electrical properties.22,45 To date, although the size-dependent electrical properties of noble metal NWs have been well investigated, little attention has been paid to the influence of their crystal structures.22 Recently, it was found that the crystal phase can greatly affect the electrical resistivity of noble metal NWs, such as Ag.22,23,45 For instance, 4H Ag NWs have a resistivity of 19.9 μΩ cm, which is almost 1.7 times of that of fcc Ag NWs (11.9 μΩ cm).45 Very recently, it was observed that, when compared to the common fcc structure of Ag, the 4H Ag NW film demonstrates a 130-fold higher and strongly anisotropic in-plane resistivity.23 Importantly, besides resistivity, the crystal structure can also significantly affect the low-frequency electrical noise in noble metal NWs.22 As a typical example, Singh et al. reported that the low-frequency electrical noise in hcp Ag NWs is two to six orders of magnitude lower in comparison with the Ag NWs with a normal fcc structure (Fig. 12c).22 It was proposed that the motion of dislocation, which is most likely the main source of electrical noise in metal NWs, is greatly diminished in the hcp structure.224.4. Optical properties
Noble metal nanomaterials exhibit unique optical properties derived from the well-known LSPR, which is the coherent oscillation of surface conduction electrons of noble metal nanomaterials excited by the electromagnetic radiation.1 It has been well documented that the LSPR absorption of noble metal nanomaterials is mainly determined by their size, shape, composition, and local environment.1,40 However, recent studies indicated that the crystal structure of noble metal nanomaterials can also significantly affect their LSPR absorption.12,23 For instance, it has been observed that the unique 4H Ag NW film shows a yellow color and has a much stronger LSPR absorption in the visible region compared to that of the common fcc Ag NW film that exhibits a white color.23 Moreover, the bulk plasmon absorption in 4H Ag is slightly blue shifted, about 5 nm, compared to that of the fcc Ag.23 Very recently, for the first time, our group has studied the individual Au NRB with monochromated electron energy loss spectroscopy (EELS) (Fig. 13).12 This 4H Au NRB exhibits a strong LSPR absorption in both visible and infrared regions (Fig. 13b). The experimental monochromated EELS mappings further reveal that low-order harmonic resonances are produced by the low-energy LSPR eigenmodes and the harmonic order increases with the LSPR energy (Fig. 13h). Most importantly, theoretical calculations suggest that, in comparison with the fcc Au (Fig. 13f), the optical response of 4H Au NRB displays a much smaller number of LSPR peaks in the range of 0–2.5 eV and red shift for all the LSPR peaks from excitation position “I” to position “IV” (Fig. 13e).12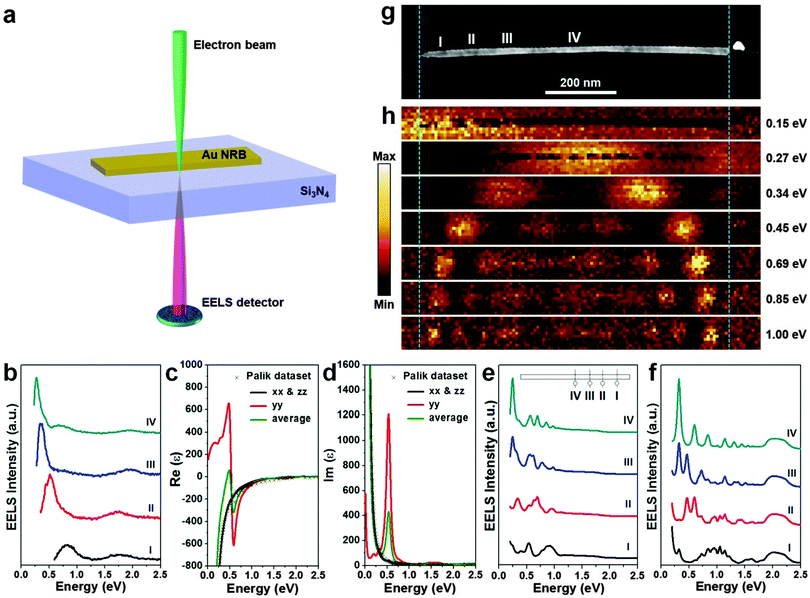 | ||
| Fig. 13 (a) Schematic illustration for the monochromated EELS characterization of individual 4H Au NRBs. The focused incident electron beam is located a few nanometers away from the Au NRB to excite and measure its LSPR absorption. (b) EELS spectra taken from a single 4H Au NRB at the positions marked in the HAADF-STEM image in (g). (c and d) The density functional theory (DFT) calculated dielectric function of 4H Au thin film with a thickness of 4 nm in its y direction. (e) Simulated EELS spectra of a 4H Au NRB based on the dielectric function in (c and d) using the finite element method (FEM) with an electron beam. Inset: theoretical model of a single Au NRB, on which the excitation positions are indicated. (f) Simulated EELS spectra of an fcc Au NRB with dielectric function taken from Palik at same excitation positions as (e). (g) HAADF-STEM image and (h) the corresponding EELS maps at different energy losses of an individual 4H Au NRB. Reproduced with permission from ref. 12. Copyright 2015, Nature Publishing Group. | ||
5. Crystal phase-dependent applications of noble metal nanomaterials
5.1. Oxygen reduction reaction
Oxygen reduction reaction (ORR) is a very important cathodic reaction in the proton exchange membrane fuel cell, which has been considered as a promising green alternative to the traditional internal combustion engine.34 Noble metal nanomaterials, particularly the Pt-based alloys, have been widely used as catalysts for the ORR.2–5,34 Previous efforts on increasing the ORR catalytic performance of Pt-based alloy nanostructures were mainly focused on tuning their sizes, shapes and compositions.46 Recently, it was found that the rational structure modulation of these Pt-based alloy nanostructures can also significantly improve their catalytic activities for ORR.2–5 In 2010, it was reported that the catalytic activity of chemically ordered fct FePt NPs is almost 1.8 times of that of the chemically disordered fcc FePt NPs towards the ORR at the half-wave potential, arising from the strong d-electron interaction between Fe and Pt atoms in the chemically ordered fct phase.4 Later on, it was observed that the catalytic activity of fct FePt NPs for ORR is further increased via coating a thin layer of the Pt shell, which can induce a lattice strain on the Pt shell because of the structure mismatch between the fct FePt core and the fcc Pt shell.3 The lattice strain could result in Pt–Pt bond compression and d-band down-shift, weakening the interaction between Pt and oxygenated species and thus increasing the catalytic activity.3 Very recently, it was shown that the ORR catalytic activity of FePt NPs under acidic conditions can be greatly improved by systematically tuning their crystal structures from fcc to partially and fully ordered fct phases (Fig. 14).5 As a result, the fully ordered fct FePt NPs demonstrate the largest half-wave potential at 0.958 V compared to that of commercial Pt, fcc FePt and partially ordered fct FePt NPs (Fig. 14a). Meanwhile, the fully ordered fct FePt NPs also exhibit the biggest specific and mass activities of 3.16 mA cm−2 and 690 mA mgPt−1 at 0.9 V, which are almost 11 and 5 times of those of the commercial Pt (0.28 mA cm−2 and 130 mA mgPt−1), respectively (Fig. 14b and c). Moreover, these fully ordered fct FePt NPs hold remarkable catalytic durability under the ORR test condition. No obvious catalytic activity loss was observed even after 20![[thin space (1/6-em)]](https://www.rsc.org/images/entities/char_2009.gif) 000 potential cycles (Fig. 14d). Importantly, after testing for 20
000 potential cycles (Fig. 14d). Importantly, after testing for 20![[thin space (1/6-em)]](https://www.rsc.org/images/entities/char_2009.gif) 000 potential cycles, the chemically ordered fct structure, composition and morphology of FePt NPs were all well preserved (Fig. 14e and f).
000 potential cycles, the chemically ordered fct structure, composition and morphology of FePt NPs were all well preserved (Fig. 14e and f).
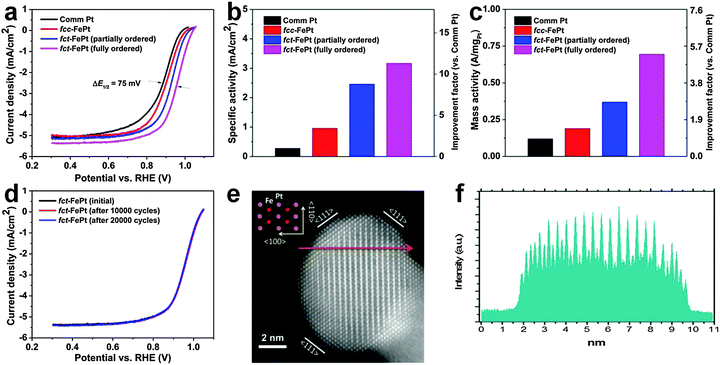 | ||
Fig. 14 (a) The ORR polarization plots of commercial Pt, fcc FePt, partially and fully ordered fct FePt NPs in 0.1 M HClO4 (scan rate: 10 mV s−1; rotating speed: 1600 rpm). (b) The specific activity and (c) mass activity of different catalysts at the potential of 0.9 V. (d) The ORR polarization plots of fully ordered fct FePt NPs before and after potential scans between 0.6 V and 1.0 V. (e) HAADF-STEM image of a typical fully ordered fct FePt NP after 20![[thin space (1/6-em)]](https://www.rsc.org/images/entities/char_2009.gif) 000 potential cycles. Inset: atomic model of the chemically ordered fct structure. (f) The corresponding HAADF line scanning profile along the arrow marked region in (e). Reproduced with permission from ref. 5. Copyright 2015, American Chemical Society. 000 potential cycles. Inset: atomic model of the chemically ordered fct structure. (f) The corresponding HAADF line scanning profile along the arrow marked region in (e). Reproduced with permission from ref. 5. Copyright 2015, American Chemical Society. | ||
Besides Fe, recent investigations revealed that Co and Pt can also form chemically ordered alloy nanostructures that are catalytically active for the ORR.2,34 For example, it was found that the ORR catalytic activity of CoPt3 NPs with a Pt-rich surface under acidic conditions can also be significantly enhanced by changing the crystal structure of CoPt3 NPs from the chemically disordered fcc to chemically ordered sc phases.2 As a result, the ordered sc CoPt3 NPs exhibit a remarkable mass activity of 520 mA mgPt−1 at 0.9 V, which is 3.3 and 8.7 times of that for the disordered fcc CoPt3 NPs (160 mA mgPt−1) and commercial Pt/C (60 mA mgPt−1), respectively. Furthermore, the ordered sc CoPt3 NPs are also much more stable than the disordered fcc CoPt3 NPs. The durability test indicated that, after 5000 potential cycles, the ordered sc CoPt3 NPs only showed a slight degradation of less than 10 mV in its half-wave potential, while the degradation of disordered fcc CoPt3 NPs was more than 30 mV.
However, although the Pt-based alloys remain most active for ORR, their wide applications have been limited by the scarcity and high cost of Pt. Thus it is essential to develop new ORR catalysts with low cost, such as Pd-based alloy nanostructures.33 Very recently, Goodenough et al. reported a chemically ordered sc FePd3 NPs showing excellent catalytic performance towards the ORR under alkaline conditions.33 It was found that the ordered sc FePd3 NPs show an ORR onset potential of 30–50 mV higher than that of the disordered fcc FePd3 NPs and commercial Pd/C. Meanwhile, the mass activity of ordered sc FePd3 NPs is as large as 97.4 mA mgPd−1 at 0.9 V, which is 1.5 and 2.1 times of that for the disordered fcc FePd3 NPs and commercial Pd/C, respectively. It was proposed that the improved catalytic performance of ordered sc FePd3 NPs may arise from the change of the Pd–Pd bond length and electron configuration.33 Most importantly, the half-wave potential of ordered sc FePd3 NPs is 10 mV more positive than that of the commercial Pt/C. Moreover, the mass activity of the ordered sc FePd3 NPs reaches up to 1.3 times of that for the commercial Pt/C. All these observations suggest that the Pd-based alloy ORR catalysts hold great promise to replace the expensive Pt-based alloy nanostructures for ORR.
5.2. Oxidation reactions of formic acid and methanol
Corresponding to the aforementioned ORR, the catalytic oxidation of various fuels, such as formic acid, alcohols and hydrogen, is an important anodic reaction in the proton exchange membrane fuel cells. Although noble metal nanomaterials, such as the Pt-based alloy nanostructures, have also been frequently employed for the catalytic oxidation of fuels, they usually suffer from low stability under harsh electrochemical conditions and deactivation by intermediate reaction products, such as CO molecules in the formic acid and alcohol oxidation reactions.21 Very recently, Sun et al. demonstrated that both the catalytic activity and durability of Pt-based alloy nanostructures for the fuel oxidation reaction can be simultaneously improved via the combination of rational composition and structure designs.21 It was found that the catalytic performance and durability of FePtAu NPs for formic acid oxidation reaction (FAOR) under acidic conditions can be significantly improved by gradually changing their crystal phase from the chemically disordered fcc to chemically ordered fct structures (Fig. 15a and b). It was observed that the mass activity of the ordered fct FePtAu NPs for FAOR reaches up to 2809.9 mA mgPt−1, and 92.5% of their mass activity can be preserved even after 13 h of the current density–time (i–t) test. It was proposed that the enhanced stability of fct FePtAu NPs most probably arises from the simultaneous formation of the ordered fct structure and the doping and segregation of Au atoms.21 Note that the commercial Pt, fct FePt and fcc FePtAu NPs are all prone to CO poisoning and acid dissolution without the introduction of Au or the formation of the chemically ordered fct structure.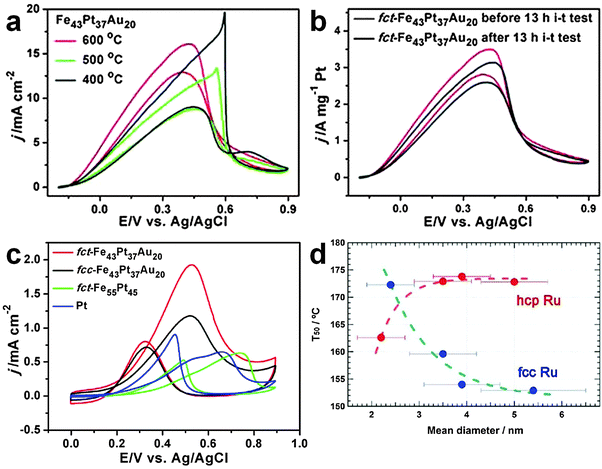 | ||
| Fig. 15 (a) Current density–potential (J–V) plots of Fe43Pt37Au20 NPs annealed at different temperatures towards the FAOR. (b) J–V plots of ordered fct Fe43Pt37Au20 NPs before and after a 13 h i–t stability test for FAOR. (c) J–V plots of the ordered fct Fe43Pt37Au20, disordered fcc Fe43Pt37Au20, ordered fct Fe55Pt45 and commercial Pt NPs towards the MOR. Reproduced with permission from ref. 21. Copyright 2012, American Chemical Society. (d) The size-dependent temperature for 50% conversion of CO to CO2 for the fcc and hcp Ru NPs. Reproduced with permission from ref. 16. Copyright 2013, American Chemical Society. | ||
In addition to the aforementioned FAOR, the crystal structure-dependent catalytic activity of FePtAu NPs has also been found in the methanol oxidation reaction (MOR).21 As expected, the chemically ordered fct FePtAu NPs showed the strongest CO-tolerance activity towards MOR compared to the commercial Pt, ordered fct FePt, and disordered fcc FePtAu NPs (Fig. 15c). It was calculated that the ratio of forward peak current to backward peak current, which is commonly used to evaluate the catalyst tolerance towards poisoning species (e.g. CO molecules), for the ordered fct FePtAu NPs is as high as 2.8, while for the disordered fcc FePtAu NPs, ordered fct FePt and commercial Pt, it is 1.62, 1.20 and 0.71, respectively.
5.3. Carbon monoxide oxidation
The CO oxidation has long been a benchmark reaction, which is of critical importance in many practical applications, such as removal of CO from the automobile exhaust gases and purification of reformate hydrogen via the selective oxidation of CO.47 Among many kinds of noble metal nanostructures, Ru nanomaterials have received extensive research interest due to their high catalytic activity towards the CO oxidation.16,47 Previous studies have mainly focused on the size effect of Ru nanomaterials on CO oxidation.47 However, the effect of crystal structure of Ru nanomaterials on the CO oxidation remains unclear. Until recently, it has been reported that the crystal structure of Ru NPs can significantly affect their catalytic performance towards the CO oxidation.16 It was observed that the catalytic activity of Ru NPs towards the CO oxidation increases with the particle size of the uncommon fcc phase, while their catalytic activity decreases with the particle size of the common hcp phase (Fig. 15d). Importantly, when the particle size is below 3 nm, hcp Ru NPs are more catalytically active towards the CO oxidation than the fcc Ru NPs. However, when the size is above 3 nm, hcp Ru NPs show a much lower catalytic activity compared to the fcc Ru NPs.6. Conclusions and perspectives
In summary, we have briefly introduced different kinds of methods for the crystal phase-controlled synthesis of noble metal nanomaterials. Importantly, recent studies have indicated that the crystal phase of noble metal nanomaterials can greatly affect their chemical and physical properties, such as chemical stability, and magnetic, electrical and optical properties. Moreover, the catalytic performance of noble metal nanomaterials in different applications, such as ORR, FAOR, MOR and CO oxidation, can be significantly enhanced by the rational crystal phase design. Therefore, besides the size, shape, composition and architecture manipulations, the crystal phase control has risen up to be a new and promising strategy to further boost the functional properties of noble metal nanomaterials.Although many encouraging results have been well achieved by the crystal phase-controlled synthesis of noble metal nanomaterials, there are still some challenges in this field which need to be overcome. For instance, the crystal structure-tuning of Pd and Pt nanocrystals remains to be quite difficult. To date, almost all the reported Pd and Pt nanocrystals obtained by wet-chemical synthesis adopt the common fcc structure. As known, these two noble metals, i.e. Pd and Pt, demonstrate unique and intriguing catalytic properties. Thus the rational structure control of Pd and Pt nanocrystals is of high importance and could further improve their catalytic performance. Meanwhile, despite the surface modification strategies, i.e. ligand exchange and metal coating, have offered a facile and versatile method to modulate the crystal structures of ultrathin anisotropic noble metal nanomaterials under ambient conditions, the underlying mechanism is still not very clear so far. It is believed that a better understanding of the surface modification-induced phase transition mechanism would allow for the preparation of complex nanostructures and a wide range of new nanomaterials. Last but not the least, the production yield of some obtained noble metal nanomaterials with metastable phases is still low, which always coexist with the common structured noble metal nanomaterials. Note that both of the production yield and purity of metastable structured noble metal nanomaterials are critically essential to their various potential applications.
It is worth pointing out that the current research on the crystal phase control of noble metal nanomaterials still remains primitive. Many opportunities are lying ahead. First of all, new crystal phases of noble metals are highly expected to be discovered by rationally tuning the experimental conditions of colloidal synthesis, such as temperature, pressure, solvent, and capping agents and metal precursors, and their concentrations. Take Au as a typical example, different polytypes of Au nanomaterials have been synthesized by systematically adjusting the solvent in the colloidal synthesis. It was demonstrated that fcc Au NPs, 2H AuSSs and 4H Au NRBs can be obtained by using hexane, hexane/ethanol and hexane/1,2-dichloropropane as the solvent, respectively.11,12 These polytypes of Au differ from each other regarding to the characteristic stacking sequence along the close-packed directions, i.e. “ABC” along [111]f for the fcc phase, “AB” along [001]2H for the 2H phase, and “ABCB” along [001]4H for the 4H phase. Based on the aforementioned discussion, it is anticipated that Au nanomaterials with an unprecedented crystal structure of 6H, which has a typical stacking sequence of “ABCACB” along the close-packed direction of [001]6H, could be synthesized by rationally controlling the solvent in the growth solution and possibly other experimental conditions as well. Meanwhile, the novel 4H hexagonal structure of other metals could also be obtained via their epitaxial growth on the 4H Au NRBs.12
Another future direction lies in the fabrication of crystal phase heterostructures of noble metal nanomaterials. It is widely known that different crystal structures of semiconductor nanomaterials have different band gaps. Importantly, the direct contact of two different crystal phases of semiconductors leads to the formation of type-II band alignment,48 which can greatly improve the efficiency of charge separation and thus benefit their various applications, such as solar energy conversion. As for the noble metal nanomaterials, it has been found that different crystal phases of noble metals demonstrate different electronic band structures, which determine the physical properties (e.g. optical, magnetic and transport properties) and catalytic activities of noble metals.13,23 Therefore, it is highly predicted that the crystal phase heterostructures of noble metal nanomaterials may exhibit significantly enhanced catalytic performance and even new physical properties via the formation of phase junctions, in which the electronic band structures of two different crystal phases of the same metal are hybridized.
Moreover, the synthesis of noble metal alloy nanomaterials with new crystal structures by colloidal methods still remains under development. Although the high temperature method has been shown as an efficient approach to synthesize non-fcc noble metal alloy nanostructures, it involves multiple steps and harsh experimental conditions including the use of extremely high temperatures (usually > 500 °C).2,4,5,17 Note that the wet-chemical colloidal synthesis has the advantages of low cost and large scale. Hence it is quite important and urgent to establish colloidal strategies to achieve the crystal phase-controlled synthesis of various noble metal alloy nanomaterials. Meanwhile, as the mesoporous architecture holds advantages of large accessible surface area and high structure stability,49,50 ordered mesoporous noble metal alloy nanomaterials with a new crystal phase could be synthesized, which might exhibit superior catalytic properties. In addition, towards the real applications, the synthesis of noble metal alloy nanomaterials consisting of noble metals and other transition metals is highly required since it can reduce the usage of noble metals and thus effectively cut down the overall cost.
Acknowledgements
This work was supported by MOE under AcRF Tier 2 (ARC 26/13, No. MOE2013-T2-1-034; ARC 19/15, No. MOE2014-T2-2-093) and AcRF Tier 1 (RGT18/13, RG5/13), and NTU under Start-Up Grant (M4081296.070.500000) in Singapore. This research is also conducted by NTU-HUJ-BGU Nanomaterials for Energy and Water Management Programme under the Campus for Research Excellence and Technological Enterprise (CREATE), that is supported by the National Research Foundation, Prime Minister’s Office, Singapore.References
- Y. Xia, Y. Xiong, B. Lim and S. E. Skrabalak, Angew. Chem., Int. Ed., 2009, 48, 60–103 CrossRef CAS PubMed.
- D. Wang, H. L. Xin, R. Hovden, H. Wang, Y. Yu, D. A. Muller, F. J. DiSalvo and H. D. Abruña, Nat. Mater., 2013, 12, 81–87 CrossRef CAS PubMed.
- S. Zhang, X. Zhang, G. Jiang, H. Zhu, S. Guo, D. Su, G. Lu and S. Sun, J. Am. Chem. Soc., 2014, 136, 7734–7739 CrossRef CAS PubMed.
- J. Kim, Y. Lee and S. Sun, J. Am. Chem. Soc., 2010, 132, 4996–4997 CrossRef CAS PubMed.
- Q. Li, L. Wu, G. Wu, D. Su, H. Lv, S. Zhang, W. Zhu, A. Casimir, H. Zhu, A. Mendoza-Garcia and S. Sun, Nano Lett., 2015, 15, 2468–2473 CrossRef CAS PubMed.
- L. Wang, C. Hu, Y. Nemoto, Y. Tateyama and Y. Yamauchi, Cryst. Growth Des., 2010, 10, 3454–3460 CAS.
- L. Wang and Y. Yamauchi, J. Am. Chem. Soc., 2010, 132, 13636–13638 CrossRef CAS PubMed.
- C. Li and Y. Yamauchi, Phys. Chem. Chem. Phys., 2013, 15, 3490–3496 RSC.
- X. Liu, J. Luo and J. Zhu, Nano Lett., 2006, 6, 408–412 CrossRef CAS PubMed.
- Y. Kondo and K. Takayanagi, Phys. Rev. Lett., 1997, 79, 3455–3458 CrossRef CAS.
- X. Huang, S. Li, Y. Huang, S. Wu, X. Zhou, C. L. Gan, F. Boey, C. A. Mirkin and H. Zhang, Nat. Commun., 2011, 2, 292 CrossRef PubMed.
- Z. Fan, M. Bosman, X. Huang, D. Huang, Y. Yu, K. P. Ong, Y. A. Akimov, L. Wu, B. Li, J. Wu, Y. Huang, Q. Liu, C. E. Png, C. L. Gan, P. Yang and H. Zhang, Nat. Commun., 2015, 6, 7684 CrossRef CAS PubMed.
- I. Chakraborty, D. Carvalho, N. S. Shirodkar, S. Lahiri, S. Bhattacharyya, R. Banerjee, U. Waghmare and P. Ayyub, J. Phys.: Condens. Matter, 2011, 23, 325401 CrossRef PubMed.
- Y. Sun, Y. Ren, Y. Liu, J. Wen, J. S. Okasinski and D. J. Miller, Nat. Commun., 2012, 3, 971 CrossRef PubMed.
- H. Duan, N. Yan, R. Yu, C.-R. Chang, G. Zhou, H.-S. Hu, H. Rong, Z. Niu, J. Mao, H. Asakura, T. Tanaka, P. J. Dyson, J. Li and Y. Li, Nat. Commun., 2014, 5, 3093 Search PubMed.
- K. Kusada, H. Kobayashi, T. Yamamoto, S. Matsumura, N. Sumi, K. Sato, K. Nagaoka, Y. Kubota and H. Kitagawa, J. Am. Chem. Soc., 2013, 135, 5493–5496 CrossRef CAS PubMed.
- S. Sun, C. B. Murray, D. Weller, L. Folks and A. Moser, Science, 2000, 287, 1989–1992 CrossRef CAS PubMed.
- Q. Guo, Y. Zhao, W. L. Mao, Z. Wang, Y. Xiong and Y. Xia, Nano Lett., 2008, 8, 972–975 CrossRef CAS PubMed.
- Z. Fan, Y. Zhu, X. Huang, Y. Han, Q. Wang, Q. Liu, Y. Huang, C. L. Gan and H. Zhang, Angew. Chem., Int. Ed., 2015, 54, 5672–5676 CrossRef CAS PubMed.
- Z. Fan, X. Huang, Y. Han, M. Bosman, Q. Wang, Y. Zhu, Q. Liu, B. Li, Z. Zeng, J. Wu, W. Shi, S. Li, C. L. Gan and H. Zhang, Nat. Commun., 2015, 6, 6571 CrossRef CAS PubMed.
- S. Zhang, S. Guo, H. Zhu, D. Su and S. Sun, J. Am. Chem. Soc., 2012, 134, 5060–5063 CrossRef CAS PubMed.
- A. Singh, T. P. Sai and A. Ghosh, Appl. Phys. Lett., 2008, 93, 102107 CrossRef.
- I. Chakraborty, N. S. Shirodkar, S. Gohil, V. U. Waghmare and P. Ayyub, J. Phys.: Condens. Matter, 2014, 26, 025402 CrossRef PubMed.
- Q. Guo, Y. Zhao, Z. Wang, S. E. Skrabalak, Z. Lin and Y. Xia, J. Phys. Chem. C, 2008, 112, 20135–20137 CAS.
- X. Huang, S. Li, S. Wu, Y. Huang, F. Boey, C. L. Gan and H. Zhang, Adv. Mater., 2012, 24, 979–983 CrossRef CAS PubMed.
- S. Yang, Z. Peng and H. Yang, Adv. Funct. Mater., 2008, 18, 2745–2753 CrossRef CAS.
- D. Alloyeau, C. Ricolleau, C. Mottet, T. Oikawa, C. Langlois, Y. Le Bouar, N. Braidy and A. Loiseau, Nat. Mater., 2009, 8, 940–946 CrossRef CAS PubMed.
- Y. Sun, W. Yang, Y. Ren, L. Wang and C. Lei, Small, 2011, 7, 606–611 CrossRef CAS PubMed.
- Z. R. Dai, S. Sun and Z. L. Wang, Nano Lett., 2001, 1, 443–447 CrossRef CAS.
- J. Kim, C. Rong, J. P. Liu and S. Sun, Adv. Mater., 2009, 21, 906–909 CrossRef CAS.
- J. Kim, C. Rong, Y. Lee, J. P. Liu and S. Sun, Chem. Mater., 2008, 20, 7242–7245 CrossRef CAS.
- H. M. Chen, C. F. Hsin, P. Y. Chen, R.-S. Liu, S.-F. Hu, C.-Y. Huang, J.-F. Lee and L.-Y. Jang, J. Am. Chem. Soc., 2009, 131, 15794–15801 CrossRef CAS PubMed.
- Z. Cui, L. Li, A. Manthiram and J. B. Goodenough, J. Am. Chem. Soc., 2015, 137, 7278–7281 CrossRef CAS PubMed.
- D. Wang, Y. Yu, H. L. Xin, R. Hovden, P. Ercius, J. A. Mundy, H. Chen, J. H. Richard, D. A. Muller, F. J. DiSalvo and H. D. Abruña, Nano Lett., 2012, 12, 5230–5238 CrossRef CAS PubMed.
- P. Mukherjee, P. Manchanda, P. Kumar, L. Zhou, M. J. Kramer, A. Kashyap, R. Skomski, D. Sellmyer and J. E. Shield, ACS Nano, 2014, 8, 8113–8120 CrossRef CAS PubMed.
- K. J. Koski, N. M. Kamp, R. K. Smith, M. Kunz, J. K. Knight and A. P. Alivisatos, Phys. Rev. B: Condens. Matter Mater. Phys., 2008, 78, 165410 CrossRef.
- J. Luo, L. Zhang, Y. Zhang and J. Zhu, Adv. Mater., 2002, 14, 1413–1414 CrossRef CAS.
- X. Huang, H. Li, S. Li, S. Wu, F. Boey, J. Ma and H. Zhang, Angew. Chem., Int. Ed., 2011, 50, 12245–12248 CrossRef CAS PubMed.
- Y. Wang, H.-C. Peng, J. Liu, C. Z. Huang and Y. Xia, Nano Lett., 2015, 15, 1445–1450 CrossRef CAS PubMed.
- X. Huang, S. Tang, X. Mu, Y. Dai, G. Chen, Z. Zhou, F. Ruan, Z. Yang and N. Zheng, Nat. Nanotechnol., 2011, 6, 28–32 CrossRef CAS PubMed.
- H. Liao, J. Zhu and Y. Hou, Nanoscale, 2014, 6, 1049–1055 RSC.
- K. M. Nam, J. H. Shim, D.-W. Han, H. S. Kwon, Y.-M. Kang, Y. Li, H. Song, W. S. Seo and J. T. Park, Chem. Mater., 2010, 22, 4446–4454 CrossRef CAS.
- S. Titmuss, A. Wander and D. A. King, Chem. Rev., 1996, 96, 1291–1306 CrossRef CAS PubMed.
- P. J. F. Harris, Nature, 1986, 323, 792–794 CrossRef CAS.
- X. Liu, J. Zhu, C. Jin, L.-M. Peng, D. Tang and H. Cheng, Nanotechnology, 2008, 19, 085711 CrossRef PubMed.
- D. Wang and Y. Li, Adv. Mater., 2011, 23, 1044–1060 CrossRef CAS PubMed.
- S. H. Joo, J. Y. Park, J. R. Renzas, D. R. Butcher, W. Huang and G. A. Somorjai, Nano Lett., 2010, 10, 2709–2713 CrossRef CAS PubMed.
- D. O. Scanlon, C. W. Dunnill, J. Buckeridge, S. A. Shevlin, A. J. Logsdail, S. M. Woodley, C. R. A. Catlow, M. J. Powell, R. G. Palgrave, I. P. Parkin, G. W. Watson, T. W. Keal, P. Sherwood, A. Walsh and A. A. Sokol, Nat. Mater., 2013, 12, 798–801 CrossRef CAS PubMed.
- Y. Li, B. P. Bastakoti, V. Malgras, C. Li, J. Tang, J. H. Kim and Y. Yamauchi, Angew. Chem., Int. Ed., 2015, 54, 11073–11077 CrossRef CAS PubMed.
- C. Li, B. Jiang, N. Miyamoto, J. H. Kim, V. Malgras and Y. Yamauchi, J. Am. Chem. Soc., 2015, 137, 11558–11561 CrossRef CAS PubMed.
| This journal is © The Royal Society of Chemistry 2016 |


