 Open Access Article
Creative Commons Attribution 3.0 Unported Licence
Vibrational ladder-climbing in surface-enhanced, ultrafast infrared spectroscopy
Jan Philip
Kraack
* and
Peter
Hamm
*
Department of Chemistry, University of Zürich, Winterthurerstrasse 190, CH-8057, Zürich, Switzerland. E-mail: philip.kraack@chem.uzh.ch; peter.hamm@chem.uzh.ch; Fax: +41 44 63 568 38; Tel: +41 44 63 544 77 Tel: +41 44 63 544 31
First published on 31st May 2016
Abstract
In a recent work (J. Phys. Chem. C 2016, 120, 3350–3359), we have introduced the concept of surface-enhanced, two-dimensional attenuated total reflectance (2D ATR IR) spectroscopy with modest enhancement factors (<50) using small plasmonic noble metal nanoparticles at solid–liquid interfaces. Here, we show that employment of almost continuous noble metal layers results in significantly stronger enhancement factors in 2D ATR IR signals (>450), which allows for multi-quantum IR excitation of adsorbed molecules, a process known as “vibrational ladder-climbing”, even for weakly absorbing (ε < 200 M−1 cm−1) nitrile IR labels. We show that it is possible to deposit up to four quanta of vibrational energy in the respective functional group. Based on these results, optical near-fields of plasmonic nanostructures may pave the way for future investigations involving ultrafast dynamics of highly excited vibrational states or surface-sensitive coherent control experiments of ground-state reactions at solid–liquid interfaces.
Surface-enhanced infrared absorption (SEIRA) spectroscopy has emerged as a powerful tool for obtaining the vibrational spectra of molecules at interfaces.1–5 Starting from initial reports,6,7 increasingly sophisticated approaches have pushed the sensitivity of SEIRA to a very low surface-coverage of adsorbates. Most SEIRA approaches are based on the application of plasmonic near-fields for the enhancement of weak IR responses. To obtain surface-enhancement, initial SEIRA reports used thin noble and coinage metal layers (a few nanometers to tens of nanometers in thickness), which consisted of differently sized nanoparticle aggregates.3,6–8 Many recent SEIRA reports, however, use specifically designed nanostructured materials such as nanoantennas,2 nanoslits1 or nanotips,9 which allow for very high (>105) enhancement factors.10,11 The strong progress in SEIRA has recently triggered interest to also exploit this effect using ultrafast spectroscopy.9,12–14
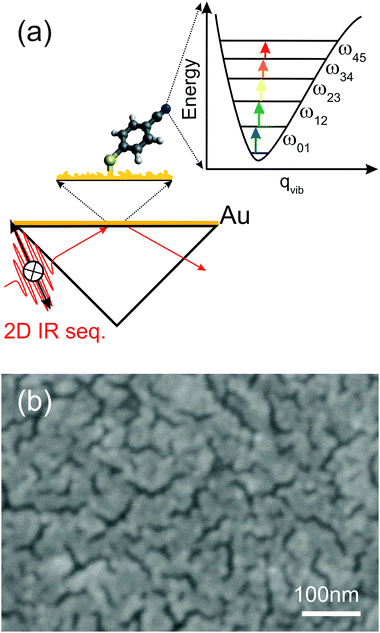
The largest number of ultrafast IR techniques existing today15,16 (e.g., two-pulse pump–probe, three-pulse transient grating, and many variants thereof) are based on the third-order nonlinear susceptibility (χ(3)), where an initial excitation of the 0–1 vibrational transition takes place through two light–matter interactions. Depending on the strength of the electric field in the sample, however, molecules can also interact more than two times with the excitation field, resulting in higher-order signals (χ(5), χ(7),…). In laser-based IR spectroscopy, this process is termed “vibrational ladder-climbing” (Fig. 1(a)).17–34 Significant interest has been attributed to ladder-climbing even at the very early stages of time-resolved IR spectroscopy, since the process makes an energetically large range of vibrational levels of the electronic ground state potential accessible. Furthermore, ladder-climbing has allowed selectively surmounting of ground state potential energy barriers and steering chemical reactions.18,19
The strong increase in optical near fields around metal nanostructures under illumination makes ladder-climbing likely as a signal contribution in surface-enhanced, ultrafast IR spectroscopy; however, the effect has not been observed so far experimentally. Here, we demonstrate that ladder-climbing can indeed be observed in surface-enhanced 2D ATR IR spectroscopy13,35–38 even for weakly absorbing samples (ε(CN) ≈ 170 M−1 cm−1), i.e., for the nitrile stretching vibrations of a monolayer of para-mercapto-benzonitrile (p-PhCN) on an ultrathin gold layer.
The principles of 2D ATR IR spectroscopy in pump–probe geometry (Fig. 1(a)), as well as the methods to sputter-coat the CaF2 ATR prisms, have been introduced and discussed in detail before.13,35–38 Extending our previous work,13 we start by determining enhancement factors for significantly thicker Au layers up to 4 nm. To that end, we apply exactly the same procedure as outlined in detail in ref. 13: in brief, we first calculate the ratio between the (enhanced) 2D ATR IR signal magnitude from a p-PhCN monolayer and its in situ measured linear ATR absorbance (i.e., we calculate the “2D ATR IR signal per ATR IR absorbance”). Secondly, we compare the results to a similarly determined value of (non-enhanced) 2D ATR IR signal per ATR IR absorbance of a reference sample in bulk solution. The ratio of the two values yields the signal enhancement factor.13 This procedure avoids having to determine the exact surface coverage of the monolayer. Since we used thicker Au layers in the present study as compared to ref. 13, we had to reduce the pump intensity in the 2D ATR IR (∼150 nJ) in order to avoid light-induced damage of the metal layers, which otherwise occurs for thicknesses near the percolation threshold, i.e., when long-range connected Au structures are formed (Fig. 1(b)).
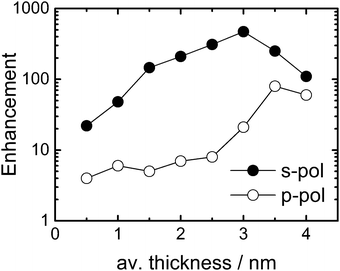
Fig. 2 shows the enhancement factor of a p-PhCN monolayer depending on the average Au layer thickness for s-polarized (s-pol., solid black) and p-polarized (p-pol., open black) pump- and probe beams in the 2D ATR IR experiment (see Fig. 1 for a definition of the polarization directions). As a general observation, the enhancement factors are larger for s-pol. as compared to p-pol., in agreement with previous observations.13,39 However, the very different evolution of enhancement factors with metal layer thickness indicates distinctively different enhancement mechanisms for the two polarization conditions.6,39,40 That is, while the enhancement factor remains small (<10) for p-pol. below 3 nm Au thickness and then increases relatively abruptly, the enhancement factor for s-pol. increases more steadily over the whole range before it reaches a maximum of 470 at 3 nm Au. Further growth of the metal layer thickness results in the reduction of the enhancement factors for both polarization directions due to the increasing intrinsic absorption of the pump beam.
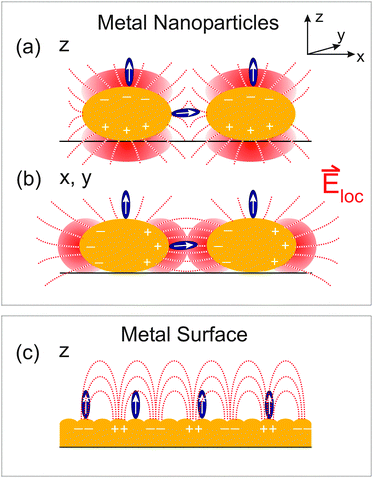
The different enhancement mechanisms can be explained as follows. ATR signals acquired with s-pol. exploit near-fields in the voids between Au nanoparticles or patches by polarizing the particles in the prism surface plane, as explained in detail in ref. 13 and 39. In these voids, the near fields of the highest intensity of different nanoparticles cooperatively generate “hot-spots” of increased intensity (Fig. 3(b)).13,39 Therefore, s-pol. measures signals predominantly from molecules adsorbed in the voids between the Au patches (Fig. 3(a)). In contrast, signals acquired with p-pol. can only ineffectively polarize the nanoparticles in the prism surface plane due to a predominant polarization component of the evanescent wave in the direction of the normal to the prism surface.13,41 However, once the Au layer becomes thicker than the percolation threshold, which is the case at a thickness of 3.5 nm (see Fig. 1(b)), it becomes macroscopically conducting, and surface-plasmon polaritons are excited (Fig. 3(c)), which is then responsible for the signal enhancement of molecules on top of the Au layer.13,39,42,43 For a perfect surface (i.e. a single crystalline structure of Au), s-pol. light cannot excite surface plasmon polaritons and in fact not excite molecules at all. Note, however, that even for the almost continuous Au layers employed here (Fig. 1(b)), our surfaces are far from such an ideal case, which still allows the polarization of nanoparticle structures by the incident fields in the prism plane.
In addition to the electromagnetic enhancement discussed above, the orientation of functional groups with respect to the surface also plays an important role in SEIRA on a polarizable metal surface. This is because transition dipole components parallel to the surface are diminished by adsorbate-induced mirror-dipoles in the substrate (the “surface-selection rule”).3,13,44,45 Thus, only transition dipole components along the local surface normal are enhanced, i.e. the normal of the nanoparticles (Fig. 3). For the rough surface structures employed here, we in fact expect a broad distribution of orientations of the functional groups with respect to the prism surface plane. Due to the different enhancements that molecules for instance on top of the nanoparticles and in the voids experience, the determination of the average orientation is currently not possible with 2D ATR IR.
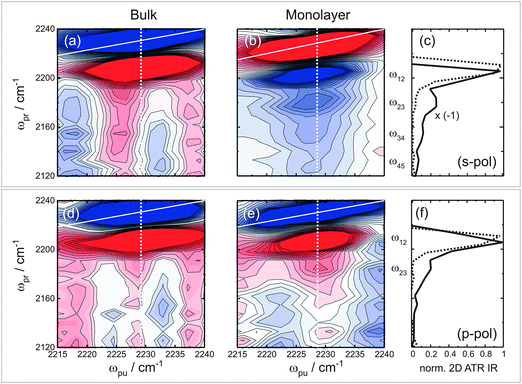
Next we turn to the observation of vibrational ladder-climbing in strongly enhanced 2D ATR IR signals. Fig. 4 shows the polarization-resolved 2D ATR IR signals of p-PhCN dissolved in bulk methanol ((a) and (d)) along with signals from the monolayer sample ((b) and (e)) on 3.5 nm thin Au layers for a population time T = 0.3 ps, acquired under the same conditions apart from the applied polarization (s-pol./p-pol.). The monolayer signals have been obtained after subtraction of a background, which stems from the bare metal layer.35,38 Note that the 2D ATR IR signal is inverted with respect to the bulk solution sample for s-pol. light. This inversion is due to well-known lineshape distortions originating from the metal layers, which have been purposely tuned here to result in complete anti-resonances for s-pol. by choosing a layer thickness of 3.5 nm and an appropriate angle of incidence. By coincidence, one retains absorptive resonances for p-pol. for the same layer thickness.35,39
In any case, strong ground state bleach/stimulated emission (GSB/ESE) signals are observed along the diagonal (solid white lines in (a)/(d) and (b)/(e)) together with spectrally red-shifted excited state absorption (ESA) signals, the latter of which appear differently in shape for the bulk solution versus monolayer samples. That is, the bulk solution reference data exhibit a single peak corresponding to the 1–2 transition ((a)/(d)), independent of polarization, whereas for the monolayer data the ESA signals exhibit multiple peaks. For a better visualization of the multiple ESA bands, Fig. 4(c) and (f) show cuts along the ωpr-axis at a pump-frequency of 2228 cm−1, which corresponds to the maximum ATR absorption. For monolayer signals acquired with s-pol., four distinct peaks spaced equally by ca. 23 cm−1 and with decreasing signal magnitude for decreasing ωpr-positions can clearly be discerned, corresponding to the 1–2, 2–3, 3–4, and 4–5 transitions. For p-pol. signals (Fig. 4(f)), multiple ESA signals are observed as well, however, only the 1–2, and 2–3 transitions are resolved. The spacing of the signals stems from the anharmonicity of the CN stretching potential. The multiple peaks are a signature of vibrational ladder-climbing (Fig. 1(a)), since the energy spacing of adjacent vibrational levels decreases linearly with the increasing quantum number in the slightly anharmonic potential of the CN stretching mode.
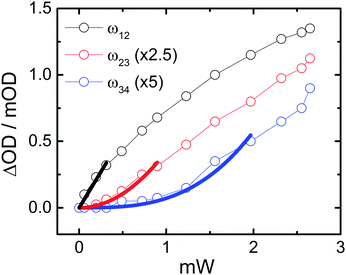
The origin of ladder-climbing for these peaks has been confirmed by their disappearance at reduced pump power. Fig. 5 shows ML signal magnitudes obtained from a pump–probe experiment for the 1–2 (black), 2–3 (red) and 3–4 (blue) ESA transitions as a function of the applied pump power with s-pol. light. Thick solid lines correspond to linear (black), quadratic (red) and cubic (blue) fits to the data over a limited power range. Fitting over a limited range of data is necessary since the multiple excited states are subjected to saturation in their corresponding populations with increasing power. Nevertheless, over the considered ranges the signals can be well explained by one-, two- and three-photon absorption pathways, respectively, as expected from vibrational ladder-climbing.
The observation of vibrational ladder-climbing in surface-enhanced, ultrafast spectroscopy even for weakly absorbing IR labels (here: the CN stretching vibration, ε ∼ 170 M−1 cm−1) can be viewed from two perspectives. On the one hand, the excitation of higher-lying vibrational states results in additional signal contributions (Fig. 4) compared to the pure third-order response. However, the χ(3) response is often the wanted signal and higher order contributions make the sought signals more complicated to interpret. This holds especially for time-resolved data, for which the population of multiple excited vibrational levels may result in multi-exponential relaxation dynamics.26,46 One also needs to keep in mind that very popular IR labels in ultrafast spectroscopy exhibit strong absorption coefficients (ε > 1000 M−1 cm−1),47,48e.g. carbonyl or nitrile stretching vibrations from transition metal complexes.49,50 Molecules containing such carbonyl bands have recently gained considerable attention in IR surface spectroscopy51–53 due to their performance as catalysts.54 Application of these IR labels in surface-enhanced spectroscopy will make ladder-climbing a more likely contribution, thus potentially limiting their use in combination with plasmonic substrates for immobilization.
On the other hand, ladder-climbing can also be regarded as a very useful effect, which allows for many interesting applications. For instance, one may spectroscopically characterize energy regions of the electronic ground state potential, which are difficult to access via direct IR excitation. It will therefore be interesting to see in future studies how higher-lying vibrational states are involved in intra- as well as inter-molecular excitation energy transfer within, e.g. a closely packed monolayer or between a monolayer and the surrounding solvent. Moreover, ladder-climbing has triggered interest in controlling chemical reactions directly in the electronic ground state by mid-IR pulse shaping.18,19 The strong optical near-fields around plasmonic nanostructures can thus be envisioned as useful control parameters for laser-induced chemical reactions to reach energy regions close to transition states on a multi-dimensional potential energy surface. Using the high optical near field intensity, coherent control might be applicable for a much broader range of samples as reported before, not limited to very strong IR absorbers.18,19 This can be particularly interesting regarding substrates for which much higher enhancement factors can be expected, for instance nanoantennas12 or nanotips9 in ultrafast IR spectroscopy, which might hence be ideal candidates for coherent control at solid–liquid interfaces.
In conclusion, we have demonstrated vibrational ladder-climbing in organic monolayers with weakly absorbing IR labels, studied using surface-enhanced, ultrafast 2D ATR IR spectroscopy. Using ultrathin (3.5 nm thickness), almost continuous gold layers on an ATR crystal, we observe polarization-dependent ladder-climbing signals up to the v = 4 level of the CN stretching vibration of p-PhCN. The highest surface-enhancement and therefore the strongest signatures of ladder-climbing (up to the 4–5 transition) are observed for s-polarization, exploiting the excitation of hot-spots in the voids between patches of the gold layer. Weaker ladder-climbing contributions (up to the 2–3 transition) are observed for p-polarization, exploiting the excitation of surface plasmon polaritons in the ultrathin metal film. The presented results pave the way for a broad range of future investigations regarding the combination of nanostructured surfaces and femtosecond IR spectroscopy, for instance comprising ultrafast dynamics of highly excited vibrational levels, energy transfer or surface coherent control.
Acknowledgements
This research was funded by the Swiss National Science Foundation through grant number CRSII2_160801/1 and by the URRP LightChEC of the University of Zürich. Experimental support by the Center of Microscopy and Imaging at the University of Zürich (ZMB) with regard to the preparation and characterization of the metal layers is gratefully acknowledged.References
- C. Huck, F. Neubrech, J. Vogt, A. Toma, D. Gerbert and J. Katzmann, ACS Nano, 2014, 8, 4908–4914 CrossRef CAS PubMed.
- F. Neubrech and A. Pucci, IEEE J. Sel. Top. Quantum Electron., 2013, 19, 4600809 CrossRef.
- M. Osawa, in Near-Field Optics and Surface Plasmon Polaritons, ed. S. Kawata, Springer-Verlag Berlin Heidelberg, 2001, vol. 81, pp. 163–187 Search PubMed.
- M. Osawa and M. Ikeda, J. Phys. Chem., 1991, 95, 9914–9919 CrossRef CAS.
- R. Aroca, Surface-Enhanced Vibrational Spectroscopy, John Wiley & Sons, Ltd, Chichester, UK, 2006 Search PubMed.
- A. Hatta, Y. Suzuki and W. Suëtaka, Appl. Phys. A: Solids Surf., 1984, 35, 135–140 CrossRef.
- A. Hartstein, J. R. Kirtley and J. C. Tsang, Phys. Rev. Lett., 1980, 45, 201–204 CrossRef CAS.
- M. Osawa, M. Kuramitsu, A. Hatta and W. Suetaka, Surf. Sci. Lett., 1986, 175, L787–L793 CrossRef CAS.
- E. A. Muller, B. Pollard and M. B. Raschke, J. Phys. Chem. Lett., 2015, 6, 1275–1284 CrossRef CAS PubMed.
- R. Adato and H. Altug, Nat. Commun., 2013, 4, 2154 Search PubMed.
- C. Wu, A. B. Khanikaev, R. Adato, N. Arju, A. A. Yanik, H. Altug and G. Shvets, Nat. Mater., 2012, 11, 69–75 CrossRef CAS PubMed.
- O. Selig, R. Siffels and Y. L. A. Rezus, Phys. Rev. Lett., 2015, 114, 233004 CrossRef CAS PubMed.
- J. P. Kraack, A. Kaech and P. Hamm, J. Phys. Chem. C, 2016, 120, 3350–3359 CAS.
- P. M. Donaldson and P. Hamm, Angew. Chem., Int. Ed., 2013, 125, 662–666 CrossRef.
- S. Mukamel, Nonlinear optical Spectroscopy, Oxford University Press, 1995 Search PubMed.
- P. Hamm and M. Zanni, Concepts and methods of 2D infrared spectroscopy, Cambridge University Press, 2011 Search PubMed.
- S. M. Arrivo, T. P. Dougherty, W. T. Grubbs and E. J. Heilweil, Chem. Phys. Lett., 1995, 235, 247–254 CrossRef CAS.
- T. Witte, T. Hornung, L. Windhorn, D. Proch, R. De Vivie-Riedle, M. Motzkus and K. L. Kompa, J. Chem. Phys., 2003, 118, 2021–2024 CrossRef CAS.
- L. Windhorn, T. Witte, J. S. Yeston, D. Proch, M. Motzkus, K. L. Kompa and W. Fuß, Chem. Phys. Lett., 2002, 357, 85–90 CrossRef CAS.
- C. Falvo, A. Debnath and C. Meier, J. Chem. Phys., 2013, 138, 145101 CrossRef PubMed.
- A. Debnath, C. Falvo and C. Meier, J. Phys. Chem. A, 2013, 117, 12884–12888 CrossRef CAS PubMed.
- T. Witte, J. S. Yeston, M. Motzkus, E. J. Heilweil and K. L. Kompa, Chem. Phys. Lett., 2004, 392, 156–161 CrossRef CAS.
- D. Maas, D. Duncan, R. Vrijen, W. van der Zande and L. Noordam, Chem. Phys. Lett., 1998, 290, 75–80 CrossRef CAS.
- V. D. Kleiman, S. M. Arrivo, J. S. Melinger and E. J. Heilweil, Chem. Phys., 1998, 233, 207–216 CrossRef CAS.
- P. Nuernberger, T. Vieille, C. Ventalon and M. Joffre, J. Phys. Chem. B, 2011, 115, 5554–5563 CrossRef CAS PubMed.
- C. Ventalon, J. M. Fraser, M. H. Vos, A. Alexandrou, J.-L. Martin and M. Joffre, Proc. Natl. Acad. Sci. U. S. A., 2004, 101, 13216–13220 CrossRef CAS PubMed.
- D. B. Strasfeld, S. H. Shim and M. T. Zanni, Phys. Rev. Lett., 2007, 99, 1–4 CrossRef PubMed.
- A. M. Wodtke, D. Matsiev and D. Auerbach, Prog. Surf. Sci., 2008, 83, 167–214 CrossRef CAS.
- K. Golibrzuch, N. Bartels, D. J. Auerbach and A. M. Wodtke, Annu. Rev. Phys. Chem., 2015, 66, 399–425 CrossRef CAS PubMed.
- B. C. Krüger, S. Meyer, A. Kandratsenka, A. M. Wodtke and T. Schäfer, J. Phys. Chem. Lett., 2016, 7, 441–446 CrossRef PubMed.
- M. Silva, R. Jongma, R. W. Field and A. M. Wodtke, Annu. Rev. Phys. Chem., 2001, 52, 811–852 CrossRef CAS PubMed.
- M. Kneba and J. Wolfrum, Annu. Rev. Phys. Chem., 1980, 31, 47–79 CrossRef CAS.
- C. Moore and I. Smith, Faraday Discuss. Chem. Soc., 1979, 67, 146–161 RSC.
- M. C. Thielges and M. D. Fayer, J. Phys. Chem. A, 2011, 115, 9714–9723 CrossRef CAS PubMed.
- D. Lotti, P. Hamm and J. P. Kraack, J. Phys. Chem. C, 2016, 120, 2883–2892 CAS.
- J. P. Kraack, D. Lotti and P. Hamm, in Proc. of SPIE, Physical Chemistry of Interfaces and Nanomaterials XIV, ed. S. C. Hayes and E. R. Bittner, 2015, vol. 9549, p. 95490S Search PubMed.
- J. P. Kraack, D. Lotti and P. Hamm, J. Chem. Phys., 2015, 142, 212413 CrossRef PubMed.
- J. P. Kraack, D. Lotti and P. Hamm, J. Phys. Chem. Lett., 2014, 5, 2325–2329 CrossRef CAS PubMed.
- D. Enders, T. Nagao, A. Pucci, T. Nakayama and M. Aono, Phys. Chem. Chem. Phys., 2011, 13, 4935–4941 RSC.
- A. Hatta, Y. Chiba and W. Suëtaka, Surf. Sci. Lett., 1985, 158, A437 CrossRef.
- F. Kaneko, H. Miyamoto and M. Kobayashi, J. Chem. Phys., 1996, 105, 4812 CrossRef CAS.
- W. L. Barnes, A. Dereux and T. W. Ebbesen, Nature, 2003, 424, 824–830 CrossRef CAS PubMed.
- J. B. Pendry, L. Martín-Moreno and F. J. Garcia-Vidal, Science, 2008, 305, 847–848 CrossRef PubMed.
- R. G. Greenler, D. R. Snider, D. Witt and R. S. Sorbello, Surf. Sci., 1982, 118, 415–428 CrossRef CAS.
- G. T. Merklin and P. R. Griffiths, J. Phys. Chem. B, 1997, 101, 5810–5813 CrossRef CAS.
- P. Hamm, M. Lim and R. M. Hochstrasser, Ultrafast Phenom. XI Proc. 11th Int. Conf., 1998, 63, 514–516 CAS.
- M. Zamadar, S. Asaoka, D. C. Grills and J. R. Miller, Nat. Commun., 2013, 4, 2818 Search PubMed.
- E. W. Abel and I. S. Butler, Trans. Faraday Soc., 1967, 63, 45 RSC.
- C. R. Baiz, P. L. McRobbie, J. M. Anna, E. Geva and K. J. Kubarych, Acc. Chem. Res., 2009, 42, 1395–1404 CrossRef CAS PubMed.
- P. Yu, F. Yang, J. Zhao and J. Wang, J. Phys. Chem. Burn. Phys. Chem. B, 2014, 118, 3104–3114 CrossRef CAS PubMed.
- J. E. Laaser, R. Christianson, T. A. Oudenhoven, Y. Joo, P. Gopalan, J. R. Schmidt and M. T. Zanni, J. Phys. Chem. C, 2014, 118, 5854–5861 CAS.
- D. E. Rosenfeld, Z. Gengeliczki, B. J. Smith, T. D. P. Stack and M. D. Fayer, Science, 2011, 334, 634–639 CrossRef CAS PubMed.
- J. Wang, M. L. Clark, Y. Li, C. L. Kaslan, C. P. Kubiak and W. Xiong, J. Phys. Chem. Lett., 2015, 6, 4204–4209 CrossRef CAS PubMed.
- C. W. Machan, M. D. Sampson, S. A. Chabolla and C. P. Kubiak, Organometallics, 2014, 33, 4550–4559 CrossRef CAS.
| This journal is © the Owner Societies 2016 |

