
 Open Access Article
 This Open Access Article is licensed under a
 Creative Commons Attribution 3.0 Unported Licence
Enhancement of island size by dynamic substrate disorder in simulations of graphene growth†
Gwilym
Enstone
*a,
Peter
Brommer
 bc,
David
Quigley
bd and
Gavin R.
Bell
d
bc,
David
Quigley
bd and
Gavin R.
Bell
d
aCentre for Complexity Science, University of Warwick, Coventry, CV4 7AL, UK. E-mail: g.t.enstone@warwick.ac.uk; Tel: +44 (0)24 765 74580
bCentre for Scientific Computing, University of Warwick, Coventry, CV4 7AL, UK
cWarwick Centre for Predictive Modelling, School of Engineering, University of Warwick, Coventry, CV4 7AL, UK
dDepartment of Physics, University of Warwick, Coventry, CV4 7AL, UK
First published on 10th May 2016
Abstract
We demonstrate a new mechanism in the early stages of sub-monolayer epitaxial island growth, using Monte Carlo simulations motivated by experimental observations on the growth of graphene on copper foil. In our model, the substrate is “dynamically rough”, by which we mean (i) the interaction strength between Cu and C varies randomly from site to site, and (ii) these variable strengths themselves migrate from site to site. The dynamic roughness provides a simple representation of the near-molten state of the Cu substrate in the case of real graphene growth. Counterintuitively, the graphene island size increases when dynamic roughness is included, compared to a static and smooth substrate. We attribute this effect to destabilisation of small graphene islands by fluctuations in the substrate, allowing them to break up and join larger islands which are more stable against roughness. In the case of static roughness, when process (ii) is switched off, island growth is strongly inhibited and the scale-free behaviour of island size distributions, present in the smooth-static and rough-dynamic cases, is destroyed. The effects of the dynamic substrate roughness cannot be mimicked by parameter changes in the static cases.
1 Introduction
Two-dimensional (2D) materials, such as graphene1–3 and BN,4,5 and layered materials such as Bi2(Te,Se)3,6,7 Mo(S,Se)2,8,9 are attracting enormous interest due to their potential in electronic and spintronic devices. For such applications, large single crystal grains and low-angle grain boundaries are advantageous, hence high quality orientationally-ordered films with low nucleation density and few defects are very desirable. Chemical vapour deposition (CVD) has become established as the most promising scalable route to graphene and BN growth.2 In the last few years, a lot of effort has gone into improving graphene grain sizes for CVD growth on low-cost polycrystalline copper substrates by manipulating substrate temperature, growth rate and substrate cleaning protocols. Growth temperatures of around 1000 °C mean that copper substrates are nearly molten;10 indeed, graphene can be grown on liquid surfaces.11,12 A great deal of copper sublimation occurs during a typical surface preparation and CVD growth run. Furthermore, a structural feedback effect has been noted, whereby the copper surface restructures by faceting only after CVD growth of a graphene overlayer.3 Combined, these observations strongly imply that the Cu substrate can be far from equilibrium during CVD growth, and hence cannot be considered as a perfectly static crystal facet. The role of substrate roughness in controlling graphene nucleation has been described as pivotal,13 but this role has yet to be included in any kinetic growth model based on rate equations.While recent density functional tight binding (DFTB) simulations14 have probed the early stages of graphene nucleation on semi-molten copper, these cannot access the wider range of time and length scales over which important processes occur.15,16 These range from atomistic events on a timescale around 10−12 s to the scale of hundreds of microns and minutes for graphene grain completion. Monte Carlo (MC) models allow microscopic events to be aggregated efficiently so that, for example, the nucleation, growth and coalescence of 2D islands17–20 or 3D nano-clusters21–23 on a surface can be studied. The key ingredient of a MC model is the list of microscopic events which can occur and their rates or probabilities. Typically such models are constructed on a static lattice: monomers (atoms) can occupy discrete sites, which are identical in the substrate, so that only occupancy by monomers in the dynamic growing layer differentiates the sites. This type of model does not seem to be appropriate for a growth system where the substrate is highly active during growth, such as copper in graphene CVD.
A great deal of insight into fundamental surface growth processes can be gained by studying growth well below monolayer (ML) coverage, i.e. when monomers have aggregated to islands which do not completely fill the layer and have not begun to coalesce. The island size distribution (ISD) can reveal much about the underlying processes in surface growth.1,24,25 In particular, under many surface growth conditions one expects to observe dynamic scaling behaviour of the ISD, i.e. the shape of the distribution does not depend on the average size of the islands (which increases with coverage). The precise forms of ISDs have been discussed for many years.26–28 Experimentally, one can use a technique such as scanning tunnelling microscopy (STM) to study island formation and growth with atomic-scale precision, normally quenching the sample after sub-ML growth and working ex situ.1,25,29 Atomic resolution STM is well suited to ultra-high vacuum growth techniques, and can even be performed in situ.30 Performing STM in a CVD growth environment31 is very challenging: more generally, in situ CVD growth monitoring is far from routine,32,33 especially on polycrystalline and non-planar substrates such as Cu foil. This gives modelling studies an important role in connecting experimental parameters to post-growth film characteristics, and in bridging the gap between microscopic behaviour and large-scale island characteristics measured ex situ.4
In this paper, we report simulations on the early stages of graphene growth using a minimal MC model constructed to mimic the semi-molten dynamically rough nature of a hot copper substrate. While the effect of dynamic roughness on individual ad-atom diffusion has been studied in lattice-gas models,34 the effect on growth has not been previously quantified. We find that dynamic substrate disorder actually enhances the growth of large, regular islands, and preserves the scaling of the ISDs over a wide range of coverages. By contrast, static disorder hinders the growth of large islands, compared to a uniform lattice, and destroys ISD scaling. Our dynamic substrate approach is applicable to many surface growth systems.
2 Methods
We study an abstract lattice-gas growth model, with parameters motivated by graphene CVD growth on copper. This consists of Metropolis MC on a periodic, two dimensional honeycomb lattice, simulated in the semigrand ensemble.35 We use a honeycomb lattice to replicate the coordination number of carbon in graphene. In such models, precise structural details are abstracted into an effective picture. Our choice of lattice symmetry is hence essentially arbitrary and is not in any way intended to reflect the symmetry of preferential absorption sites on a facetted copper surface.Lattice sites are occupied by either hydrogen (H) or carbon (C) atoms. Energetics are captured via nearest neighbour interactions with Hamiltonian
 | (1) |
The relevant thermodynamic potential is
| G = H0 − μCNC − μHNH, | (2) |
Provided ECH ≪ ECC the exact choice of this parameter does not significantly alter the characteristics of simulated growth. In these units, a temperature of T = 1000 K scales to a lattice temperature of ∼0.01.
Simulations are initialised with hydrogen (assumed to be in excess), occupying every lattice site. All simulations reported here were performed on a lattice with N = 36![[thin space (1/6-em)]](https://www.rsc.org/images/entities/char_2009.gif) 864 sites, and consist of growth and annealing phases. During growth, carbon is inserted into the lattice via transmutation of H into C, capturing the displacement of molecular hydrogen by hydrocarbons during CVD. In addition to transmutation, our simulations model diffusion of carbon via exchange with H atoms on lattice sites within the same hexagonal unit. Possible diffusion moves are represented in Fig. 1. Inclusion of moves which are equivalent by symmetry results in 12 move targets, which are selected with equal probability.
864 sites, and consist of growth and annealing phases. During growth, carbon is inserted into the lattice via transmutation of H into C, capturing the displacement of molecular hydrogen by hydrocarbons during CVD. In addition to transmutation, our simulations model diffusion of carbon via exchange with H atoms on lattice sites within the same hexagonal unit. Possible diffusion moves are represented in Fig. 1. Inclusion of moves which are equivalent by symmetry results in 12 move targets, which are selected with equal probability.
 | ||
| Fig. 1 Diagram of permitted diffusion moves, and their effect on island formation. Panel (a) shows three possible moves, to first, second and third nearest neighbours (1NN, 2NN, 3NN respectively) within local hexagons, in (i), (ii) and (iii) respectively. Panel (b) shows a representative snapshot of growth with only 1NN moves, and panel (c) a snapshot with 1NN, 2NN and 3NN moves. Note that with only 1NN moves carbon islands are fragmented, but regular in shape when all three moves are included. | ||
To motivate this model selection, Fig. 1 also shows representative snapshots from simulations with nearest-neighbour moves, as well as using all 12 diffusion targets. In the former case, carbon islands form disjointed fractal shapes. The greater isotropy of the latter case generates smoothly terminating regular islands, representative of experimental graphene islands.
A single MC sweep consists of N trial moves, each attempted on a randomly selected lattice site. We interpret our simulations on a notional time scale by connecting the mean square displacement 〈δr2〉 of single C atoms over an MC sweep to a timestep via δt = 4D〈δr2〉. For convenience, we choose D such that δt = 1, i.e. time is incremented by one unit per MC sweep.
During growth, transmutation and diffusion moves are attempted with ratio F = 10−5 up to a fixed coverage θ. With this choice of F, the timescale of diffusion is far longer than the timescale of insertion. During the annealing phase, only diffusion moves are permitted, for a further tA sweeps of the system. In principle, results can be scaled to real time units via experimental measurements of effective D and F, however such data are not typically accessible.
Chemical potentials are chosen such that insertion moves are effectively always accepted (μC > μH). As the simulation temperature is low compared to the effective carbon–carbon bond energy, events which involve breaking these bonds once formed, are rare. Growth is irreversible under these conditions.
Surface roughness is introduced into the model by assigning each lattice site i a “roughness energy” εi drawn from a top hat distribution of width ξ, centred about 0.
 | (3) |
This reflects the spatial variation in carbon attachment energy expected of a disordered substrate. The exact shape of distribution is inconsequential to the results described in this paper, provided it is symmetric about zero.
As well as the roughness amplitude captured by ξ, we model the mobility of the substrate roughness. Sites are permitted to exchange their roughness energies εi with that of their neighbours. This roughness move is subject to the same Metropolis acceptance criteria as the diffusion moves in Fig. 1, but using a separate ‘substrate temperature’ Ts, interpreted as a roughness mobility parameter. Decoupling these moves from the simulation temperature allows us to vary this parameter from a totally static surface roughness (Ts = 0) through to a freely diffusing molten substrate (Ts = ∞). These roughness moves occur with the same frequency as carbon diffusion moves, and varying this frequency was seen to have little to no effect on the final island size distribution.
For typical examples of growth in three key cases (ξ = Ts = 0, ξ = 1.2, Ts = 0 and ξ = 1.2, Ts = ∞), we refer the reader to the ESI.† For reference, a full list of kinetic and thermodynamic parameters is shown in Table 1.
| Parameter | Value | |
|---|---|---|
| N | Grid size | 36864 |
| F | Deposition ratio | 10−5 |
| t A | Anneal time | 50000 sweeps |
| T | Temperature | 0.01 |
| E CC | C–C bond energy | −1.0 |
| E CH | C–H bond energy | −0.1 |
| E HH | H–H bond energy | 0.0 |
| μ C, μH | Chemical potentials | 5, 3 |
3 Results
Varying the roughness amplitude and mobility parameters has a dramatic effect upon island size and formation. In the static case (Ts = 0), increasing the roughness amplitude ξ leads to formation of small, fragmented islands at concentrations of favourable lattice sites. In the maximally dynamic case (Ts = ∞), islands are destabilised, causing them to move, transform, and dissociate freely. In a critical range of ξ values, from roughly 1 to 1.5, this leads to formation of fewer, larger islands with a significant fraction of carbon mobilised in monomers or small clusters. Example surfaces at different roughness parameters are shown in Fig. 2. Quantitative analysis is based on mean island size![[S with combining macron]](https://www.rsc.org/images/entities/i_char_0053_0304.gif) and ISDs. With dynamic roughness, many small islands and monomers appear, making ISDs difficult to visualize. Hence we count only islands above a threshold size of S = 10 for these surfaces.
and ISDs. With dynamic roughness, many small islands and monomers appear, making ISDs difficult to visualize. Hence we count only islands above a threshold size of S = 10 for these surfaces.
 | ||
| Fig. 2 Varying strength of surface roughness parameter ξ and mobility parameter Ts against the average island size for islands greater than 10 in size. Data are averaged over 10 trajectories each of which contains typically 30–100 islands. Standard error in the resulting mean of is smaller than the symbol size at each point. Four snapshots from simulations, taken after growth to a fixed coverage and annealing, are shown, for ξ = 1.2, Ts = ∞ (A) ξ = 1.2, Ts = 0 (D), ξ = 1.5, Ts = ∞ (B) and ξ = 1.5, Ts = 0 (C). The colour scale represents the roughness energy, lighter shades representing positive values. Snapshot sizes represent approximately 15% of the simulation area. All simulations used parameters described in Table 1. | ||
Fig. 2 shows the effect of varying ξ on . Dynamic cases show peaks in island size beyond ξ = 1.0, the effective C–C bond energy, and peaking at ξ = 1.2 for Ts = ∞. A snapshot is shown for Ts = ∞ at ξ = 1.2, and large islands are clearly visible. At higher values of ξ, even large islands are no longer stable, and the surface becomes dominated by smaller fragmented islands, as shown for Ts = ∞ in a snapshot at ξ = 1.5.
Even small values of ξ see significant reduction in island size for the static case, with any regular island structure disintegrating. There is no significant difference in behaviour above or below ξ = 1.0, the islands just get smaller and more localised to favourable surface regions.
Typical evolution of during growth and annealing is shown in Fig. 3. The smooth and static cases both show a continuous increase in island size during growth, and minimal changes during annealing, as a stable structure is reached. The dynamic case has growth up to larger island sizes, but during the annealing phase islands continue to grow. When the annealing phase is extended, islands continue to shift and reform on the dynamic substrate, steadily increasing island size.
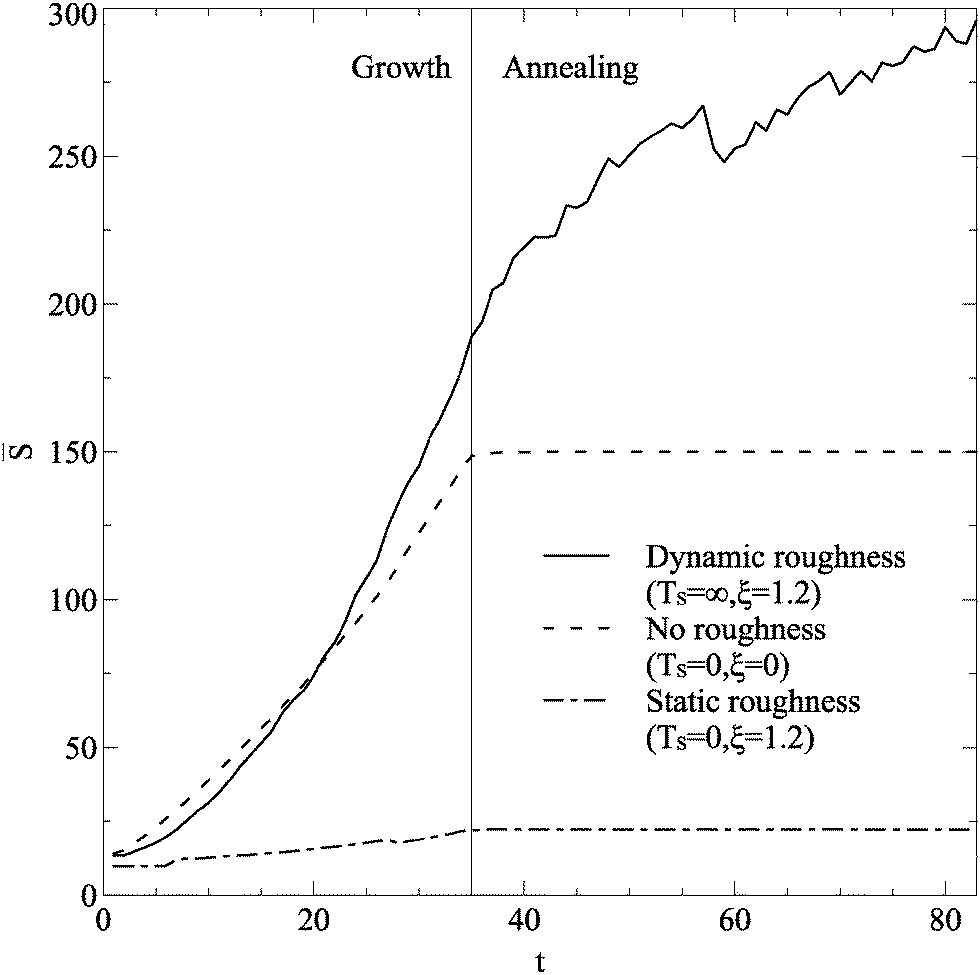 | ||
| Fig. 3 Time evolution of average island size for islands greater than 10 atoms in size. Three lines are shown, for no, static, and dynamic roughness. All simulations had roughness strength ξ = 1.2, and used parameter values in Table 1. A vertical line separates the regimes of growth and annealing. | ||
Nucleation theory26 predicts that island size distributions (ISDs) from samples grown in a process of non-reversible aggregation will follow a scaling distribution of the form:
 | (4) |
) has been estimated analytically,27 for different values of the critical nucleus size, i*.
The critical island size is one less than the smallest number of atoms required to form a stable island, which in simulations without roughness is i* = 1; islands containing two or more atoms are stable. On a dynamic rough surface, the aggregation process is no longer irreversible as islands cleave, move and reform frequently, and thus this theory will not necessarily hold. Applying this scaling law to ISDs taken from smooth, static, maximally dynamic after growth and maximally dynamic after annealing cases gives the distributions shown in Fig. 4.
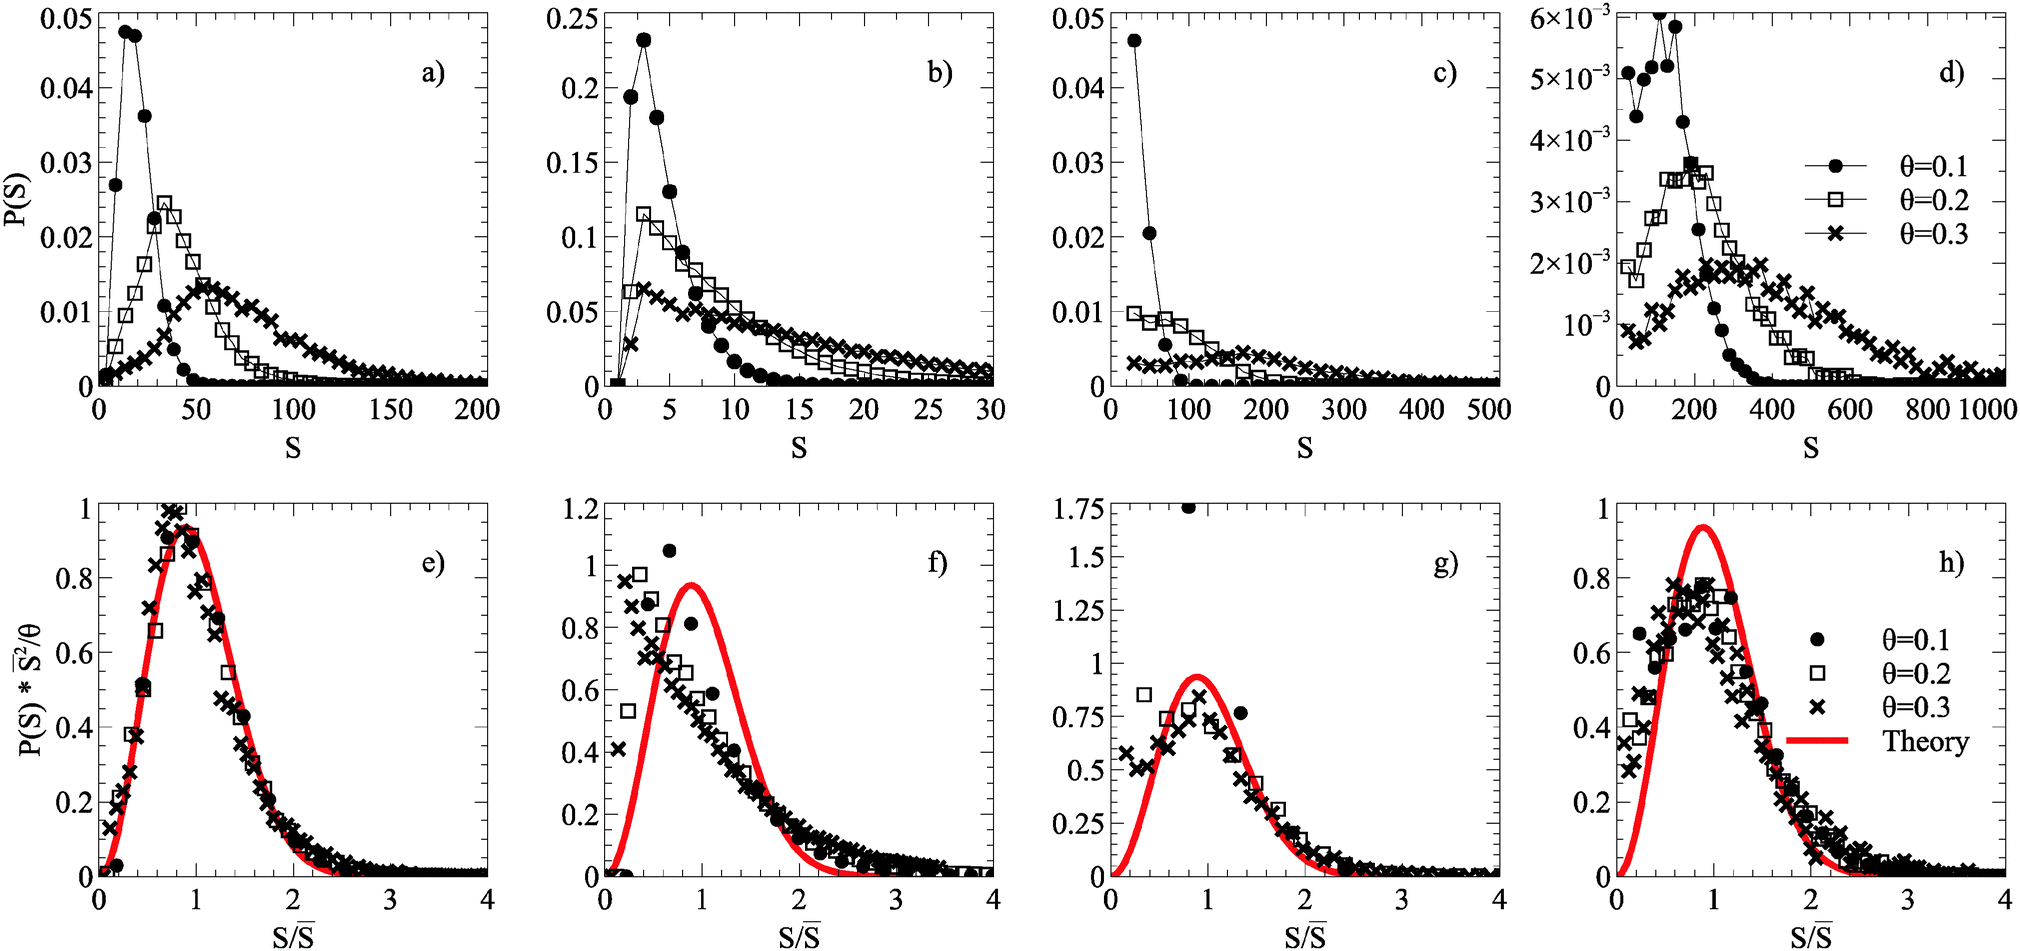 | ||
| Fig. 4 Scaling relations of ISDs taken from simulations grown up to coverages of θ = 0.1, 0.2, 0.3 of a smooth surface after annealing (a) and (e), static roughness surface after annealing (b) and (f), maximally dynamic roughness surface after growth (c) and (g), and a maximally dynamic (Ts = ∞) roughness surface after annealing (d) and (h). The top pictures (a–d) show unscaled ISDs, and the bottom pictures (e–g) scaled ISDs according to relation described in the text. The red line corresponds to the theoretical form of the i* = 1 curve. All roughness simulations used ξ = 1.2, and other parameters described in Table 1. | ||
ISDs from simulations on a smooth surface are well represented by an analytical form of the scaling function associated with i* = 1. The situation for dynamic substrate roughness is more complicated. ISDs from dynamically rough substrates do not collapse onto a single curve immediately after growth termination. However, the post-growth annealing process does result in universal scaling of the ISDs with a different form to that of the smooth substrate or i* = 1 analytical form. The scaled ISDs are actually broader than the i* = 1 form but still peaked.
To investigate the evolution of surface roughness during growth, the total carbon–substrate interaction energies for dynamic and static roughness are plotted in Fig. 5. In the static case, carbon islands form above favourable regions of the lattice, and as such the total carbon–substrate interaction energy is low. In the dynamic case, however, the energy of sites underneath carbon atoms is relatively high, suggesting that the substrate lattice does not reorder itself underneath carbon islands. There is a change in gradient at around ξ = 1.0 in both the static and the dynamic cases, corresponds to the beginning of peaks in shown in Fig. 2.
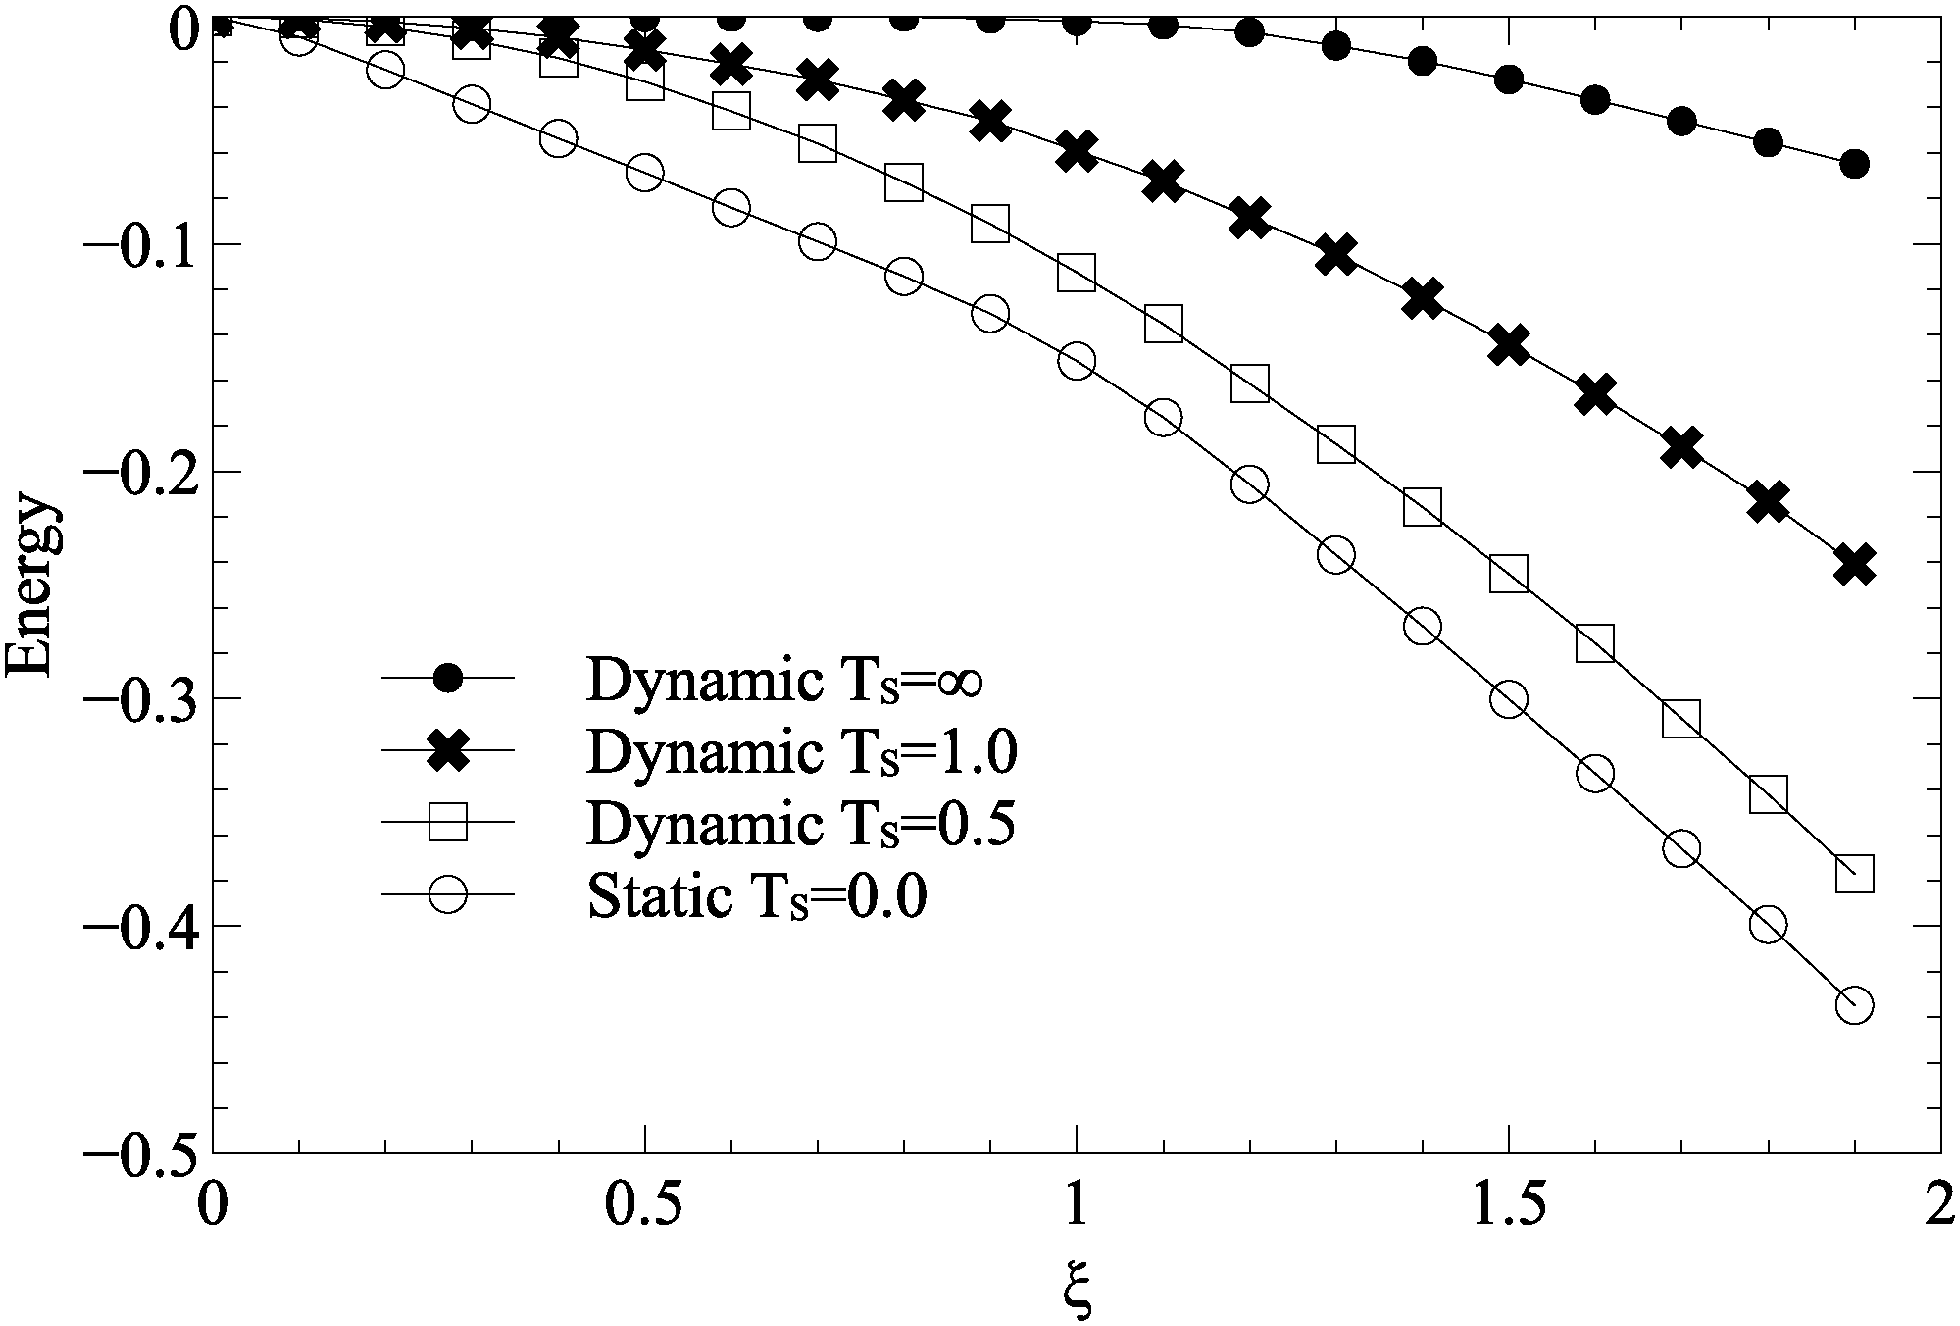 | ||
| Fig. 5 Varying strength of surface roughness, ξ, for static and dynamic roughness, against the average substrate energy under a carbon atom. All simulations used parameters described in Table 1. | ||
4 Discussion
Our simple MC scheme, including 2NN and 3NN moves shown in Fig. 1 behaves entirely as expected in the absence of roughness. Graphene islands observed in simulations tend to a regular hexagonal or circular shape, although when two islands meet during growth they are often unable to reform into optimal shapes leading to extended anisotropic morphologies. Nonetheless, there is a clear preference for zigzag termination and corners of 120°. Graphene islands on copper have been observed with compact (hexagonal), four-lobed and dendritic shapes, depending on the substrate symmetry and growth conditions.2The ISDs (Fig. 4(a) and (e)) produced obey the expected dynamic scaling relation, with ISDs at different coverages collapsing onto a single scaled curve. This demonstrates the same processes of irreversible growth occur across different length scales. The ISDs are well described by a scaling function derived from nucleation theory and observed in a wide variety of surface growth systems.26,28,36
The case of static roughness leads to a drastic reduction in growth, at even low ξ. Islands formed remain small and random in nature, the preference for moving onto a favourable substrate site rather than forming C–C bonds effectively eliminating large island formation. The ISDs (Fig. 4(b) and (f)) do not collapse onto a single curve under a scaling relation, and do not match the theoretical curve. This suggests that static roughness has introduced a fixed length scale onto the surface, namely the mean distance between energetically favourable sites, loosely defined by the shape of the energy distribution.
The total carbon–substrate energy decreases linearly with ξ, suggesting that increasing roughness simply makes the sites which carbon atoms select more favourable, rather than affecting the underlying mechanism of growth. The change in gradient at ξ = 1.0, the effective C–C bond energy, suggests an increased preference for substrate sites over C–C bonds, but does not produce a noticeable difference in resulting island morphologies.
The case of dynamic roughness, by contrast, leads to an enhancement of island size during the annealing stage of simulation. Islands grow to a larger size than on a smooth surface, even after only the growth stage, and continue to grow during annealing. The constantly shifting surface roughness prevents kinetic trapping, allowing regular islands to reform, cleave, and move across the surface.
ISDs after growth but before annealing (Fig. 4(c) and (g)) have substantial amounts of carbon atoms as small islands coexisting with large islands. At low total coverage θ there is a large contribution to the ISD from such small islands which reduces in weight as θ increases, destroying ISD scaling. In semiconductor heteroepitaxy, similar deviations from ideal scaling behaviour have been interpreted as due to scale-dependent interactions imposed on a system by surface reconstruction,29 elastic strain36 or both.37 By contrast, in the present case the origin of the loss of scaling is purely dynamic because the dynamic roughness has a disproportionate effect on the smaller islands.
ISDs after annealing (Fig. 4(d) and (h)) see much of the mobile carbon being agglomerated into islands, with more defined peaks and heavier tails. Here the ISDs do collapse onto a single curve. Once islands reach a certain size they become resistant to the cleaving effects of dynamic roughness and so scale-free behaviour is recovered. However, the scaled ISDs do not follow the conventional i* = 1 distribution, with a slightly broader and flatter shape. This is not surprising given that dynamic roughness enhances both island cleaving and island growth, leading to a broader distribution. Since increasing the value of i* typically sharpens the peak of the scaled ISD and i* = 0 ISDs are typically monotonically decreasing,26,28,36 this altered scaling form suggests that the effects due to a combination of dynamic roughness and annealing could not be captured in any standard irreversible aggregation picture.
These conclusions are not greatly affected by the choice to measure ISDs neglecting the smallest islands (S < 10) for the dynamic roughness case. This choice simply allows us to display the peak of larger islands more easily and the value of the cutoff simple changes the coverage θ at which deviations from scaling become apparent. When comparing to the static roughness case, the central qualitative point is that there is no broad tail of large islands for static roughness.
Increasing ξ for dynamic substrates sees a peak in mean island size (Fig. 2). At higher values of ξ, the substrates prevents even large islands having stability on the surface, whilst lower values of ξ are unable to motivate islands to move or morph in any way. In the case of maximal disorder, the total carbon–substrate energy is approximately 0 until ξ = 1.0, at which point it shows a small linear decrease with ξ. This suggests a minor coupling between the substrate and the carbon islands, but not large scale reordering. Indeed, examining snapshots of the substrate after annealing shows no inclination to reform underneath carbon islands. This demonstrates the effect described is motivated by thermal energy and substrate disorder, rather than some sort of feedback and reordering.
Simple diffusion and deposition models can be mapped to Ising-like spin lattice models. In the case of static roughness, this mapping is to a random field Ising model (RFIM), in which growth has been previously studied.38,39 Experimental results concerning growth on surfaces with static defects have been explained in the framework of the RFIM.40,41 We believe the introduction of experimentally motivated nearest neighbour field swaps is unique to our model and hence of potential interest to fundamental growth studies.
In the case of graphene specifically, our analysis of growth on dynamically disordered substrates has focussed on the extreme case of unlimited surface mobility. It is clear from Fig. 2 that substantial enhancement of island size can be achieved with lower mobility. If however one interprets Ts literally, i.e. as the temperature of the copper substrate, it is clear that achieving enhanced growth requires unphysical high temperatures and low heat transfer between copper and graphene. In addition, our model cannot capture the structural feedback effect observed experimentally for graphene CVD growth on Cu(100), namely nano-faceting to (210) + (100) morphology.3 Further, detailed atomistic/electronic studies are required to establish the extent of substrate mobility at experimental growth temperatures, and the effect this has on destabilisation of high energy aggregates. We note that most existing theoretical studies at higher levels of detail have focussed on perfect copper facets42–45 or (for Ni substrates) well defined ideal surface steps.46
We are presently investigating spatial correlation of the surface roughness to examine effects of faceting. This will also allow us to address short range correlations, for example by one Cu site affecting multiple neighbouring C atoms. Some other experimentally observed aspects of graphene growth are not replicated in our simple lattice model. For example, islands formed with dynamic roughness contain vacancies, such as the ones in the larger islands in Fig. 2. These are mostly formed for single, or small clusters of unfavourable sites. They propagate through the islands throughout the simulation, being swiftly incorporated or removed through the jagged edges. There has been much investigation into the behaviour of defects in monolayer graphene,47,48 including their formation and possible healing. This can never truly be interpreted in a lattice model where grains cannot be oriented differently and it is impossible to consider rings of anything other than 6 carbon atoms.
5 Conclusion
In this paper we have presented an abstract lattice MC model for surface monolayer growth. Motivated by the fact that the copper substrate used in CVD is close to its melting point, far from a smooth and regular surface, we have introduced a random roughness energy to each site on the lattice. These sites were then fixed (static roughness), or allowed to exchange energies locally (dynamic roughness) with varying degrees of mobility.The static roughness inhibits island formation, leading to a fragmented surface. Dynamic roughness, at optimal roughness strength ξ, increases the mobility of graphene islands, substantially enhancing the observed grain size. As has been established in a number of studies, and cogently summarised in a recent review,49 optimal conditions for self-assembly occur when interaction energies between components are delicately balanced by thermal noise. In this regime, aggregates can be restructured by bond-breaking and reformation, preventing the formation of kinetically trapped high energy structures. In our model, dynamic substrate roughness plays the role of thermal noise, allowing structures which would otherwise form irreversibly, to anneal. This mechanism is entirely consistent with the “defect healing” mechanism induced by Cu surface mobility reported in the more detailed simulations of Li et al.14 We believe that our ability to capture this effect in a simple lattice-gas model suggests the phenomenon may be quite general, to the understanding of which could have dramatic effects on nanomaterial production. The next steps for this exploration could include looking at a rough substrate in greater detail, perhaps by including correlation in the substrate energies, or more complex interaction energy calculations. An off-lattice model could also be explored, which would allow investigation into local epitaxial effects through a more realistic substrate interaction.
Acknowledgements
This research was supported by EPSRC grants EP/H00341X/1, EP/I01358X/1 and used computing resources provided by the Centre for Scientific Computing at the University of Warwick. Valuable discussions with Neil Wilson are gratefully acknowledged.References
- H. Tetlow, J. P. de Boer, I. Ford, D. Vvedensky, J. Coraux and L. Kantorovich, Phys. Rep., 2014, 542, 195–295 CrossRef CAS.
- C.-M. Seah, S.-P. Chai and M. Abdul Rahman, Carbon, 2014, 70, 1–21 CrossRef CAS.
- N. R. Wilson, A. J. Marsden, M. Saghir, C. J. Bromley, R. Schaub, G. Costantini, T. W. White, C. Partridge, A. Barinov, P. Dudin, A. M. Sanchez, J. J. Mudd, M. Walker and G. R. Bell, Nano Res., 2013, 6, 99–112 CrossRef CAS.
- G. Wood, A. Marsden, J. Mudd, M. Walker, M. Asensio, J. Avila, K. Chen, G. Bell and N. Wilson, 2D Mater., 2015, 2, 025003 CrossRef.
- A. L. Gibb, N. Alem, J.-H. Chen, K. J. Erickson, J. Ciston, A. Gautam, M. Linck and A. Zettl, J. Am. Chem. Soc., 2013, 135, 6758–6761 CrossRef CAS PubMed.
- J. H. Jeon, M. Song, H. Kim, W.-J. Jang, J.-Y. Park, S. Yoon and S.-J. Kahng, Appl. Surf. Sci., 2014, 316, 42–45 CrossRef CAS.
- J. Hellerstedt, M. T. Edmonds, J. H. Chen, W. G. Cullen, C. X. Zheng and M. S. Fuhrer, Appl. Phys. Lett., 2014, 105, 173506 CrossRef.
- Y. Shi, W. Zhou, A.-Y. Lu, W. Fang, Y.-H. Lee, A. L. Hsu, S. M. Kim, K. K. Kim, H. Y. Yang, L.-J. Li, J.-C. Idrobo and J. Kong, Nano Lett., 2012, 12, 2784–2791 CrossRef CAS PubMed.
- S. Vishwanath, X. Liu, S. Rouvimov, P. C. Mende, A. Azcatl, S. McDonnell, R. M. Wallace, R. M. Feenstra, J. K. Furdyna, D. Jena and H. G. Xing, 2D Mater., 2015, 2, 024007 CrossRef.
- I. Vlassiouk, S. Smirnov, M. Regmi, S. P. Surwade, N. Srivastava, R. Feenstra, G. Eres, C. Parish, N. Lavrik, P. Datskos, S. Dai and P. Fulvio, J. Phys. Chem. C, 2013, 117, 18919–18926 CAS.
- D. Geng, B. Wu, Y. Guo, L. Huang, Y. Xue, J. Chen, G. Yu, L. Jiang, W. Hu and Y. Liu, Proc. Natl. Acad. Sci. U. S. A., 2012, 109, 7992–7996 CrossRef CAS PubMed.
- G. Ding, Y. Zhu, S. Wang, Q. Gong, L. Sun, T. Wu, X. Xie and M. Jiang, Carbon, 2013, 53, 321–326 CrossRef CAS.
- H. Kim, C. Mattevi, M. R. Calvo, J. C. Oberg, L. Artiglia, S. Agnoli, C. F. Hirjibehedin, M. Chhowalla and E. Saiz, ACS Nano, 2012, 6, 3614–3623 CrossRef CAS PubMed.
- H.-B. Li, A. J. Page, C. Hettich, B. Aradi, C. Kohler, T. Frauenheim, S. Irle and K. Morokuma, Chem. Sci., 2014, 5, 3493–3500 RSC.
- D. Vvedensky, J. Phys.: Condens. Matter, 2004, 16, R1537 CrossRef CAS.
- M. Basham, F. Montalenti and P. A. Mulheran, Phys. Rev. B: Condens. Matter Mater. Phys., 2006, 73, 045422 CrossRef.
- H. Brune, M. Giovannini, K. Bromann and K. Kern, Nature, 1998, 394, 451–453 CrossRef CAS.
- B. Voigtländer, T. Weber, P. Šmilauer and D. E. Wolf, Phys. Rev. Lett., 1997, 78, 2164–2167 CrossRef.
- P. Mulheran and J. Blackman, Surf. Sci., 1997, 376, 403–410 CrossRef CAS.
- S. F. Hopp and A. Heuer, J. Chem. Phys., 2010, 133, 204101 CrossRef PubMed.
- P. Gaillard, J.-N. Aqua and T. Frisch, Phys. Rev. B: Condens. Matter Mater. Phys., 2013, 87, 125310 CrossRef.
- T. P. Schulze and P. Smereka, Phys. Rev. B: Condens. Matter Mater. Phys., 2012, 86, 235313 CrossRef.
- Y. Zhu and T. Wang, Appl. Surf. Sci., 2015, 324, 831–836 CrossRef CAS.
- M. Einax, W. Dieterich and P. Maass, Rev. Mod. Phys., 2013, 85, 921 CrossRef CAS.
- B. Joyce, D. Vvedensky, G. Bell, J. Belk, M. Itoh and T. Jones, Mater. Sci. Eng., B, 1999, 67, 7 CrossRef.
- J. G. Amar and F. Family, Phys. Rev. Lett., 1995, 74, 2066 CrossRef CAS PubMed.
- A. Pimpinelli and T. L. Einstein, Phys. Rev. Lett., 2007, 99, 226102 CrossRef PubMed.
- V. G. Dubrovskii and N. V. Sibirev, Phys. Rev. E: Stat., Nonlinear, Soft Matter Phys., 2015, 91, 042408 CrossRef CAS PubMed.
- M. Itoh, G. R. Bell, A. R. Avery, T. S. Jones, B. A. Joyce and D. D. Vvedensky, Phys. Rev. Lett., 1998, 81, 633–636 CrossRef CAS.
- S. Tsukamoto, T. Honma, G. Bell, A. Ishii and Y. Arakawa, Small, 2006, 2, 386–389 CrossRef CAS PubMed.
- M. Pristovsek, R. Kremzow and M. Kneissl, Jpn. J. Appl. Phys., 2013, 52, 041201 CrossRef.
- M. Losurdo, M. M. Giangregorio, P. Capezzuto and G. Bruno, J. Phys. Chem. C, 2011, 115, 21804–21812 CAS.
- M. Pristovsek, B. Rähmer, M. Breusig, R. Kremzow and W. Richter, J. Cryst. Growth, 2007, 298, 8–11 CrossRef CAS.
- A. Tarasenko and L. Jastrabik, Phys. Chem. Chem. Phys., 2011, 13, 2300–2306 RSC.
- D. A. Kofke and E. D. Glandt, Mol. Phys., 1988, 64, 1105–1131 CrossRef CAS.
- T. J. Krzyzewski, P. B. Joyce, G. R. Bell and T. S. Jones, Phys. Rev. B: Condens. Matter Mater. Phys., 2002, 66, 201302 CrossRef.
- G. R. Bell, T. J. Krzyzewski, P. B. Joyce and T. S. Jones, Phys. Rev. B: Condens. Matter Mater. Phys., 2000, 61, 10551 CrossRef.
- S. R. Anderson, Phys. Rev. B: Condens. Matter Mater. Phys., 1987, 36, 8435–8446 CrossRef.
- D. S. Fisher, Phys. Rev. Lett., 1986, 56, 416–419 CrossRef CAS PubMed.
- P. J. Eng, P. W. Stephens and T. Tse, Phys. Rev. B: Condens. Matter Mater. Phys., 1992, 46, 5024–5027 CrossRef CAS.
- J.-K. Zuo, G.-C. Wang and T.-M. Lu, Phys. Rev. Lett., 1988, 60, 1053–1056 CrossRef CAS PubMed.
- W. Zhang, P. Wu, Z. Li and J. Yang, J. Phys. Chem. C, 2011, 115, 17782–17787 CAS.
- A. L. Walter, S. Nie, A. Bostwick, K. S. Kim, L. Moreschini, Y. J. Chang, D. Innocenti, K. Horn, K. F. McCarty and E. Rotenberg, Phys. Rev. B: Condens. Matter Mater. Phys., 2011, 84, 195443 CrossRef.
- P. Gaillard, T. Chanier, L. Henrard, P. Moskovkin and S. Lucas, Surf. Sci., 2015, 637–638, 11–18 CrossRef CAS.
- A. J. Page, Y. Wang, H.-B. Li, S. Irle and K. Morokuma, J. Phys. Chem. C, 2013, 117, 14858–14864 CAS.
- J. Gao, J. Yip, J. Zhao, B. I. Yakobson and F. Ding, J. Am. Chem. Soc., 2011, 133, 5009–5015 CrossRef CAS PubMed.
- A. W. Robertson, B. Montanari, K. He, C. S. Allen, Y. A. Wu, N. M. Harrison, A. I. Kirkland and J. H. Warner, ACS Nano, 2013, 7, 4495–4502 CrossRef CAS PubMed.
- F. Banhart, J. Kotakoski and A. V. Krasheninnikov, ACS Nano, 2011, 5, 26–41 CrossRef CAS PubMed.
- S. Whitelam and R. Jack, Annu. Rev. Phys. Chem., 2015, 66, 143 CrossRef CAS PubMed.
Footnote |
| † Electronic supplementary information (ESI) available: Videos of island growth on surfaces with no noise, static roughness and dynamic roughness. See DOI: 10.1039/c6cp00788k |
| This journal is © the Owner Societies 2016 |