 Open Access Article
Two-dimensional infrared spectroscopy of neat ice Ih
Liang
Shi
*a,
J. L.
Skinner
b and
Thomas L. C.
Jansen
*c
aDepartment of Chemistry, Massachusetts Institute of Technology, Cambridge MA 02139, USA
bTheoretical Chemistry Institute and Department of Chemistry, University of Wisconsin, Madison, Wisconsin 53706, USA
cZernike Institute for Advanced Materials, University of Groningen, Nijenborgh 4, 9747 AG Groningen, The Netherlands. E-mail: t.l.c.jansen@rug.nl; Fax: +31 50 363 4947; Tel: +31 50 363 4957
First published on 5th January 2016
Abstract
The assignment of the distinct peaks observed in the OH stretch lineshape of ice Ih is controversial. Recent two-dimensional infrared spectroscopic measurements provided new data. The spectra are, however, challenging to interpret and here we provide simulations that help overcome experimental issues as thermal signals and finite pulse duration. We find good agreement with experiment and the difference between H2O and D2O ices is well accounted for. The overall dynamics is demonstrated to be faster than observed for the corresponding liquid water. We find that excitonic cross peaks exist between the dominant exciton peaks. This leads us to conclude that the cross peaks arise due to the formation of delocalized exciton states, which have essentially no directional correlation between their transition dipoles as opposed to what is commonly seen, for example, in isolated water, where the transition dipoles of the eigenstates are perpendicular to each other.
1 Introduction
Water molecules are ubiquitous in nature and play a crucial role in many processes in biology and chemistry. The ability to form a strong three-dimensional hydrogen bond network determines many of water's often unusual properties such as the high melting point and the lower density of the solid ice phase than the liquid one. Numerous crystalline phases of ice are known,1,2 where the Ih phase is the dominant natural form on Earth as it is formed at atmospheric pressure, while most other ices are formed at much higher pressure. In general crystalline ices exist in either highly ordered forms, where both the oxygen and hydrogen atoms are ordered in a crystalline way or in hydrogen disordered forms, where the oxygen atoms form an ordered crystal, but the hydrogen bonds form a random disordered network. Ice Ih belongs to the hydrogen disordered ice crystals (see Fig. 1). The understanding of ices is important for the understanding of the hydrogen bond properties of water in general.3–11 Still the interpretation of the vibrational spectra of ice Ih has been subject to a long standing debate.9,12–23 It has, for example, been suggested that the lowest frequency peak in the Raman spectrum should be assigned to globally in-phase symmetric stretch, while the rest should be interpreted in terms of out-of-phase symmetric and antisymmetric stretches with longitudinal and transverse optical (LO–TO) phonon splitting.15 Others have concluded that the spectral features arise from an interplay between intra- and intermolecular coupling, that an interpretation in terms of the molecular symmetric and asymmetric stretch modes is meaningless, and that the LO–TO splitting had negligible effect on the spectral line shape.24,25 Recently, two-dimensional infrared spectroscopy (2DIR) was applied to help resolve some of the open questions.26,27 These experiments provide new insights, but also give rise to new questions. Furthermore, the interpretation is complicated by finite pulse effects and contributions from a thermal signal. In this paper, we have applied a recently developed model for the OH-stretch (OD-stretch) vibrations of H2O (D2O) with the goal to provide new insights in the nature of the stretch vibrations in ice Ih and their dynamics.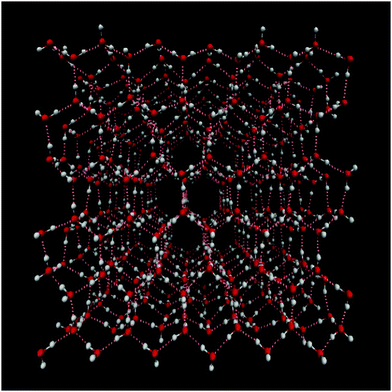 | ||
| Fig. 1 View of the ice Ih water structure. Oxygen is represented in red, hydrogen in white and hydrogen bonds are highlighted in pink dashed lines. The plot was generated using VMD.28 | ||
Two-dimensional infrared spectroscopy29,30 is a powerful technique for studying vibrational dynamics. In this technique a combination of femtosecond laser pulses are applied to a sample essentially first exciting vibrational states and then after a waiting time probing the effect of the initial excitation. The two-dimensional spectrum consists of two frequency axes, one depicting the frequency of the excitation and another providing the frequency of detection, often denoted ω1 and ω3, respectively. The waiting time, which is fixed for each experiment is denoted t2 and can be varied to study dynamics. This provides a combination of structural and temporal sensitivity. The method has been applied to neat liquid water,31–37 liquid water under confined conditions,38–40 water in dilute solutions,41–43 amorphous ice,44–46 and the supercooled state.47 Diagonal peaks arising from exciting one vibration and probing it again at a later time reveal information about spectral diffusion.48–50 Induced absorption peaks appear to the left of the diagonal ones as the initial excitation enables a subsequent transition of the excited molecules to doubly excited states. These induced absorption peaks are typically at lower frequencies due to the anharmonicity of the vibrations resulting in lower values of ω3. Furthermore, as these peaks originate from induced absorption they have the opposite sign of the diagonal bleach and stimulated emission peaks.30 Off-diagonal peaks unmask vibrational couplings that may provide structural information51 as well as information on excitation transfer.31,52 By varying the polarization of the laser pulses used for excitation and detection additional information on relative orientation of vibrational modes can be extracted,51 reorientational motion can be studied,53,54 and excitation transfer changing the transition dipole orientation can be followed.31–33,55
The main experimental findings from the 2DIR spectroscopy of H2O and D2O ice Ih27 were that the spectra of H2O are dominated by the two fundamental transitions, while the D2O spectra reveal signals from three of them. The isotropic spectra exhibited clear cross peaks between the fundamental vibrations, while cross peaks were absent in the anisotropic spectra. The cross peaks in the isotropic spectra were taken to solely originate from an isotropic thermal signal. The authors concluded that the observed bands are not related to excitonic splitting.27 This conclusion contradicts the observation that the excitation is randomized on a very fast timescale. The isotropic signal was found to decay faster for H2O than for D2O, while the opposite was found for the anisotropic signal decay. In the isotropic signals a component rising on a picosecond timescale related to heating effects was observed very much like in water.31
Here we will demonstrate that the isotropic spectra do contain cross peaks of excitonic origin and we will discuss why these cross peaks are essentially absent in the anisotropic signal, which is unusual compared to other systems with vibrational excitons.42,43,52 The remainder of this paper is organized as follows. In Section 2 the modeling approach is outlined. In Section 3 the results are presented and the conclusions are presented in Section 4.
2 Modeling
The two-dimensional infrared spectra were calculated using the vibrational Hamiltonian obtained in ref. 23. In short, MD simulations were performed with the E3B force field for water7 using an ice Ih lattice with 432 water molecules at 80 K. The production trajectory was 100 ps long with snapshots stored every 5 fs resulting in a trajectory of 20![[thin space (1/6-em)]](https://www.rsc.org/images/entities/char_2009.gif) 000 snapshots. The vibrational Hamiltonian for the OH/OD-stretch vibrations of the form:
000 snapshots. The vibrational Hamiltonian for the OH/OD-stretch vibrations of the form: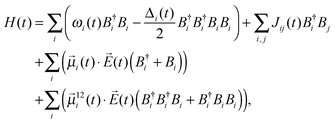 | (1) |
![[small mu, Greek, vector]](https://www.rsc.org/images/entities/i_char_e0e9.gif) i(t), and the correction to the transition dipole for the sequence transition
i(t), and the correction to the transition dipole for the sequence transition ![[small mu, Greek, vector]](https://www.rsc.org/images/entities/i_char_e0e9.gif) 12(t)33 are obtained using electrostatic mappings like for the fundamental frequency and anharmonicity.56
12(t)33 are obtained using electrostatic mappings like for the fundamental frequency and anharmonicity.56![[E with combining right harpoon above (vector)]](https://www.rsc.org/images/entities/i_char_0045_20d1.gif) (t) is the applied laser field. Previously, the FTIR spectra of neat ice Ih22 and the two-dimensional infrared spectra for isotope edited ice Ih23 were simulated with the identical Hamiltonian.
(t) is the applied laser field. Previously, the FTIR spectra of neat ice Ih22 and the two-dimensional infrared spectra for isotope edited ice Ih23 were simulated with the identical Hamiltonian.
The two-dimensional infrared spectra were simulated for neat H2O and D2O ice Ih using the Hamiltonian described above using a computationally efficient version of the NISE approach.57 In this method time-domain response functions (as given in eqn (11) of ref. 58) are calculated by solving the time-dependent Schrödinger equation using propagation of short (5 fs) intervals during which the Hamiltonian is assumed to be constant.58–60 The response functions were evaluated for coherence times, usually denoted t1 and t3, from 0 to 750 fs. For the waiting times denoted t2 the values 0, 150, 200, 300, and 1000 fs were used. The spectra were calculated by adding response functions obtained at 5 ps intervals along the Hamiltonian trajectory and Fourier transforming the coherence times. For H2O a lifetime of 300 fs was used while 700 fs was used for D2O27 following the procedure of ref. 59, where the lifetimes were estimated from ref. 21 and 61.
3 Results and discussion
The linear absorption spectra of H2O and D2O are presented in Fig. 2. The simulated spectra closely resemble those found with identical simulation methods performed at 100 K22 opposed to the 80 K used here and in the experiments.27 The H2O spectrum is dominated by a sharp peak at 3250 cm−1 and has a shoulder at 3200 cm−1, while a weaker tail protrudes on the blue side of the spectrum. In the experimental spectrum the main peak and the shoulder at the red side of the spectrum are both about 25 cm−1 lower in frequency than in the simulations, while the shoulder on the blue side is considerably more pronounced than in the simulations.† The slight underestimation of the solvent shift in the simulations has been discussed previously.8 For D2O the spectral features are similar to H2O, but much more pronounced. In the simulations two clear peaks are observed at 2425 cm−1 and 2350 cm−1, while small shoulders are observed on the blue side of the spectrum. In the experimental spectrum the first two mentioned peaks are observed at 2420 cm−1 and 2325 cm−1, respectively.27 In addition a clear peak is observed at 2480 cm−1 close to the shoulders observed in the simulation. Overall, the experimental linear absorption spectra as at 100 K22 are reproduced well by the theory with the largest discrepancy in the blue wing, where theory gives too low intensity both for H2O and D2O.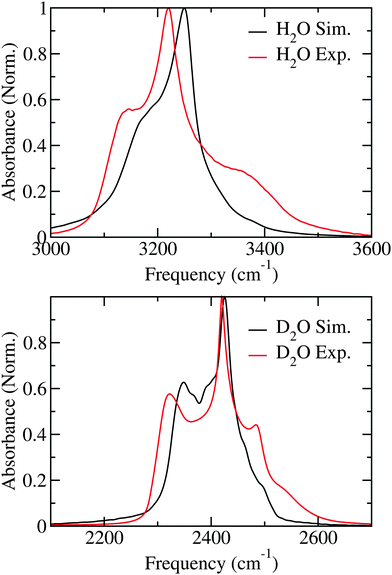 | ||
| Fig. 2 Simulated and experimental (from ref. 27) linear absorption spectra for H2O and D2O ice. | ||
In Fig. 3 the experimental27 and theoretical 2DIR spectra are presented for a number of different waiting times. Both the isotropic (SZZZZ + SZZXX + SZZYY) and the anisotropic components (SZZZZ − 0.5(SZZXX + SZZYY)) are presented. The shape of the isotropic spectra changes very little with time and is dominated by two vertically elongated bleach/stimulated emission peaks. These peaks correspond to the initial excitation in the range of the two main transitions and the subsequent detection of a bleach and stimulated emission from both these transitions. This indicates that excitations in these two regions communicate very rapidly with each other. For detection frequencies below 3100 cm−1 and above 3250 cm−1 excited state absorption is observed in the experimental spectra, while this is only detected at low frequencies in the simulation. This supports the conclusion that the high frequency excited state absorption has an origin from heating as the heating processes are not included in the simulations. In the anisotropic spectra a rapid decay of the signal is observed both in experiment and theory. Both lack the strong cross peaks between the two main transitions that are so prominent in the isotropic spectra, and only weak features may be recognised on close inspection. In the theoretical spectra the diagonal peak corresponding to the lowest frequency transition is much weaker than in experiment, while the high frequency peak persists longer.
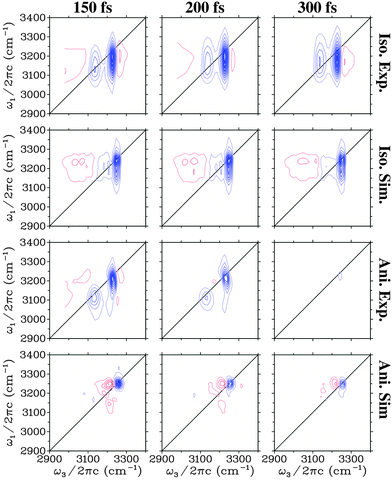 | ||
| Fig. 3 Simulated and experimental (from ref. 27) two-dimensional spectra for the H2O ice. Identical equidistant contours are used for all plots. Blue contour lines represent bleach signals, while red contour lines represent induced absorption. | ||
In Fig. 4 the 2DIR spectra are presented for D2O ice. In the isotropic spectra three vertical bleach/stimulated emission features are observed. At early times a fourth one is observed in the experiment above 2500 cm−1. These peaks correspond well with the peaks observed in the linear absorption and as for H2O clear cross peaks are observed in the isotropic signal. The excited state absorption peak below 2300 cm−1 is more pronounced than for H2O water and weak absorption features are observed between the other peaks. As for H2O the absorption feature growing in at 300 fs in the experiment is not present in the simulation confirming the origin as a heating process. The features in the anisotropic spectra are more complex than for H2O. The simulated peaks are narrower than the experimental ones. This may be related to the lifetime of 700 fs used here based on previous estimations,21,61 while recent experimental data suggested a lifetime of the OD-stretch as low as 480 fs.62 As the lifetime affects the anisotropies very little and the lifetime used in the simulations is mainly included as an apodization function30,63 to get smooth spectra we chose the lifetime used in the previous simulations of the absorption spectra.22 The two dominant bleach/stimulated emission peaks exhibit the same trend in theory and experiment that the high frequency one is narrower in particular along the detection axis than the low frequency peak.
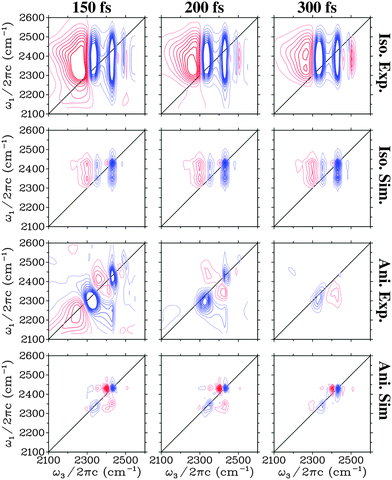 | ||
| Fig. 4 Simulated and experimental (from ref. 27) two-dimensional spectra for the D2O ice. Identical equidistant contours are used for all plots. Blue contour lines represent bleach signals, while red contour lines represent induced absorption. | ||
The anisotropy decay was calculated by setting t1 = t3 = 0, effectively providing the anisotropy decay of the integrated spectrum.33,64 In Fig. 5 this is presented showing that the anisotropy for D2O decay is slower than for H2O. The results are very similar to those previously reported for anisotropies for ice Ih at higher temperatures.65,66 However, it is in contrast with the experimental result extracted through an exponential fit at the position of the lower diagonal peak. As the calculations of the spectra are very expensive we only have data for three waiting times and a direct comparison by extracting points from these data would not give enough data for a reasonable comparison. From the experimental analysis exponential decay times of 85 fs and 65 fs were extracted for H2O and D2O, respectively.27 The experimental data are at least at short times also affected by the finite pulse duration of the laser pulses estimated to be 65 fs,27 resulting in large error bars on these numbers. The origin of this discrepancy is still unclear, and further experimental and theoretical works are required. While the simulated results are for the integrated total spectrum and the experimentally reported numbers are extracted from the low frequency diagonal peaks, the dependence of the timescale was reported to be rather independent for the location of extraction in the experiment.27 The theoretical time dependence of the anisotropy was found to be non-exponential and it was fitted to a sum of gaussian and exponential decays with a very small offset. The choice of this functional form is pragmatic as the initial time-dependence is parabolic, reflecting coherent dynamics.66 The fit parameters are provided in Table 1. The gaussian component dominates and is the slowest. The decay times are considerably faster than the 1/e time of 114 fs as reported for comparable simulations of water.33
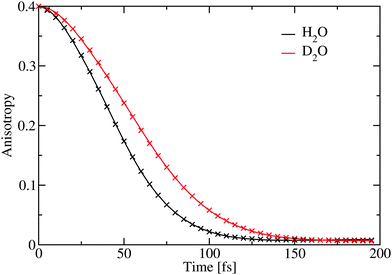 | ||
| Fig. 5 The simulated anisotropy decay averaged over the complete spectral range. The crosses represent the fit given in Table 1. | ||
| Site | A 1 | T 1 (fs) | A 2 | T 2 (fs) |
|---|---|---|---|---|
| H2O | 0.052 | 25.0 | 0.929 | 39.0 |
| D2O | 0.048 | 31.3 | 0.937 | 50.1 |
The population transfer was calculated in the site basis by averaging over all sites according to the formula
 | (2) |
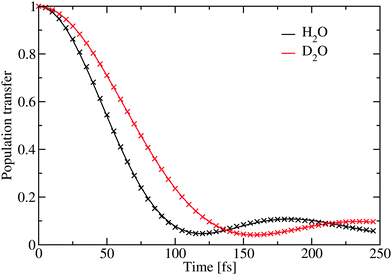 | ||
| Fig. 6 The simulated population transfer using eqn (2). The crosses represent the fit given in Table 2. | ||
| Site | B | τ 1 (fs) | τ 2 (fs) | τ 3 (fs) |
|---|---|---|---|---|
| H2O | 0.946 | 74.6 | 123.9 | 798.9 |
| D2O | 0.923 | 99.1 | 167.8 | 255.2 |
The inverse participation ratio70 was used to estimate the excitation delocalization size. Averaged over the complete OH-stretch band it was found to be 146 and 162 for H2O and D2O respectively. This is in good agreement with previous simulations of ice at 1 K,21 where a somewhat larger delocalization number of about 250 was reported for H2O. It should be noted that the delocalization number is strongly frequency dependent and as previously demonstrated it is significantly lower at the wings of the OH-stretch band and in a region in the middle, where the density of states is lower.21 In liquid H2O water the delocalization number is 12.71 The reported delocalization number is likely to be system size dependent as reported for the 1 K ice.21 However, it remains interesting that while the delocalization in D2O is larger than in H2O the calculated dynamics is slower. One explanation for these differences may be that the intramolecular coupling in D2O is significantly larger than in H2O.22 The extra delocalization in D2O may, thus, mainly be due to coherent delocalization inside the water molecules, which is not efficient in transferring the excitation through the hydrogen-bond network.
The lack of cross peaks in the anisotropic spectra can be explained by two possible scenarios. First, if the angle between the transition dipoles of the two involved excitation states is always equal to the magic angle (Θm = 54.7°) the cross peak should only appear in the isotropic response.30,51 The second possible explanation is that there is essentially no correlation between the direction of the two involved transition dipoles. In Fig. 7 the transition dipole weighted densities of states are presented. It is clear that one can roughly understand the infrared spectra by considering three regions. At low frequencies there is a shoulder on the IR (μ2) and 2DIR (μ4) weighted densities, which gives rise to the lowest frequency peak in the spectra. The main peak is in the middle of the spectra, while at the high frequency range the unweighted density of states is the highest. The high frequency states, however, have very small transition dipoles leading to the very weak spectral shoulder in this region. A more elaborate analysis of the states is previously presented.21,22 In Fig. 8 the IR weighted density of states is further separated in the components stemming from the components of the transition dipole in different directions of the unit cell. The difference between the different directions is quite small suggesting that there is little or no correlation between the directions of the transition dipoles for the different eigenstates and their location in the band. This unusual property likely stems from the fact that the hydrogen positions are disordered in the Ih structure. As the hydrogen positions do not switch during the simulation of the 432 water molecules, the 864 involved hydrogen positions represent a somewhat limited description of the hydrogen disorder in macroscopic ice Ih.
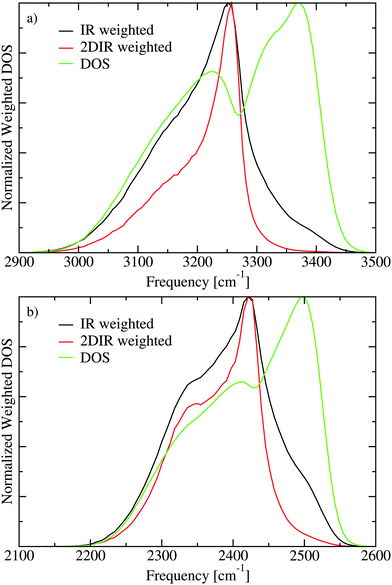 | ||
| Fig. 7 The densities of states (DOS) without weighting and including weights with the transition dipole squared (IR) and to the fourth power (2DIR) for H2O (a) and D2O (b). | ||
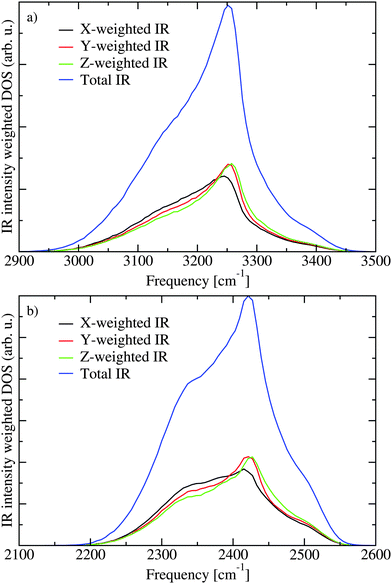 | ||
| Fig. 8 The contribution to the IR weighted density of states for transition dipole components along the three axes of the unit cell for H2O (a) and D2O (b). | ||
To examine the correlation between transition dipole directions the states with the largest transition dipole in the frequency regions corresponding to the low frequency shoulder (ω < 3200 cm−1 for H2O and ω < 2375 cm−1 for D2O), the high frequency shoulder (ω > 3300 cm−1 for H2O and ω > 2450 cm−1 for D2O), and the strong peak in the middle of the frequency range was identified for each snapshot along the trajectory. The angles between these transition dipoles of three states were determined for every 10th snapshot and histograms of these angles are presented in Fig. 9. The distribution of these angles are quite similar for H2O and D2O and little variation is seen for different combinations of frequency regions. For a completely isotropic distribution a sine dependence on the angle will be observed. The observed distributions are quite close to the isotropic one revealing the lack of correlation between the transition-dipole directions as the correct explanation for the lack of cross peaks in the anisotropic 2DIR spectrum. However, the cross peaks in the 2DIR spectra likely do not originate from the eigenstates with the largest transition dipoles only and the contribution from multiple other eigenstate combinations are likely contributing to the cross peaks in the anisotropic spectra as well.
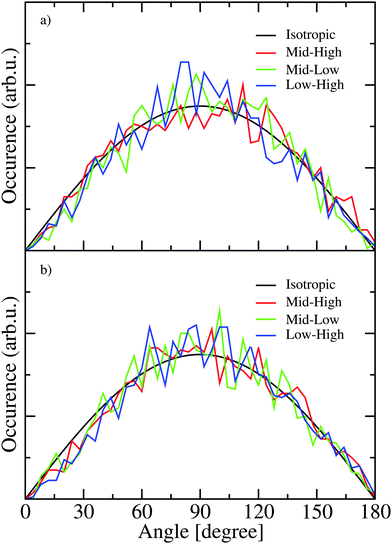 | ||
| Fig. 9 The distribution of the angles between the strongest transitions from three spectral regions in H2O (a) and D2O (b). | ||
The pulse duration in the experiment was 65 fs.27 Therefore, the experiments are insensitive to dynamics faster than this and one should be cautious drawing too strong conclusions on dynamical times close to the pulse duration. The quantum-classical simulation method does not account for the relaxation of the excitation out of the OH-stretch (OD-stretch) manifold and the heating resulting from this relaxation. Accounting for this relaxation is computationally expensive and was so far only achieved for very small system sizes.72 Another drawback of the employed method is that correct thermalization within the studied band is not achieved, which may affect the shape of the 2DIR spectra at long waiting times as the band width (including infrared dark states) is larger than kBT.73,74 Considering the significant delocalization number one can further expect that the limited simulation box size may have some effects on the simulated spectra. Finally, we did not include Fermi resonances between the stretch vibrations and the bend overtones, which is stronger in D2O than in H2O22 and may affect the spectra.
The reason for the lack of intensity on the high frequency side of the FTIR and 2DIR spectra is not clear and can have several reasons. For D2O it was argued that Fermi resonances contribute to the high frequency shoulder.22,24 However, the spectral region, where the shoulders are located has a high spectral density both for D2O and H2O (see Fig. 7), which may suggest that the intensity of these states is underestimated by the present model. This could be due to some of the assumptions made in the present study. For example, we assume that the transition dipole is always exactly along the OH bond,23,56 and we neglect nuclear quantum effects, which should be important for light nuclei as hydrogen and deuterium.75 Both for the high frequency librational degrees of freedom as well as the lower frequency translational degrees of freedom the classical approximation is not really well justified considering low temperature of the ice corresponding to about 56 cm−1, which is lower than the frequencies connected with these modes. We assume the transition-dipole coupling model for the intermolecular couplings, which may introduce discrepancies for hydrogen bonded pairs, where the distance between the oscillators become comparable in size to the vibrating OH bonds, and multipole corrections may be appropriate.24,76,77 Finally, if real ice is slightly less ordered than predicted by our MD simulations this would likely also result in more intensity in these high frequency modes. Further refinement of the model will, thus, be needed to explain the higher infrared intensity observed experimentally on the blue side of the main peak. Nonetheless, the current model is sufficient to explain the main features of the 2DIR spectra and in particular the polarization dependence in these.
4 Conclusions
In this paper, we presented the first quantum-classical simulations of the two-dimensional infrared spectra of H2O and D2O ice Ih. We found that using the recently developed E3B force field including three-body interactions, and the spectroscopic mapping approach, the key features of the two-dimensional infrared spectra are reproduced. In particular the presence of cross peaks in the isotropic spectra and their absence in the anisotropic spectra was confirmed in the spectral simulations. In contrast to the original experimental interpretation we conclude that the isotropic signal does contain excitonic cross-peaks on top of possible cross-peaks with a thermal origin. The reason that these peaks are essentially absent in the anisotropic signal is that the angle between dominant exciton states are almost isotropically distributed, which most likely is related to the fact that ice Ih is proton disordered. It was confirmed that the exciton dynamics in ice Ih is faster than the dynamics observed in liquid water. Furthermore, the simulations suggest that this relaxation is not exponential, reflecting coherent vibrational dynamics.Acknowledgements
The authors gratefully acknowledge the group of Prof. P. Hamm for sharing the experimental FTIR and 2DIR spectra and P. Hamm for helpful discussions. JLS and LS acknowledge the NSF for the support through the grant CHE-1058752.References
- E. A. Zheligovskaya and G. G. Malenkov, Russ. Chem. Rev., 2006, 75, 57–76 CrossRef CAS.
- H. F. Wilson, M. L. Wong and B. Militzer, Phys. Rev. Lett., 2013, 110, 151102 CrossRef PubMed.
- R. G. Fernández, J. L. F. Abascal and C. Vega, J. Chem. Phys., 2006, 124, 144506 CrossRef.
- J. L. F. Abascal, R. G. Fernández and C. Vega, J. Chem. Phys., 2005, 122, 234511 CrossRef CAS PubMed.
- J. L. F. Abascal and C. Vega, J. Chem. Phys., 2005, 123, 234505 CrossRef CAS.
- R. Kumar and J. L. Skinner, J. Phys. Chem. B, 2008, 112, 8311–8318 CrossRef CAS PubMed.
- C. Tainter, P. A. Pieniazek, Y.-S. Lin and J. L. Skinner, J. Chem. Phys., 2011, 134, 184501 CrossRef CAS PubMed.
- S. Gruenbaum, C. Tainter, L. Shi, Y. Ni and J. L. Skinner, J. Chem. Theory Comput., 2013, 9, 3109–3117 CrossRef CAS PubMed.
- L. Shi and J. L. Skinner, J. Chem. Phys., 2015, 143, 014503 CrossRef CAS PubMed.
- E. R. Batista, S. S. Xantheas and H. Jónnson, J. Chem. Phys., 1998, 109, 4546 CrossRef CAS.
- G. S. Fanourgakis and S. S. Xantheas, J. Chem. Phys., 2006, 124, 174504 CrossRef PubMed.
- C. Haas and D. F. Hornig, J. Chem. Phys., 1960, 32, 1763 CrossRef CAS.
- J. E. Bertie and E. Whalley, J. Chem. Phys., 1964, 40, 1637 CrossRef CAS.
- J. E. Bertie, H. Labbe and E. Whalley, J. Chem. Phys., 1969, 50, 4501 CrossRef CAS.
- E. Whalley, Can. J. Chem., 1977, 55, 3429 CrossRef CAS.
- J. R. Scherer and R. G. Snyder, J. Chem. Phys., 1977, 67, 4794 CrossRef CAS.
- M. S. Bergren, D. Schuh, M. G. Sceats and S. A. Rice, J. Chem. Phys., 1978, 69, 3477 CrossRef CAS.
- J. E. Bertie and E. Whalley, J. Chem. Phys., 1964, 40, 1646 CrossRef CAS.
- J. E. Bertie, H. Labbe and E. Whalley, J. Chem. Phys., 1968, 49, 2141 CrossRef CAS.
- J. E. Bertie and F. E. Bates, J. Chem. Phys., 1977, 67, 1511 CrossRef CAS.
- F. Li and J. L. Skinner, J. Chem. Phys., 2010, 133, 244504 CrossRef CAS PubMed.
- L. Shi, S. Gruenbaum and J. L. Skinner, J. Phys. Chem. B, 2012, 116, 13821–13830 CrossRef CAS PubMed.
- L. Shi and J. L. Skinner, J. Phys. Chem. B, 2013, 117, 15536–15544 CrossRef CAS PubMed.
- M. S. Bergren and S. A. Rice, J. Chem. Phys., 1982, 77, 583–602 CrossRef CAS.
- S. A. Rice, M. S. Bergren, A. C. Belch and G. Nielsen, J. Phys. Chem., 1983, 87, 4295–4308 CrossRef CAS.
- F. Perakis, S. Widmer and P. Hamm, J. Chem. Phys., 2011, 134, 204505 CrossRef PubMed.
- F. Perakis and P. Hamm, Phys. Chem. Chem. Phys., 2012, 14, 6250–6256 RSC.
- W. Humphrey, A. Dalke and K. Schulten, J. Mol. Graphics, 1996, 14, 33–38 CrossRef CAS PubMed.
- P. Hamm, M. H. Lim and R. M. Hochstrasser, J. Phys. Chem. B, 1998, 102, 6123–6138 CrossRef CAS.
- P. Hamm and M. T. Zanni, Concepts and Methods of 2D Infrared Spectroscopy, Cambridge University Press, Cambridge, 2011 Search PubMed.
- M. L. Cowan, B. D. Bruner, N. Huse, J. R. Dwyer, B. Chugh, E. T. J. Nibbering, T. Elsaesser and R. J. D. Miller, Nature, 2005, 434, 199–202 CrossRef CAS PubMed.
- A. Paarmann, T. Hayashi, S. Mukamel and R. J. D. Miller, J. Chem. Phys., 2009, 130, 204110 CrossRef CAS PubMed.
- T. L. C. Jansen, B. M. Auer, M. Yang and J. L. Skinner, J. Chem. Phys., 2010, 132, 224503 CrossRef CAS PubMed.
- K. Ramasesha, L. De Marco, A. Mandal and A. Tokmakoff, Nat. Chem., 2013, 5, 935–940 CrossRef CAS PubMed.
- R. A. Nicodemus, K. Ramasesha, S. T. Roberts and A. Tokmakoff, J. Phys. Chem. Lett., 2010, 1, 1068–1072 CrossRef CAS.
- C. J. Fecko, J. D. Eaves, J. J. Loparo, A. Tokmakoff and P. L. Geissler, Science, 2003, 301, 1698–1702 CrossRef CAS PubMed.
- J. B. Asbury, T. Steinel, C. Stromberg, K. J. Gaffney, I. R. Piletic, A. Goun and M. D. Fayer, Phys. Rev. Lett., 2003, 91, 237402 CrossRef PubMed.
- A. A. Bakulin, P. A. Pieniazek, J. L. Skinner, T. L. C. Jansen and M. S. Pshenichnikov, J. Phys. Chem. B, 2013, 117, 15545–15558 CrossRef CAS PubMed.
- H.-S. Tan, I. R. Piletic and M. D. Fayer, J. Chem. Phys., 2005, 122, 174501 CrossRef PubMed.
- I. R. Piletic, D. E. Moilanen, D. B. Spry, N. Levinger and M. D. Fayer, J. Phys. Chem. A, 2006, 110, 4985–4999 CrossRef CAS PubMed.
- D. Cringus, T. L. C. Jansen, M. S. Pshenichnikov and D. A. Wiersma, J. Chem. Phys., 2007, 127, 084507 CrossRef PubMed.
- T. L. C. Jansen, D. Cringus and M. S. Pshenichnikov, J. Phys. Chem. A, 2009, 113, 6260 CrossRef CAS PubMed.
- D. B. Wong, C. H. Giammanco, E. E. Fenn and M. D. Fayer, J. Phys. Chem. B, 2013, 117, 623–635 CrossRef CAS PubMed.
- A. Shalit, F. Perakis and P. Hamm, J. Phys. Chem. B, 2013, 117, 15512–15518 CrossRef CAS PubMed.
- A. Shalit, F. Perakis and P. Hamm, J. Chem. Phys., 2014, 140, 151102 CrossRef.
- C. Tainter, L. Shi and J. L. Skinner, J. Chem. Phys., 2014, 140, 134503 CrossRef CAS PubMed.
- F. Perakis and P. Hamm, J. Phys. Chem. B, 2011, 115, 5289–5293 CrossRef CAS PubMed.
- K. Lazonder, M. S. Pshenichnikov and D. A. Wiersma, Opt. Lett., 2006, 31, 3354–3356 CrossRef PubMed.
- S. T. Roberts, J. J. Loparo and A. Tokmakoff, J. Chem. Phys., 2006, 125, 084502 CrossRef PubMed.
- S. Roy, M. S. Pshenichnikov and T. L. C. Jansen, J. Phys. Chem. B, 2011, 115, 5431–5440 CrossRef CAS PubMed.
- O. Golonzka, M. Khalil, N. Demirdöven and A. Tokmakoff, J. Chem. Phys., 2001, 115, 10814 CrossRef CAS.
- T. L. C. Jansen and J. Knoester, Biophys. J., 2008, 94, 1818–1825 CrossRef PubMed.
- M. Ji and K. J. Gaffney, J. Chem. Phys., 2011, 134, 0445516 CrossRef PubMed.
- K. J. Gaffney, I. R. Piletic and M. D. Fayer, J. Chem. Phys., 2003, 118, 2270–2278 CrossRef CAS.
- S. Imoto, S. S. Xantheas and S. Saito, J. Chem. Phys., 2013, 139, 044503 CrossRef.
- B. M. Auer, R. Kumar, J. R. Schmidt and J. L. Skinner, Proc. Natl. Acad. Sci. U. S. A., 2007, 104, 14215–14220 CrossRef CAS PubMed.
- C. Liang and T. L. C. Jansen, J. Chem. Theory Comput., 2012, 8, 1706–1713 CrossRef CAS PubMed.
- T. L. C. Jansen and J. Knoester, J. Phys. Chem. B, 2006, 110, 22910–22916 CrossRef PubMed.
- T. L. C. Jansen and J. Knoester, Acc. Chem. Res., 2009, 42, 1405–1411 CrossRef CAS PubMed.
- H. Torii, J. Phys. Chem. A, 2006, 110, 4822 CrossRef CAS PubMed.
- F. Li and J. L. Skinner, J. Chem. Phys., 2010, 132, 204505 CrossRef CAS PubMed.
- W. J. Smit and H. J. Bakker, J. Chem. Phys., 2013, 139, 204504 CrossRef CAS PubMed.
- J. Kruiger, C. P. van der Vegte and T. L. C. Jansen, J. Chem. Phys., 2015, 142, 054201 CrossRef PubMed.
- Y.-S. Lin, P. A. Pieniazek, M. Yang and J. L. Skinner, J. Chem. Phys., 2010, 132, 174505 CrossRef PubMed.
- R. L. A. Timmer and H. J. Bakker, J. Phys. Chem. A, 2010, 114, 4148–4155 CrossRef CAS PubMed.
- L. Shi, F. Li and J. L. Skinner, J. Chem. Phys., 2014, 140, 244503 CrossRef CAS PubMed.
- M. Yang, F. Li and J. L. Skinner, J. Chem. Phys., 2011, 135, 164505 CrossRef.
- J. A. Poulsen, G. Nyman and S. Nordholm, J. Phys. Chem. A, 2003, 107, 8420–8428 CrossRef CAS.
- C. Bäcktorp, J. A. Poulsen and G. Nyman, J. Phys. Chem. A, 2005, 109, 3105 CrossRef PubMed.
- D. J. Thouless, Phys. Rep., 1974, 13, 93 CrossRef.
- B. M. Auer and J. L. Skinner, J. Chem. Phys., 2008, 128, 224511 CrossRef CAS PubMed.
- P. L. McRobbie, G. Hanna, Q. Shi and E. Geva, Acc. Chem. Res., 2009, 42, 1299–1309 CrossRef CAS PubMed.
- C. P. van der Vegte, A. G. Dijkstra, J. Knoester and T. L. C. Jansen, J. Phys. Chem. A, 2013, 117, 5970–5980 CrossRef CAS PubMed.
- C. P. van der Vegte, S. Knop, P. Vöhringer, J. Knoester and T. L. C. Jansen, J. Phys. Chem. B, 2014, 118, 6256–6264 CrossRef CAS PubMed.
- C. Herrero and R. Ramirez, J. Chem. Phys., 2011, 134, 094510 CrossRef PubMed.
- V. Buch and J. P. Devlin, J. Chem. Phys., 1999, 110, 3437–3443 CrossRef CAS.
- M. J. Wojcik, K. Szczeponek and S. Ikeda, J. Chem. Phys., 2002, 117, 9850–9857 CrossRef CAS.
Footnote |
| † The H2O FTIR spectrum presented in ref. 27 was obtained under slightly saturated conditions. The spectrum presented here was provided by the authors of ref. 27, does not suffer from this artefact, and agrees well with previous studies as ref. 13 and 14. |
| This journal is © the Owner Societies 2016 |


