Path-dependent variational effects and multidimensional tunneling in multi-path variational transition state theory: rate constants calculated for the reactions of HO2 with tert-butanol by including all 46 paths for abstraction at C and all six paths for abstraction at O†
Received
27th September 2015
, Accepted 18th November 2015
First published on 23rd November 2015
Abstract
Multi-path variational transition state theory (MP-VTST) provides a conformationally complete framework for calculating gas-phase rate constants. For reactions in which the transition state has distinguishable torsional minima (which include most reactions), there are multiple possible reaction paths. In principle MP-VTST includes the contributions from all the reaction paths, and it should explicitly treat the variational and tunneling effects of each path, but in practice one may need to truncate the number of paths included in MP-VTST calculations in order to achieve a balance between computational cost and accuracy. In this work, we present calculations including all paths for two prototype combustion reactions, namely the two hydrogen abstraction reactions from tert-butanol by HO2 radical. For both reactions we included all the reaction paths. Since abstraction at C has 46 paths, it provided a good opportunity to carry out a case study in which we investigated the errors introduced by truncating the number of paths. For the reaction studied, we found that the variational and multidimensional tunneling transmission coefficients are very different for different reaction paths, which provides new evidence that MP-VTST is necessary for treating path-dependent variational effects and multidimensional tunneling. We found that tunneling transmission coefficients can be much larger for higher-energy paths than for lower-energy ones. Interestingly, the simple hypothesis that higher barriers are narrower does not explain this finding in the present case; we found instead that the effect is due to higher-energy barriers having the possibility of tunneling at energies farther below the barrier top. We also show that a previously applied criterion for judging convergence with respect to the number of paths may not be reliable at low temperature.
1. Introduction
The recently developed multi-path variational transition state theory1,2 (MP-VTST) provides a framework for taking account of all reactant and transition state conformations and all conformationally different reaction paths for calculating thermal rate constants and predicting experimentally unavailable branching ratios for complex reactants. It should be especially useful in combustion chemistry, atmospheric chemistry, and all problems involving reactions of chain molecules. MP-VTST is an extension of multi-structural variational transition state theory3 (MS-VTST), which has now been used to study the chemical kinetics of a variety of chemically important systems, including hydrogen abstraction reactions in combustion of biofuels4–8 and silyl anion–silane polymerization reactions in nanodusty plasma chemistry.9
The internal rotations (torsions) of a molecule can lead to multiple conformational structures, i.e., multiple local minima (for reactants and products) or multiple first-order saddle points (for transition structures) on the potential energy surface, and therefore multiple reaction paths. The contributions from all the reaction paths that correspond to the same chemical reaction are included in the MP-VTST calculations, and the variational effect and quantum tunneling contribution of each path is treated explicitly in MP-VTST. In principle, all the reaction paths should be included in the calculations, and one should perform variational transition state theory calculations with multi-dimensional tunneling calculations for all the paths. Such a calculation can be based on minimum-energy paths (MEPs) generated by direct dynamics. Practically, however, the computational cost for such calculations, which involve calculating the energies, gradients, and generalized normal mode analyses at large numbers of points along each reaction coordinate, can be demanding. Although density functional theory can greatly accelerate such calculations as compared to reliable wave-function-based calculations, it is often unaffordable to accurately calculate all the reaction paths, which are generated from multiple conformers of the transition state, even for a medium-sized transition state (for instance, the transition state for hydrogen abstraction reaction from C-3 of 1-butanol by HO2 radical consists of 262 distinguishable conformers10).
In our previous work,4,8 the number of paths included in MP-VTST was decided by ordering the paths in order of increasing barrier height and comparing calculations averaged over the first P paths and averaged over the first P − 1 paths (or P and P − 2 paths if the paths come in optically active pairs), and if the computed final rate constants have no significant differences (for instance, if the relative difference is smaller than 15%), then we stopped including more reaction paths. For a given reaction, it would be tempting to assume that various reaction paths are similar to each other except for the quantitative energetics, in which case this would be a reasonably reliable method. However, this is a dangerous assumption. In the current work, we will confirm that this kind of agreement does not necessarily mean that the MP-VTST rate constant has been converged using the first P paths because the transmission coefficients can be very different for different paths.
Hydrogen abstractions by small radicals (such as H, O, OH, HO2, and CH3) are a class of important reactions in the combustion mechanisms of common fuels.11,12 In Sarathy and co-workers' work,11 rate constants for HO2 + tert-butanol H-abstraction reaction are theoretically computed based on Evans–Polanyi approach, which not only ignores the temperature-dependence of the activation energy but also assumes a perfect correlation between bond energy and barrier height. Ab initio variational transition state calculations are needed in order to more accurately predict the thermal rate constants. In this work, we choose the tert-butanol + HO2 reaction to study the effect of truncating the number of paths included in MP-VTST calculations, and we use the MP-VTST rate constants calculated based on all reaction paths as a reference. To be more specific, the reactions we consider here are:
| | | (CH3)3COH + HO2˙ → CH2˙(CH3)2COH + H2O2 | (R1) |
| | | (CH3)3COH + HO2˙ → (CH3)3CO˙ + H2O2 | (R2) |
Reaction (R1) has 46 reaction paths (23 pairs of mirror images), and (
R2) has 6 paths (3 pairs of mirror images). (
R1) is the reaction of major interest in the current work since it provides a large number of reaction paths and also because it has a larger rate constant than
reaction (R2).
2. Theory
The thermal rate constant in multi-path variational transition state theory is given by1,2| | | kMP-VTST = FMS-Tact〈γ〉PkConTST1 | (1) |
where kConTST1 is the rate constant computed by conventional transition state theory (ConTST) without tunneling using the lowest-energy transition structure, FMS-Tact is the multi-structural torsional anharmonicity factor of activation, which is defined as:| |  | (2) |
where MS-R1, MS-R2, and MS-ConTS denote the multi-structural reactant 1, the multi-structural reactant 2, and the multi-structural conventional transition state, and GM denotes “global minimum”; QMS-T is the multi-structure (MS) conformational-rovibrational partition function with torsional anharmonicity (T) computed based on a coupled torsional potential;13 and QSS-QH is the rovibrational partition function computed using the rigid-rotator–quasiharmonic-oscillator approximation based on a global minimum structure. When we say GM for a transition state we mean the lowest-energy first-order saddle point that connects reactants to products, i.e., the lowest-energy transition structure. Note also that a “transition state” is a dividing surface that passes through all the transition state structures, and the MS-ConTS is a dividing surface that passes through all the saddle points, which are also called transition structures. In a full calculation, FMS-Tact includes the contributions from all the conformational structures, i.e., there is no truncation error introduced by limiting the sums of structures.
The variational effect and multidimensional tunneling (MT) contributions of each reaction path are explicitly treated using the path-averaged generalized transmission coefficient:
| |  | (3) |
where the subscript
p denotes the index of a reaction path;
P denotes the total number of reaction paths included in MP-VTST;
Q‡-SS-Tp is the single-structural rovibrational partition function with torsional anharmonicity of the transition structure of path
p;
ΓCVTp is the variational recrossing transmission coefficient computed for path
p; and
κMTp is the multidimensional tunneling transmission coefficient of path
p. The factor
κMTp is equal to the ratio
kCVT/MTp/
kCVTp, where CVT/MT refers to the CVT rate constant including multidimensional tunneling. We should emphasize that the multidimensional tunneling transmission coefficient not only includes the effect of quantum mechanical tunneling (which increases the rate constant, especially at lower temperatures and for light particles), but also includes the contribution from nonclassical reflection (which decreases the rate constant) at energies above the barrier height. Thus a better technical name for
κMTp would be the transmission coefficient that accounts for quantum mechanical effects on reaction coordinate motion, including its coupling to other degrees of freedom, but we call it tunneling transmission coefficient for brevity.
The multidimensional tunneling transmission coefficient is evaluated with the small-curvature tunneling approximation14 (SCT) in the current work, but a few results are shown for the zero-curvature tunneling (ZCT) approximation15–17 for comparison. In the ZCT approximation, the system tunnels through the vibrationally adiabatic ground-state potential curve defined for path p by
| | | VGa,p (s) = VMEP,p(s) + ε0,p(s) | (4) |
where
s is the signed distance (from the saddle point) along the MEP through mass-scaled coordinates with reduced mass
μ,
VMEP,p(
s) is the potential energy along MEP
p, and
ε0,p(
s) is the local zero-point vibrational energy of modes transverse to this MEP. The vibrationally adiabatic ground-state potential curve is sometimes called the effective barrier for tunneling. In the SCT approximation, the tunneling is again governed by
VGa,p (
s), but

in the imaginary action integral (see next equation) is reduced to account for the shortening of the tunneling path by corner cutting in the small-curvature limit.
14,17 In practice, this reduction is accomplished by replacing
μ by
μeff,p(
s) <
μ, where
μeff,p(
s) depends on the reaction-path curvature at
s. Then the SCT tunneling probability at energy
E is
| |  | (5) |
where ℏ is Planck's constant divided by 2π,
s< is the turning point where
VGa,p(
s) =
E on the left side of the maximum, and
s< is the turning point where
VGa,p(
s) =
E on the right side of the maximum.
In eqn (3), P is formally equal to the total number of distinguishable reaction paths (including paths that are mirror images), which is equal to the number N of distinguishable structures of the transition state (TS). Practically, due to the existence of a large number of reaction paths, we often have to limit the number of paths included in MP-VTST calculation by taking P < N. Notice that, if P = N, the denominator of eqn (3) is equal to QMS-TTS; and if P < N, and this introduces truncation errors. The possible sources of errors introduced in the final calculated rate constant are complex to analyze. In the present work, we focus on the errors introduced by truncating the number of reaction paths in MP-VTST calculations, regardless of other factors such as the accuracy of electronic structure calculations or the accuracy with which anharmonicity is treated.
3. Computational details
An exhaustive conformational search was carried out for reactant, product, and transition structures by using M08-HX18/MG3S19 for the electronic structure and MSTor20 for the vibrational anharmonicity and vibration-rotation coupling. In order to choose a reasonably accurate electronic structure method for carrying out VTST calculations, classical barrier heights for both forward and reverse reactions (V‡f and V‡r), and energy of reaction (ΔE) were computed based on the lowest-energy structures. (Classical barrier heights and energies of reaction are difference in Born–Oppenheimer energies for stationary structures; they do not include vibrational zero-point energy or thermal energy.) Four hybrid density functionals, M05,21 M06-2X,22,23 M08-HX,18 and M08-SO,18 were used, combined with MG3S19 and ma-TZVP24 basis sets. The explicitly correlated coupled cluster theory CCSD(T)-F12a25–27 with the jun-cc-pVTZ basis28 was chosen as the benchmark. All the DFT calculations were performed with integration grids of 99 radial shells and 974 angular points per shell using a locally modified Gaussian 0929,30 program; coupled cluster calculations were carried out with Molpro201031 software.
Based on the benchmark results discussed below, M08-HX/MG3S was used for VTST calculations. Canonical variational transition state theory calculations were carried out in nonredundant internal coordinates32,33 by using the Gaussrate34 and Polyrate35,36 programs. Multidimensional tunneling transmission coefficients were computed based on the small-curvature tunneling approximation and reaction paths extending from s = −2.0 to +2.0 bohr, where s is the reaction coordinate taken as the distance from the saddle point along the isoinertial minimum-energy path scaled to a reduced mass of 1 amu. In calculating the rovibrational partition functions and performing generalized normal mode analysis, all the vibrational frequencies are scaled with a factor of 0.973.37
4. Results and discussion
Benchmarking density functionals
We will judge the accuracy of density functionals for the present reactions by estimating errors as the differences of their predictions of classical barrier heights and classical energies of reaction at stationary-point geometries optimized by M08-HX/MG3S to the results obtained by CCSD(T)-F12a/jun-cc-pVTZ with the same geometries. A classical barrier height is the difference in potential energy between the lowest-energy saddle point (of the transition state) and the lowest-energy structure of reactants (forward barrier height) or the products (reverse barrier height); it is the main determinant of the magnitude of the rate constant. A classical energy of reaction is the difference in potential energy between the lowest-energy structure of the products and the lowest-energy structure of the reactants; it is the main component of the free energy of reaction, which is related to the chemical equilibrium constant, that connects the forward and reverse rate constants according to the principle of detailed balance. Classical barrier heights and energies of reaction computed by various density functionals for reactions (R1) and (R2) are tabulated in Table S1 (tables labeled with “S” are in the ESI†). Forward barrier height V‡f, reverse barrier height V‡r, and energy of reaction ΔE are not independent because they are connected by the relation V‡f − V‡r = ΔE. One may argue that for some purposes it is reasonable to compute mean unsigned errors (MUEs) based only on forward barrier heights and energies of reaction, rather than based on all three of them, whereas for other purposes it is appropriate to consider all three. Therefore we report two kinds of MUEs in Fig. 1: MUE(6) includes both forward barrier heights, both reverse barrier heights, and both energies of reaction; MUE(4) only includes forward barriers and energies of reaction. MUE(6) and MUE(4) differs less than 0.4 kcal mol−1 in all the cases, and the use of either error criterion leads to similar conclusions about the relative accuracies of the method. The numerical results for the three most accurate of the eight methods tested are shown in Table 1. Among the model chemistries we tested, M08-HX/MG3S has the smallest MUEs (0.6 kcal mol−1) and therefore is chosen for rate constant calculations.
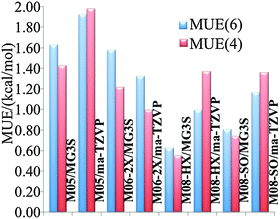 |
| | Fig. 1 Mean unsigned errors (MUEs) in kcal mol−1 computed based on M08-HX/MG3S geometries using various methods, with respect to CCSD(T)-F12a/jun-cc-pVTZ as benchmark. | |
Table 1 Classical barrier height for forward and reverse reaction and classical energy of reaction (kcal mol−1) computed by various model chemistries. Single-point calculations were carried out based on the lowest-energy-structures optimized at M08-HX/MG3S level of theory
| Model chemistries |
R1
|
R2
|
|
V
‡f
|
V
‡r
|
ΔE |
V
‡f
|
V
‡r
|
ΔE |
| M06-2X/ma-TZVP |
19.9 |
2.5 |
17.3 |
21.2 |
1.0 |
20.2 |
| M08-HX/MG3S |
20.6 |
3.5 |
17.1 |
23.1 |
2.5 |
20.5 |
| M08-SO/MG3S |
21.0 |
4.2 |
16.7 |
22.5 |
1.8 |
20.7 |
| CCSD(T)-F12a/jun-cc-pVTZ |
20.2 |
4.1 |
16.2 |
23.4 |
3.4 |
20.0 |
Multi-structural anharmonicity factors, rate constants, and branching fractions
The FMS-Tact factors computed by M08-HX/MG3S are given for 12 temperatures in Table S2 (ESI†) and for six temperatures in Table 2. Computed MP-CVT/SCT rate constants for the forward and reverse reactions of (R1) and (R2) are given at 12 temperatures in Table S3 (ESI†) and for six temperatures in Table 3. The rate constants are fitted for 200–2400 K by the four-parameter functions proposed previously.2,38 The final values of the forward rate constants (in units of cm3 molecule−1 s−1) are given by the fits as| |  | (6) |
| |  | (7) |
| |  | (8) |
where R is the gas constant in kcal mol−1, and T is temperature. The complete set of fitting parameters for both forward and reverse reactions are in Table S4 (ESI†).
Table 2
F
MS-Tact factors computed by M08-HX/MG3S at various temperatures for (R1) and (R2) in the forward and reverse directions
|
T/K |
R1
|
R2
|
|
F
MS-Tact, fwd
|
F
MS-Tact, rev
|
F
MS-Tact, fwd
|
F
MS-Tact, rev
|
| 200 |
1.8 |
0.43 |
1.8 |
0.95 |
| 298.15 |
2.5 |
0.47 |
1.9 |
1.00 |
| 600 |
6.0 |
0.96 |
2.3 |
1.1 |
| 1000 |
10.9 |
1.6 |
2.8 |
1.3 |
| 1500 |
15.4 |
2.4 |
3.0 |
1.4 |
| 2400 |
19.7 |
3.4 |
3.0 |
1.3 |
Table 3 MP-CVT/SCT rate constants (cm3 molecule−1 s−1) including all the paths for forward and reverse reactions of (R1) and (R2) at selected temperatures (K)
|
T/K |
R1
|
R2
|
|
k
MP-CVT/SCTfwd
|
k
MP-CVT/SCTrev
|
k
MP-CVT/SCTfwd
|
k
MP-CVT/SCTrev
|
| 200 |
4.85 × 10⁻³³ |
1.11 × 10⁻¹⁶ |
1.02 × 10−36 |
2.50 × 10⁻¹⁵ |
| 298.15 |
4.87 × 10⁻²⁷ |
1.34 × 10⁻¹⁶ |
2.86 × 10⁻²⁹ |
3.88 × 10⁻¹⁵ |
| 600 |
3.55 × 10⁻²⁰ |
5.48 × 10⁻¹⁶ |
2.76 × 10⁻²¹ |
1.17 × 10⁻¹⁴ |
| 1000 |
6.97 × 10⁻¹⁷ |
3.03 × 10⁻¹⁵ |
1.06 × 10⁻¹⁷ |
4.44 × 10⁻¹⁴ |
| 1500 |
6.00 × 10⁻¹⁵ |
1.41 × 10⁻¹⁴ |
1.13 × 10⁻¹⁵ |
1.50 × 10⁻¹³ |
| 2400 |
2.96 × 10⁻¹³ |
8.37 × 10⁻¹⁴ |
6.38 × 10⁻¹⁴ |
6.31 × 10⁻¹³ |
Branching fractions into the two possible products are shown in Fig. 2. We see that the yield of product R2 increases from a very small number at low temperature to about 20% at high temperature.
Activation energies and phenomenological Gibbs free energies of activation
Fig. 3 shows temperature-dependent Tolman activation energies, defined by39| |  | (9) |
The derivatives were computed analytically from the fits (see Table S4, ESI†). We see that, over the temperature range studied, the activation energy increases by ∼25 kcal mol−1 for reaction (R1) and by ∼15 kcal mol−1 for reaction (R2). This temperature-dependence of activation energy is significant and should not be ignored in theoretical combustion modeling. Since reaction (R1) dominates the overall reaction, the results for the overall reaction are very close to those for reaction (R1).
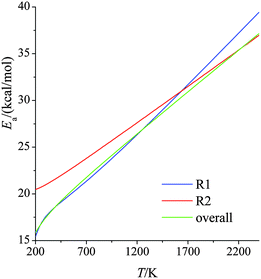 |
| | Fig. 3 Activation energies (kcal mol−1) for forward reactions (R1) and (R2) and the overall reaction at various temperatures. | |
Fig. S1 (ESI†) shows phenomenological Gibbs free energies of activation, which are given for bimolecular gas-phase reactions by40,41
| |  | (10) |
where
kB and
h are the Boltzmann and Planck constants,
kMP-CVT/SCTfwd is in the units of m
3 molecule
−1 s
−1, and
p0 is the standard-state pressure (10
5 Pa). As for the activation energy, the result is a rapidly increasing function of temperature.
Path-dependent variational effects
The variational transition states are slightly away from the saddle points. For example, numbering the paths in order of increasing classical barrier height, we find that at 200 K, the canonical variational generalized transition state is 0.002, 0.012, 0.009 Å away from the saddle point for paths 1, 41, and 45, respectively; at 600 K, they are 0.003, 0.023, 0.013 Å away from the saddle points for these paths; and at 2400 K, they are 0.008, 0.081, and 0.039 Å away from the saddle points for these paths.
Fig. 4 shows the computed CVT variational recrossing transmission coefficients of reaction (R1) for temperatures from 200 K to 2400 K for paths 1, 7, and 41 (the results for paths 2, 8, and 42 are the same as for 1, 7, and 41 because the paths come in enantiomeric pairs). Over the entire temperature range, the variational recrossing effect is negligible for path 1, for which the recrossing transmission coefficient varies from 0.998 at 200 K to 0.996 at 2400 K. For reaction path 7, which emanates from a transition structure 0.97 kcal mol−1 higher than that generating path 1, the behavior is significantly different from that for path 1. Variational recrossing transmission coefficients of path 7 increase from 0.913 at 200 K to a maximum 0.941 at 600 K and then gradually decrease to 0.930 at 1500 K, followed by a rapid decrease to 0.750 at 2400 K. For reaction path 41, there is an almost linear decrease of the variational recrossing transmission coefficient with temperature from 250 to 2400 K. At 2400 K, the variational transmission coefficient for the lowest-energy path is larger than the one for path 41 by a factor of 1.4.
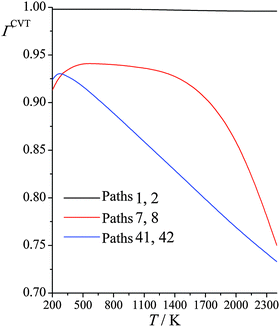 |
| | Fig. 4 Calculated CVT variational transmission coefficients at various temperatures (K) for different paths for reaction (R1): (CH3)3COH + HO2˙ → CH2˙(CH3)2COH + H2O2. | |
Multidimensional tunneling
Fig. 5 shows the SCT tunneling transmission coefficients for all the reaction paths of R1 at 200 K and 1000 K. At 200 K the tunneling transmission coefficients increase dramatically as the barrier heights increase; the tunneling transmission coefficients of the highest-energy paths are very much larger than the ones of the lowest-energy path, with the largest ratio being 17 and several other ratios being in the 9–12 range. As expected, the tunneling transmission coefficients are much closer to unity at 1000 K, because the Boltzmann factor for overbarrier reaction is much larger, but perhaps not so expected is the finding that the tunneling transmission coefficients cluster close to one another – with an average value of 1.35 and a standard deviation of only 0.04.
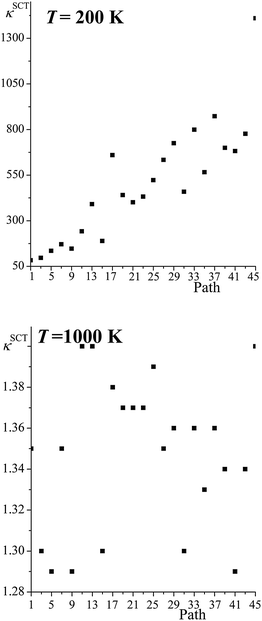 |
| | Fig. 5 SCT transmission coefficient of all the paths for reaction (R1) computed at 200 K and 1000 K. The abscissa is the ordinal number of the path. The paths are numbered 1–46 in order of increasing classical barrier height, but because the paths come in enantiomeric pairs, we only give the results for odd-numbered paths. | |
We may now ask: why are the tunneling transmission coefficients larger for the paths with higher classical heights? The answer to this question will illuminate an interesting feature of the way that tunneling effects enter a multi-path calculation. In order to give this answer we need to consider some aspects of the tunneling in more detail, and we now turn to this.
Fig. 6 shows both the ZCT and SCT tunneling transmission probabilities of various paths of reaction (R1) as functions of tunneling energy; the figure includes the lowest- and highest-energy paths and some intermediate-energy paths. SCT tunneling transmission probabilities are greater than ZCT ones because reaction-path curvature increases the tunneling probability by allowing corner cutting. The zero of energy for the tunneling calculations is the potential energy of the equilibrium structure of reactants. For each path the semiclassical tunneling probability rises approximately exponentially with energy until it reaches 0.5 at the energy of the maximum of VGa,p(s) for that path; this maximum is called VAGa,p, and it is usually higher for paths with a higher ordinal number, i.e., for paths with a higher classical barrier height.
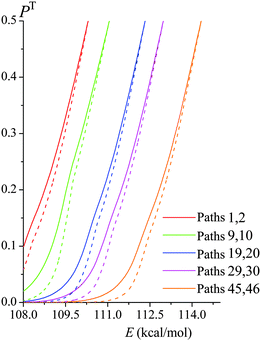 |
| | Fig. 6 SCT transmission probabilities PSCT(E) (solid lines) and ZCT transmission probabilities PZCT(E) (dashed lines) in the tunneling regime of various paths of reaction (R1). Note that each conformer of the transition state generates its own reaction path, and so each curve in this figure corresponds to a different reaction path. They are labeled with two path numbers because transition state structures that are mirror images generate paths that are mirror images and therefore have the same transmission coefficient. | |
The VGa,p(s) curves for reaction for path 1 (which, along with its mirror image, path 2, is the lowest-energy path), for path 41, and for path 45 (which, along with its mirror image, path 46, is the highest-energy path) are shown in Fig. 7, and the potential energies along the minimum energy paths (MEPs through the isoinertial coordinate system, which are sometimes called IRCs (intrinsic reaction coordinates)) for these three reaction paths are shown in Fig. 8. Fig. 9 shows the forming O–H bond distance as a function of the breaking C–H bond distance along the MEPs for paths 1, 41, and 45. The MEPs are very similar for these two critical bond distances, but the shapes of the vibrationally adiabatic potential energy curves are different because of the variations of the zero-point vibrational energy along the reaction paths. We see that VGa,p(s) peaks close to, but not precisely at s = 0, which, by convention, is placed at the saddle point, which is the maximum of VMEP(s).
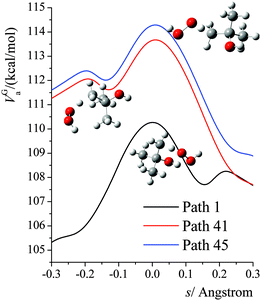 |
| | Fig. 7 Vibrationally adiabatic potential energy (in kcal mol−1) along the minimum energy paths (MEP) for paths 1, 41, 45 of reaction (R1), where s is the signed distance from the saddle point (i.e., transition structure) along each curved MEP in isoinertial coordinates scaled to a reduced mass of 1 amu. Note that each conformer of the transition state generates its own reaction path, and so each curve in this figure corresponds to a different reaction path, where the paths are shown in Fig. 9. The transition structures are shown next to the vibrationally adiabatic ground-state potential energy curve for the path they generate. | |
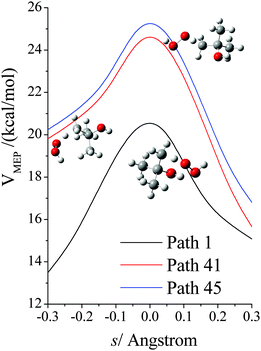 |
| | Fig. 8 Potential energy (in kcal mol−1) along the minimum energy path (MEP) for paths 1, 41, 45 of reaction (R1), where s is the signed distance from the saddle point (i.e., transition structure) along the curved MEP in isoinertial coordinates scaled to a reduced mass of 1 amu. Note that each conformer of the transition state generates its own reaction path, and so each curve in this figure corresponds to a different reaction path, where the paths are shown in Fig. 9. The transition structures are shown next to the vibrationally adiabatic ground-state potential energy curve for the path they generate. | |
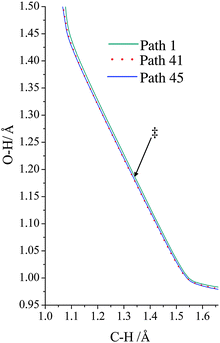 |
| | Fig. 9 Minimum energy path for paths 1, 41, and 45, where we show the breaking C–H bond distance and the forming H–O bond distance. Note that all three paths are shown, but as far the forming and breaking bond distances are concerned, the paths are so similar as to be hard to distinguish on the plot. The locations of the transition structures along the paths are similar for the three paths and are indicated by ‡. | |
The semiclassical tunneling transmission coefficient for path p is given by
| |  | (11) |
where
E0 is the maximum of the ground-state vibrational energy of reactants and the ground-state vibrational energy of products (this is the lowest energy at which reaction can occur), Prob
p(
E) is the transmission probability of
eqn (5), and Prob
Cp(
E) is the classical transmission probability along path
p at energy
E. Since the classical transmission probability is a unit step function at
E =
VAGa, we can carry out the integral in the denominator, which yields
| |  | (12) |
the combination of
eqn (5) and (12) shows that the different
κp for various paths may result from different effective reduced masses or different
VGa,p(
s). However, since the higher-energy paths also have larger transmission coefficients in the ZCT approximation, and the reduced masses are all the same in the SCT approximation, we look to the shape of the
VGa,p(
s) for an explanation.
The energy at which the integrand of eqn (12) peaks is called the representative tunneling energy,  ; some examples (in the SCT approximation) are shown in Table 4. Table 4 shows that representative tunneling energies are 2.6–5.2 kcal mol−1 below the effective barrier maxima. A simple hypothesis might be that the higher-energy paths show larger tunneling transmission coefficients because the effective barriers are thinner near their tops. However, examination of the VGa,p(s) curves shows that, in this energy range, these curves have about the same widths (see Table S7, ESI†). Consistent with this, Table 4 shows that the tunneling probabilities are about the same for all paths at energies 2 to 3 kcal mol−1 below the maximum of the effective potential energy curve for tunneling. So this hypothesis does not explain the observation of larger tunneling transmission coefficients for the higher-energy paths.
Table 4 SCT representative tunneling energies at 200 K, energies of the maxima of the vibrationally adiabatic ground-state potential curves, and SCT transmission probabilities at energies 2 and 3 kcal/mol lower than VAGa,p for various paths of reaction (R1)
| Path |
E
rep,p (200 K) (kcal mol−1) |
V
AGa,p (kcal mol−1) |
ProbSCTp![[thin space (1/6-em)]](https://www.rsc.org/images/entities/char_2009.gif) a a |
ProbSCTp![[thin space (1/6-em)]](https://www.rsc.org/images/entities/char_2009.gif) b b |
|
Evaluated at an energy 2 kcal mol−1 below VGa,p(s).
Evaluated at an energy 3 kcal mol−1 below VGa,p(s).
|
| 1 |
107.67 |
110.31 |
0.14 |
— |
| 9 |
107.67 |
111.06 |
0.11 |
0.022 |
| 19 |
107.67 |
112.33 |
0.12 |
0.024 |
| 29 |
108.11 |
112.98 |
0.12 |
0.029 |
| 41 |
109.03 |
113.72 |
0.12 |
0.022 |
| 45 |
109.14 |
114.33 |
0.13 |
0.030 |
We plot the integrand of eqn (12) for the SCT tunneling approximation at 200 K in Fig. 10 for various paths of reaction (R1). The curves in this figure start at an energy of 107.7 kcal mol−1 because that is the energy of the lowest-energy state of the products (i.e. CH2˙(CH3)2COH radical and H2O2) of this endothermic reaction (the zero of energy is the potential energy of separated reactants at their equilibrium geometries; on this scale the potential energy of products is 17.1 kcal mol−1, and their zero-point energy is 90.6 kcal mol−1). The argument of the exponential suggests that it would be instructive to replot the results in Fig. 10 as functions of E−VAGa,p, and this is done in Fig. 11. Fig. 11 shows that the curves are very similar as functions of this variable, but curves extend lower for the higher-energy curves, giving more area under the curve. The reason for this is that the curves stop at 107.1 kcal mol−1, as explained in the previous paragraph. Since eqn (12) shows that the area under the curve is proportional to the tunneling transmission coefficient, we see that the reason that higher-energy paths have larger tunneling transmission coefficients is that they can tunnel at energies farther below the maximum of the effective barrier for tunneling. Thus, for an endothermic reaction, the higher-energy paths have more to gain by tunneling because they can tunnel at energies farther below the barrier top.
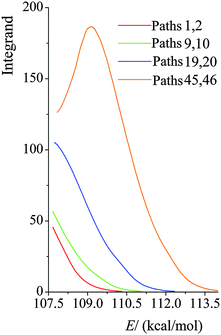 |
| | Fig. 10 Values of the integrand in eqn (12) at 200 K for various paths of reaction (R1) as functions of total energy E, with the zero of energy at the overall zero of energy, which is taken as the energy of the equilibrium structure of reactants. | |
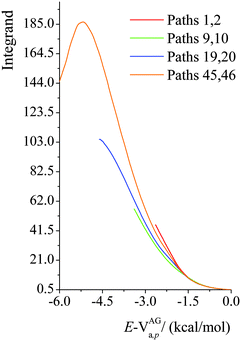 |
| | Fig. 11 Values of the integrand in eqn (12) as functions of E − VAGa,p at 200 K for various paths of reaction (R1). | |
Truncation of number of paths included in MP-VTST
The number of paths included in MP-VTST affects the values of the generalized transmission coefficients 〈γ〉P. Unsigned percentage errors as compared to using all N paths and unsigned percentage deviations between two successive approximations of the generalized transmission coefficients for reaction R1 are shown in Fig. 12. The unsigned percentage errors (UPEs) are computed as:| |  | (13) |
where UPEP is the unsigned error of generalized transmission coefficient that includes P distinguishable paths (including paths that are mirror images), and 〈γ〉N is the exact generalized transmission coefficient that includes all 46 distinguishable paths. Unsigned percentage deviations (UPDs) are computed as:| |  | (14) |
where UPDP is the unsigned deviation between the generalized transmission coefficient based on an average over P paths and the one that is based on P−2 paths. (We use P−2 rather than P − 1 because the paths occur in enantiomeric pairs.) Since the generalized transmission coefficient is the only P-dependent quantity in eqn (1), UPDP defined in eqn (14) is equivalent to the unsigned percentage deviation of the MP-VTST rate constants computed including P and P − 2 paths.
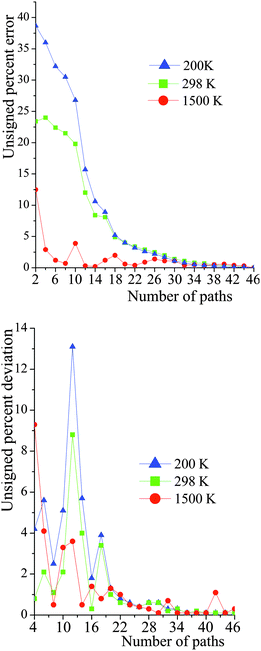 |
| | Fig. 12 Unsigned percent deviations of the generalized transmission coefficients for reaction (R1). The number of paths included (P) is the abscissa. The paths are indexed 1–46, with path numbering in order of increasing classical barrier height. The top figure is the deviation between including P paths and including all N paths. The bottom figure is the deviation between including P paths and including P − 2 paths. See eqn (13) and (14). | |
For small values of P, UPDP is fluctuating rather than converging as P increases; thus, even if UPDP is very small (<5%), the truncation error could still be quite large. For instance, at 200 K, UPD8 is only 2.5%, however UPE8 is 30%. Nevertheless, at high temperatures (for instance, 1500 K), including a few paths is accurate enough for the final generalized transmission coefficients.
5. Summary
In the current work we discussed the errors introduced in truncating the number of paths in MP-VTST calculations. For hydrogen abstraction from tert-butanol by HO2 radical, we found that the variational effects and the contributions of multidimensional tunneling are very different among the various reaction paths. As a consequence, including only one or a few paths does not yield accurate rate constants at low temperature. Over the entire temperature range, the variational effect is negligible for the lowest-energy path; but for some of the higher-energy paths, the behavior is significantly different from that for the lowest-energy path; we gave an example where the variational recrossing transmission coefficients for different paths vary by up to a factor of 1.4. The differences are even greater – much greater – for the tunneling transmission coefficients. At 200 K, the highest–energy path has a small-curvature tunneling transmission coefficient 17 times larger than the one for lowest-energy path. The higher-energy paths can have much larger tunneling transmission coefficients because the effective barrier for tunneling extends higher above the reactants and products, giving a greater energy range in which tunneling can operate. We conclude that the multi-path methodology is necessary for better understanding of the detailed kinetics and predicting the thermal rate constants.
Acknowledgements
The authors appreciate the help and valuable suggestions provided by Dr Rubén Meana-Pañeda. This work was supported in part by the U. S. Department of Energy, Office of Basic Energy Sciences, under grant no. DE-FG02-86ER13579.
References
- T. Yu, J. Zheng and D. G. Truhlar, J. Phys. Chem. A, 2012, 116, 297–308 CrossRef CAS PubMed.
- J. Zheng and D. G. Truhlar, Faraday Discuss., 2012, 157, 59–88 RSC.
- T. Yu, J. Zheng and D. G. Truhlar, Chem. Sci., 2011, 2, 2199–2213 RSC.
- J. Zheng, R. Meana-Pañeda and D. G. Truhlar, J. Am. Chem. Soc., 2014, 136, 5150–5160 CrossRef CAS PubMed.
- X. Xu, T. Yu, E. Papajak and D. G. Truhlar, J. Phys. Chem. A, 2012, 116, 10480–10487 CrossRef CAS PubMed.
- I. M. Alecu, J. Zheng, E. Papajak, T. Yu and D. G. Truhlar, J. Phys. Chem. A, 2012, 116, 12206–12213 CrossRef CAS PubMed.
- P. Seal, G. Oyedepo and D. G. Truhlar, J. Phys. Chem. A, 2013, 117, 275–282 CrossRef CAS PubMed.
- J. L. Bao, R. Meana-Pañeda and D. G. Truhlar, Chem. Sci., 2015, 6, 5866–5881 RSC.
- J. L. Bao, P. Seal and D. G. Truhlar, Phys. Chem. Chem. Phys., 2015, 17, 15928–15935 RSC.
- P. Seal, E. Papajak and D. G. Truhlar, J. Phys. Chem. Lett., 2012, 3, 264–271 CrossRef CAS.
- S. M. Sarathy, S. Vranckx, K. Yasunaga, M. Mehl, P. Obwald, W. K. Metcalfe, C. K. Westbrook, W. J. Pitz, K. Kohse-Hoinghaus, R. X. Fernandes and H. J. Curran, Combust. Flame, 2012, 159, 2028–2055 CrossRef CAS.
- H.-H. Carstensen, A. M. Dean and O. Deutschmann, Proc. Combust. Inst., 2007, 31, 149–157 CrossRef.
- J. Zheng and D. G. Truhlar, J. Chem. Theory Comput., 2013, 9, 1356–1367 CrossRef CAS PubMed.
- Y. P. Liu, G. C. Lynch, T. N. Truong, D.-H. Lu and D. G. Truhlar, J. Am. Chem. Soc., 1993, 115, 2408–2415 CrossRef CAS.
- D. G. Truhlar and A. Kuppermann, J. Am. Chem. Soc., 1971, 93, 1840–1851 CrossRef.
- B. C. Garrett, D. G. Truhlar, R. S. Grev and A. W. Magnuson, J. Phys. Chem., 1980, 84, 1730–1748 CrossRef CAS.
-
A. Fernandez-Ramos, B. A. Ellingson, B. C. Garrett and D. G. Truhlar, in Reviews in Computational Chemistry, ed. K. B. Lipkowitz and T. R. Cundari, Wiley-VCH, Hoboken, NJ, 2007, vol. 23, pp. 125–232 Search PubMed.
- Y. Zhao and D. G. Truhlar, J. Chem. Theory Comput., 2008, 4, 1849–1868 CrossRef CAS.
- B. J. Lynch, Y. Zhao and D. G. Truhlar, J. Phys. Chem. A, 2003, 107, 1384–1388 CrossRef CAS.
-
J. Zheng, S. L. Mielke, K. L. Clarkson and D. G. Truhlar, MSTor computer program, version 2011, University of Minnesota, Minneapolis, MN, 2011 Search PubMed.
- Y. Zhao, N. E. Schultz and D. G. Truhlar, J. Chem. Phys., 2005, 123, 161103 CrossRef PubMed.
- Y. Zhao and D. G. Truhlar, Theor. Chem. Acc., 2008, 120, 215–241 CrossRef CAS.
- Y. Zhao and D. G. Truhlar, Acc. Chem. Res., 2008, 41, 157–167 CrossRef CAS PubMed.
- J. Zheng, X. Xu and D. G. Truhlar, Theor. Chem. Acc., 2011, 128, 295–305 CrossRef CAS.
- T. B. Adler, G. Knizia and H. J. Werner, J. Chem. Phys., 2007, 127, 221106 CrossRef PubMed.
- G. Knizia, T. B. Adler and H. J. Werner, J. Chem. Phys., 2009, 130, 054104 CrossRef PubMed.
- F. R. Manby, J. Chem. Phys., 2003, 119, 4607–4613 CrossRef CAS.
- E. Papajak and D. G. Truhlar, J. Chem. Theory Comput., 2011, 7, 10–18 CrossRef CAS PubMed.
-
M. J. Frisch, G. W. Trucks, H. B. Schlegel, G. E. Scuseria, M. A. Robb, J. R. Cheeseman, G. Scalmani, V. Barone, B. Mennucci, G. A. Petersson, H. Nakatsuji, M. Caricato, X. Li, H. P. Hratchian, A. F. Izmaylov, J. Bloino, G. Zheng, J. L. Sonnenberg, M. Hada, M. Ehara, K. Toyota, R. Fukuda, J. Hasegawa, M. Ishida, T. Nakajima, Y. Honda, O. Kitao, H. Nakai, T. Vreven, J. A. Montgomery, Jr., J. E. Peralta, F. Ogliaro, M. Bearpark, J. J. Heyd, E. Brothers, K. N. Kudin, V. N. Staroverov, R. Kobayashi, J. Normand, K. Raghavachari, A. Rendell, J. C. Burant, S. S. Iyengar, J. Tomasi, M. Cossi, N. Rega, J. M. Millam, M. Klene, J. E. Knox, J. B. Cross, V. Bakken, C. Adamo, J. Jaramillo, R. Gomperts, R. E. Stratmann, O. Yazyev, A. J. Austin, R. Cammi, C. Pomelli, J. Ochterski, R. L. Martin, K. Morokuma, V. G. Zakrzewski, G. A. Voth, P. Salvador, J. J. Dannenberg, S. Dapprich, A. D. Daniels, O. Farkas, J. B. Foresman, J. V. Ortiz, J. Cioslowski and D. J. Fox, GAUSSIAN 09 (Revision D. 01), Gaussian, Inc., Wallingford, CT, 2009 Search PubMed.
-
Y. Zhao, R. Peverati, K. Yang and D. G. Truhlar, MN-GFM version 5.2 computer program module, University of Minnesota, Minneapolis, 2011 Search PubMed.
-
H.-J. Werner, P. J. Knowles, F. R. Manby, M. Schütz, P. Celani, G. Knizia, T. Korona, R. Lindh, A. Mitrushenkov, G. Rauhut, T. B. Adler, R. D. Amos, A. Bernhardsson, A. Berning, D. L. Cooper, M. J. O. Deegan, A. J. Dobbyn, F. Eckert, E. Goll, C. Hampel, A. Hesselmann, G. Hetzer, T. Hrenar, G. Jansen, C. Küoppl, Y. Liu, A. W. Lloyd, R. A. Mata, A. J. May, S. J. McNicholas, W. Meyer, M. E. Mura, A. Nicklaß, P. Palmieri, K. Pflüger, R. Pitzer, M. Reiher, T. Shiozaki, H. Stoll, A. J. Stone, R. Tarroni, T. Thorsteinsson, M. Wang and A. Wolf, MOLPRO, version 2012.1, University of Birmingham, Birmingham, 2012 Search PubMed.
- K. A. Nguyen, C. F. Jackels and D. G. Truhlar, J. Chem. Phys., 1996, 104, 6491–6496 CrossRef CAS.
- C. F. Jackels, Z. Gu and D. G. Truhlar, J. Chem. Phys., 1995, 102, 3188–3201 CrossRef CAS.
-
J. Zheng, S. Zhang, J. C. Corchado, Y. Y. Chuang, E. L. Coitiño, B. A. Ellingson and D. G. Truhlar, GAUSSRATE, version 2009-A, University of Minnesota, Minneapolis, 2010 Search PubMed.
-
J. Zheng, S. Zhang, B. J. Lynch, J. C. Corchado, Y.-Y. Chuang, P. L. Fast, W.-P. Hu, Y.-P. Liu, G. C. Lynch, K. A. Nguyen, C. F. Jackels, A. F. Ramos, B. A. Ellingson, V. S. Melissas, J. Vill_a, I. Rossi, E. L. Coitino, J. Pu, T. V. Albu, R. Steckler, B. C. Garrett, A. D. Isaacson and D. G. Truhlar, POLYRATE, version 2010-A, University of Minnesota, Minneapolis, 2010 Search PubMed.
- D.-H. Lu, T. N. Truong, V. Melissas, G. C. Lynch, Y.-P. Liu, B. C. Garrett, R. Steckler, A. D. Isaacson, S. N. Rai and G. C. Hancock,
et al.
, Comput. Phys. Commun., 1992, 71, 235–262 CrossRef CAS.
- I. M. Alecu, J. Zheng, Y. Zhao and D. G. Truhlar, J. Chem. Theory Comput., 2010, 6, 2872–2887 CrossRef CAS.
- J. Zheng and D. G. Truhlar, Phys. Chem. Chem. Phys., 2010, 12, 7782–7793 RSC.
- D. G. Truhlar, J. Chem. Educ., 1978, 55, 309–311 CrossRef CAS.
-
M. M. Kreevoy and D. G. Truhlar, Transition State Theory, in Investigation of Rates and Mechanisms of Reactions, ed. C. F. Bernasconi, Techniques of Chemistry Series, John Wiley and Sons, New York, 4th edn, 1986, vol. 6, Part 1, pp. 13–95 Search PubMed.
- M. Garcia-Viloca, J. Gao, M. Karplus and D. G. Truhlar, Science, 2004, 303, 186–195 CrossRef CAS PubMed.
Footnote |
| † Electronic supplementary information (ESI) available: Geometries optimized at M08-HX/MG3S level of all the conformers; classical barrier heights and energy of reaction computed by various methods; FMS-Tact factors; MP-VTST rate constants; fitting parameters for rate constants; activation energies and Gibbs free energies of activation. See DOI: 10.1039/c5cp05780a |
|
| This journal is © the Owner Societies 2016 |
Click here to see how this site uses Cookies. View our privacy policy here.  Open Access Article
 ,
Pattrawan
Sripa
and
Donald G.
Truhlar
*


 in the imaginary action integral (see next equation) is reduced to account for the shortening of the tunneling path by corner cutting in the small-curvature limit.14,17 In practice, this reduction is accomplished by replacing μ by μeff,p(s) < μ, where μeff,p(s) depends on the reaction-path curvature at s. Then the SCT tunneling probability at energy E is


 ; some examples (in the SCT approximation) are shown in Table 4. Table 4 shows that representative tunneling energies are 2.6–5.2 kcal mol−1 below the effective barrier maxima. A simple hypothesis might be that the higher-energy paths show larger tunneling transmission coefficients because the effective barriers are thinner near their tops. However, examination of the VGa,p(s) curves shows that, in this energy range, these curves have about the same widths (see Table S7, ESI†). Consistent with this, Table 4 shows that the tunneling probabilities are about the same for all paths at energies 2 to 3 kcal mol−1 below the maximum of the effective potential energy curve for tunneling. So this hypothesis does not explain the observation of larger tunneling transmission coefficients for the higher-energy paths.
![[thin space (1/6-em)]](https://www.rsc.org/images/entities/char_2009.gif) a
a![[thin space (1/6-em)]](https://www.rsc.org/images/entities/char_2009.gif) b
b


