The influence of cations on lithium ion coordination and transport in ionic liquid electrolytes: a MD simulation study†
Volker
Lesch
*ab,
Zhe
Li
c,
Dmitry
Bedrov
c,
Oleg
Borodin
d and
Andreas
Heuer
b
aInstitut für Energie- und Klimaforschung, Ionics in Energy Storage, Helmholtz Institut Münster, Forschungszentrum Jülich, Corrensstrasse 46, 48149 Muenster, Germany. E-mail: v.lesch@fz-juelich.de
bInstitute of Physical Chemistry, Westfälische Wilhelms-Universität Münster, Corrensstrasse 28/30, 48149 Muenster, Germany
cDepartment of Materials Science & Engineering, University of Utah, 122 South Central Campus Drive, Room 304, Salt Lake City, Utah 84112, USA
dU. S. Army Research Laboratory, Electrochemistry Branch, Sensors & Electron Devices Directorate, 2800 Powder Mill Rd., Adelphi, MD 20783, USA
First published on 16th November 2015
Abstract
The dynamical and structural properties in two ionic liquid electrolytes (ILEs) based on 1-ethyl-3-methylimidazolium bis-(trifluoromethanesulfonyl)-imide ([emim][TFSI]) and N-methyl-N-propylpyrrolidinium bis-(trifluoromethanesulfonyl)imide([pyr13][TFSI]) were compared as a function of lithium bis-(trifluoromethanesulfonyl)-imide (LiTFSI) salt concentrations using atomistic molecular dynamics (MD) simulations. The many-body polarizable APPLE&P force field has been utilized. The influence of anion polarization on the structure of the first coordination shell of Li+ was examined. In particular, the reduction of the oxygen of the TFSI anion (OTFSI) polarizability from 1.36 Å3 to 1.00 Å3 resulted in an increased fraction of the TFSI anion bidentate coordination to the Li+. While the overall dynamics in [pyr13][TFSI]-based ILEs was slower than in [emim][TFSI]-based ILEs, the exchange of TFSI anions in and out of the first coordination shell of Li+ was found to be faster in pyr13-based systems. The Li+ ion transference number is higher for these systems as well. These trends can be related to the difference in interaction of TFSI with the IL cation which is stronger for pyr13 than for emim.
1 Introduction
Ionic liquids (ILs) are considered to be promising for different applications since they provide high thermal and electrochemical stability and a unique ionic character1–14 making them good candidates as solvents in various applications.15–18 In particular, many experimental as well as theoretical studies have focused on the application of ILs as solvents in electrochemical devices19–36 such as supercapacitors and lithium ion batteries.13,31,37–41 In order to be used as solvents for batteries the ILs have to dissolve lithium salts which usually is not a problem.12,26,27,42–46 However, one of the main concerns in using IL-based electrolytes (ILEs) in lithium ion batteries is the poor Li+ mobility, and hence low Li+ conductivity.21 To improve these characteristics of ILEs, a fundamental understanding of lithium ion transport on the molecular scale is necessary. Molecular dynamics (MD) simulation is a common tool to elucidate key structural correlations and dynamical mechanisms.47–52To study ILEs with MD simulations a reliable force field is necessary.53 Many of the published studies used the non-polarizable CL&P force field (FF) which is based on OPLS-AA.54–58 Because simulations using the non-polarizable force fields and ion charges of ±1 often predicted slower ion dynamics compared to experiments, it became a common practice to scale down the ion charges in order to account for polarization effects in a mean-field sense and to improve the simulation prediction.53,59–61 While this approach worked for modeling pure ILs comprising of two types of ions (cations and anions), it is not clear if the same scaling factors would work in multicomponent systems (such as e.g. IL + Li salt) comprised of ions with quite disparate chemical structures, sizes and polarizabilities. An alternative approach to model such systems is to explicitly account for induced polarization effects. A polarizable force field, namely the APPLE&P (Atomistic Polarizable Potential for Liquids, Electrolytes and Polymers), was recently developed and validated for a variety of ionic systems. MD simulations using this force field predict dynamical (diffusion, conductivity, and viscosity) as well as structural and thermodynamic properties of a variety of electrolytes that are in very good agreement with the available experimental data.23,50,62 The APPLE&P force field is continuously being improved to better predict thermodynamics, structural and dynamical properties of IL-based systems.36,62 For example recently, the polarizability of oxygen atoms on bis-(trifluoromethanesulfonyl)-imide (TFSI) was adjusted to obtain a more accurate prediction of the Li–TFSI interactions in lithium salt doped ILs and concentrated electrolytes.36,63
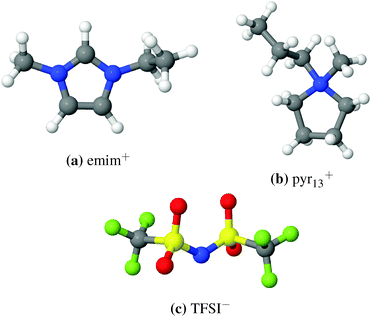
Lithium ion transport in electrolytes is closely correlated with characteristics of its local environment, i.e. Li+ coordination. The number of TFSI anions coordinating Li+ in the TFSI-based ILEs has been an ongoing debate for some time.63 The formation of [Li(TFSI)n](n−1)− complexes with n = 2, 3, 4, 5 has been reported in ILEs consisting of imidazolium and pyrrolidinium cations, TFSI anions, and [Li][TFSI] salt.21,64,65 Although many of these studies23,34,63,65,66 have provided invaluable information on the Li+ local environment, no direct comparison between the two IL cations, 1-ethyl-3-methylimidazolium (emim) and N-methyl-N-propylpyrrolidinium (pyr13), has been done on the atomistic scale to discuss the possible influence of cations on the local environment and transport of Li+. The structures of both cations are shown in Fig. 1. Different experimental studies compared both cation types with different side chains with respect to properties such as thermal or electrochemical stability.67–70
Furthermore, it is believed that lithium ions have two transport mechanisms, structural and vehicular.63,65,66,71 The structural mechanism is related to the exchange of molecules in the first coordination shell of Li+, while the vehicular one is the Li+ transport together with its first coordination shell. Both mechanisms contribute to the Li+ transport in ILEs with a significant dominance of the former one. The influence of the IL cation on structural diffusion is therefore of interest.
In this manuscript, we also examined the influence of parameters describing induced polarization interactions on structural and dynamical properties of the two ILEs. It was shown previously in investigations using the CHARMM force field that adjustment of polarization parameters can be effectively used to tune the accuracy of the force field for aqueous solutions.72,73 In this work we specifically compare the properties predicted from MD simulations using the APPLE&P force field with different polarizability of TFSI oxygen atoms (OTFSI), α(OTFSI) = 1.36 Å3 (referred to as the original version of the force field) and α(OTFSI) = 1.00 Å3 (referred to as the modified FF). As we demonstrate below, the modification of polarizability parameter of one atom type can noticeably affect the predicted Li+ coordination structure and Li+ transport mechanisms in ILEs.
2 Simulation protocol
In this study two MD simulation packages, an in-house MD code developed in the University of Utah and a modified version of AMBER10, were used.74,75 When employing the same force field both packages predict consistent properties.Using the original FF, the emim-based IL systems were previously simulated with AMBER10.76 Therefore, for consistency the comparison between original and modified FF for these systems were conducted using AMBER10 package. The simulations studying the influence of the cation were conducted using the Utah group package to allow the consistency with previously published data for pyr13-based ILEs.63
Compositions of the simulated ionic liquids are shown in Table 1. In the following discussion the systems are characterized by the mole fraction of lithium salt and the indices e and p representing the IL cations emim or pyr13, respectively. Additionally, the system (Li0.1,e) with 224 emim, 248 TFSI, and 24 lithium ions was also simulated to compare with the results of available experiments.30,76 This system was also used to confirm that the density, mean square displacement (MSD) and radial distribution functions (RDFs) obtained from the two simulation packages are the same (see the ESI†). Moreover, for the comparative purpose of structural properties, we also simulated the system with α(OTFSI) = 0.00 Å3, which was only simulated at 423 K. The other two polarizability states were simulated at three temperatures 423 K, 393 K and 363 K.
| Ions | Li0.33 | Li0.19 | Li0.15 | Li0 |
|---|---|---|---|---|
| emim/pyr13 | 48 | 100 | 132 | 224 |
| TFSI | 72 | 124 | 156 | 224 |
| Li | 24 | 24 | 24 | 0 |
2.1 AMBER
The starting configurations were generated randomly in the gas phase with a box size of 300 Å. The simulation box was shrunk in an NpT ensemble at atmospheric pressure using the Berendsen thermostat with a coupling constant of 1 ps. Afterwards the systems were equilibrated at 423 K for 4 ns, then at 393 K for 5 ns and for 7 ns at 363 K. The Particle-Mesh-Ewald method was used to calculate the electrostatic interactions (Ewald coefficient: 0.23 Å−1; grid: 64 × 64 × 64; order: 6; cutoff: 11 Å). The 1–4 charge–dipole interaction was scaled by the factor 0.8. The bonds containing hydrogen were constrained via the Shake algorithm. The final trajectories with a simulation length of 60 ns were produced in a NVT ensemble. The elementary integration step was 1 fs.2.2 Utah group code
The initial configurations were equilibrated at 500 K and afterwards the same equilibration procedure as for the AMBER package was applied. For the NpT ensemble a multiple time step integration scheme proposed by Martyna et al.77 was used (coupling thermostat: 10−2 fs−1; coupling barostat: 0.5 × 10⁻³ fs−1). All electrostatic interactions were treated using the Ewald summation (α = 0.23; k-vectors: 8 × 8 × 8). The final trajectories were produced in an NVT ensemble. All bonds were constrained with the Shake algorithm. For bonds, bends and out-of-plane deformations a time step of 0.5 fs was used. A time step of 1.5 fs was used for torsions and non-bonded interactions within a distance of 7 Å. For non-bonded interactions between 7 Å and 11 Å a 3.0 fs time step was utilized. The interactions between two induced dipoles were scaled to zero using a tapering function starting at 9.5 Å separation and the cutoff of 11 Å.2.3 Force field adjustment
Previous MD-simulations of the LiTFSI doped ILs utilized the APPLE&P parameters for ionic liquids62 and the Li+/TFSI− parameters developed for acetonitrile (AN)-LiTFSI electrolytes.64 The average TFSI− (C2 conformer) polarizability from the force field was 15.9 Å3, which was slightly higher than the polarizability of 15 Å3 obtained from B3LYP/aug-cc-pvTz density functional theory (DFT) calculations. The Li–TFSI binding energy was initially compared with the results of DFT calculations performed at M05-2X/6-31+G(d) for (AN)nLi+(TFSI−)m complexes with n = 2, 3 and m = 1, 2. The accuracy of DFT calculations deemed to be reasonably accurate at that point as good agreement was observed for the MP2/aug-cc-pvTz results for other salt complexes with AN.64 More accurate G4MP2 composite level calculations and complete basis set (CBS) extrapolation performed at the MP2 level, however, indicated that the Li–TFSI binding energies of 140 and 141.3 kcal mol−1 calculated at M05-2X/6-31+G** and B3LYP/aug-cc-pvTz, respectively, are noticeably higher than the G4MP2 and MP2/CBS values of 135.6 kcal mol−1 obtained at either of these levels.36,78As the polarizable force fields often require reduction of polarization72,73 the APPLE&P force field for TFSI has been modified by reducing the OTFSI polarizability from 1.36 Å3 to 1.0 Å3, which also resulted in reduced Li–TFSI binding energy from 140.4 kcal mol−1 to 134.0 kcal mol−1![[thin space (1/6-em)]](https://www.rsc.org/images/entities/char_2009.gif) 36 and brought it to a good agreement with G4MP2 calculations and an improved description of the ion transport as will be shown below. The reduced oxygen polarization resulted in an average molecular polarizability of TFSI (C2 conformer) of 14.5 Å3, which is in between the molecular polarizabilities of 13.5 Å3 and 15 Å3 obtained from M05-2X/aug-cc-pvTz and B3LYP/aug-cc-pvTz calculations, respectively.
36 and brought it to a good agreement with G4MP2 calculations and an improved description of the ion transport as will be shown below. The reduced oxygen polarization resulted in an average molecular polarizability of TFSI (C2 conformer) of 14.5 Å3, which is in between the molecular polarizabilities of 13.5 Å3 and 15 Å3 obtained from M05-2X/aug-cc-pvTz and B3LYP/aug-cc-pvTz calculations, respectively.
3 Results and discussion
3.1 Pure [emim][TFSI] and [pyr13][TFSI] ILs
Using the original version of the APPLE&P, pure ILs, [emim][TFSI] and [pyr13][TFSI] were previously simulated and an excellent agreement between experiments and simulation was achieved.79,80 Importantly, a relatively strong interaction between pyr13 and TFSI was observed using the original version of the FF while the binding energy for emim-TFSI is slightly higher (emim-TFSI: 81.95 kcal mol−1; pyr13-TFSI: 79.88 kcal mol−1). To assess the influence of the binding energies between TFSI and cations as well as the adjustment of OTFSI polarizability, we first examined structural and dynamical properties of pure ionic liquids.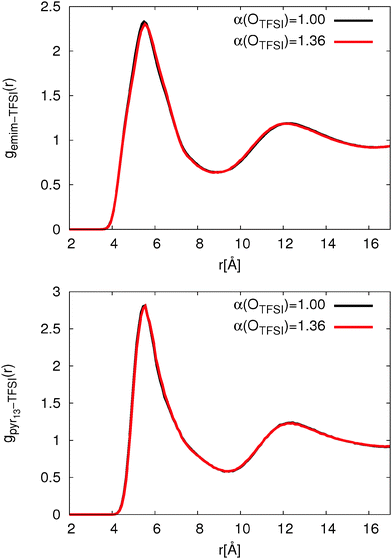 | ||
| Fig. 2 Comparison of IL cation (top: emim, bottom: pyr13)-TFSI COM-RDF for different OTFSI polarizabilities. | ||
Fig. 2 clearly shows that the change of OTFSI polarizability has no influence on the cation-TFSI COM-RDF. In agreement with previous simulations,80 the COM-RDF for pyr13 shows a roughly 20% higher first peak compared to ILs with emim cations. The higher peak intensity is attributed to a stronger interaction between pyr13 and TFSI.
 | (1) |
 | (2) |
In Table 2 the self-diffusion coefficients for both FFs, original and modified, are compared with the experimental data. For the determination of the statistical error each trajectory split into 6 ns intervals and the diffusion coefficients for each interval were determined. Then standard error analysis was applied indicating an error bar of about 4% for the values reported in Table 2.
It appears that reducing OTFSI polarizability does not affect significantly diffusion of ions in pure ILs. Only the diffusion coefficient of the emim cation in the emim-TFSI IL reduces by roughly 10% using the modified force field compared to the original. The absolute values for the diffusion coefficients are in the same range as experimental values which were extrapolated to this temperature using the Vogel–Fulcher–Tamann relation.79,83 Taking into account the uncertainty of the extrapolation of the experimental data estimated by Tokuda et al.,79 the agreement between simulations using the modified FF and experiment is excellent.
3.2 0.9[emimTFSI]/0.1[LiTFSI] ILEs
As mentioned above, the OTFSI polarizability was reduced to allow a better prediction of the Li–TFSI binding energy.36,63 This modification was shown to strongly influence the lithium ion coordination in pyr13-based ILEs.63 Therefore, we performed simulations with α(OTFSI) = 1.36 Å3 (original FF), α(OTFSI) = 1.00 Å3 (modified FF) and α(OTFSI) = 0.00 Å3 (referred to as non-polarizable OTFSI FF) to elucidate the general trend of the influence of OTFSI polarizability. For this purpose, Li0.1,e was simulated at 423 K since the experimental results are available for this system.30,76 Structural properties (for all three FFs) and ion self-diffusion coefficients (for both polarizable FFs) are compared below.The densities of the system obtained from simulations using different FFs are almost the same and in excellent agreement with the experimental data indicating that changes in the OTFSI polarizability have no influence on the densities obtained from MD-simulations (see the ESI†).
3.2.1.1 Li–O. Li ions are primarily coordinated with oxygen atoms of TFSI anions. Therefore, the oxygen coordination number was calculated via
 | (3) |
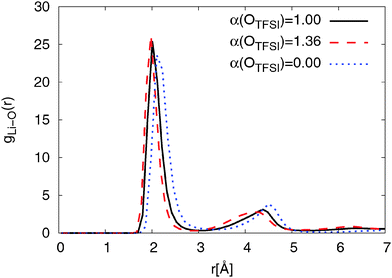
Fig. 3 also shows that reducing OTFSI polarizability leads to a shift of the RDF peaks to larger distances. Interestingly, a bump in the RDF 6.3 Å can be only observed for models with a non-zero polarizability of OTFSI, with the original FF showing a slightly higher intensity. We will discuss and interpret this characteristic later in the context of nitrogen coordination on Li+. The position of the first coordination peak is in good accordance with the experimental results for the Li–OTFSI distance obtained by Matsumoto et al.85
In a combined theoretical and experimental study of the 0.75[emim][TFSI]/0.15[LiTFSI] electrolyte by Umebayashi et al.,86 it was reported that lithium ions are coordinated by roughly 4 oxygen atoms, which is in good agreement with the oxygen coordination numbers predicted by our simulation. Four oxygen coordinated Li+ were also observed in a variety of crystal structures.87 This will be discussed in more detail in the next section. Furthermore, our coordination numbers are in good accordance with general trends obtained for lithium ion coordination by oxygens.88
Li–OTFSI coordination numbers for pyr13-based ILEs, obtained from simulations with the modified and the original FFs, were also found to be similar to those shown above for the emim-based systems.63 This implies that cation types have almost no influence on the first coordination shell of lithium ions.
3.2.1.2 Li–N. Recently, the ILs 1-butyl-3-methylimidazolium bis-(trifluoromethanesulfonyl)-imide ([bmim][TFSI]) and [emim][TFSI] doped with different amounts of LiTFSI were investigated experimentally via Raman spectroscopy.86,89 Both studies reported a OTFSI coordination number of roughly 4. Hardwick et al.89 interpret it as four monodentate TFSI anions while Umebayashi et al.86 as two bidentate coordinating TFSIs. Moreover, Pitawala et al. reported the coordination number of TFSI near Li+ to be concentration dependent and decreasing with increasing LiTFSI concentration.90
Raman spectroscopy can provide valuable insight into Li+ coordination. However, it has recently been noticed that the Raman δsCF3 band in [(AN)3Li(TFSI)] complexes with monodentate binding of OTFSI to Li+ exhibits only a minor blue shift (0–3 cm−1).71,87 This suggests that the Li–TFSI complexes with monodentate binding could have been counted as free TFSI anions in the interpretation of previous Raman spectra. In MD-simulations, two types of coordinations, shown in Fig. 4, can be easily distinguished by examining Li–NTFSI RDFs.
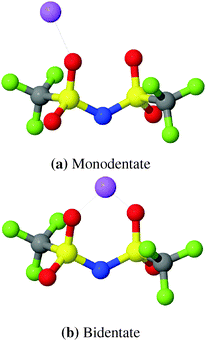 | ||
| Fig. 4 Schematic snapshots of two TFSI coordinations. Cyan: C, blue: N, magenta: F, yellow: S, red: O, green: Li+. | ||
The RDFs from simulations with both, modified and original FFs, show a double peak structure between 2.8 Å and 5.0 Å as can be seen from Fig. 5. For the modified FF the first peak of the double structure is more pronounced while the second one is more pronounced for the original FF. The double peak structure indicates two possible coordinations of TFSI around lithium ions. The first peak results from bidentate (cf.Fig. 4) coordinating TFSI molecules and the second one from monodentate (cf.Fig. 4) TFSI.63,66
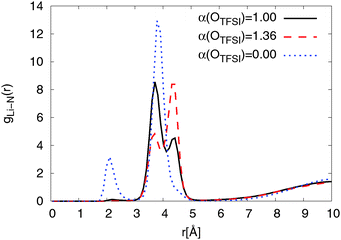 | ||
| Fig. 5 Radial distribution function of NTFSI around lithium ions for Li0.1,e for different OTFSI polarizabilities at T = 423 K. | ||
At longer distances (r > 5 Å) the RDFs for the modified and the original FFs show a similar behavior. The RDF obtained for simulations using non-polarizable OTFSI behaves completely differently. A strong coordination peak appears at a shorter distance (r ≈ 2 Å) due to a direct coordination of Li+ by NTFSI. According to DFT calculations,36 direct coordination of Li+ by NTFSI is not energetically favorable as compared with coordination by two TFSI oxygens. With a much higher magnitude, the second peak is found to be at r = 3.9 Å which is the same distance as the first peak of the double peak structure for force fields with non-zero polarizability of OTFSI. This implies that there are also large amounts of bidentate TFSI in the simulation using the non-polarizable OTFSI FF. Overall, we can conclude that reducing OTFSI polarizability leads to the higher fraction of bidentate coordinated TFSI molecules.
In order to study this behavior in more detail and allow a direct comparison with the experimental Raman data, we determined the percentage of bidentate coordinated TFSI in simulations with different FFs. The percentage of bidentate coordinated TFSI with respect to all TFSIs in the simulation cell can be calculated via
 | (4) |
| α(OTFSI) | 0.00 | 1.00 | 1.36 | |
|---|---|---|---|---|
| fcs | CNN,TFSI | 3.00 | 3.05 | 3.29 |
| P bi,fcs | 0.84 | 0.52 | 0.27 | |
| Sim. box | P bi,sys | 0.24 | 0.15 | 0.08 |
| Exp.21 | P bi | 0.2 |
The NTFSI coordination number is almost the same for the non-polarizable OTFSI FF and the modified FF. The original FF, however, shows a slightly higher CNN,TFSI. Thus, CNN,TFSI varies inversely with α(OTFSI) compared to CNO,TFSI. Given the fact that Pbi,fcs is much higher when α(OTFSI) decreases to zero, this can be attributed to more bidentate coordinated TFSI in the first coordination shell of Li+. This configuration occupies more space in the first coordination shell than the monodentate one. These results allow us to interpret the RDFLi–O in more detail. One can relate the peak at 6.3 Å in the RDFLi–O to monodentate coordination since this peak can only be observed for the FFs with non-zero polarizability of OTFSI. Moreover, the differences in the second peak can also be explained via two possible coordinations due to a systematic shift of this peak to larger distances with increasing Pbi,fcs and decreasing OTFSI polarizability.
Similar changes of CNN,TFSI with respect to modified and original FFs were observed for pyr13-based ILEs63 which again indicates that these two IL cations have no direct influence on the local environment of Li+ and that the reduction of α(OTFSI) has the same influence on both systems. The comparison of Pbi,sys with experiments21 shows a significant improvement. One has to bear in mind that the experiments were performed at room temperature whereas the simulations are conducted at 423 K. For 363 K we determine a slightly higher percentage of bidentate coordination (0.16). Thus, it seems that at lower temperatures the bidentate coordination is more preferred. The system with non-polarizable OTFSI shows a direct coordination via NTFSI and a much higher oxygen coordination number which has not been observed in experiments.
Lesch et al. reported a lithium ion clustering using the original FF.76 The RDF of lithium ions with themselves (see the ESI†) clearly indicates that no lithium ion clustering is present in the simulations. The reduction of OTFSI polarizability leads to the reduction of the ability of TFSI anions to form “bridges” (i.e. being strongly coordinated by two or more Li+) between two or more lithium ions. Our analysis indicates that in simulations using the modified FF only about 5.6% share the same TFSI anion in their first coordination shell. Simulations using the original FF predict roughly 10.7% of all lithium ions sharing the same TFSI molecule. The probabilities for a specific number of lithium ions in the first coordination shell of NTFSI are shown in the ESI.†
3.2.2.1 Residence time of TFSI in the first coordination shell of Li+. As mentioned above, structural diffusion contributes significantly to Li+ diffusion in ILEs. The structural diffusion can be related to the Li–NTFSI residence time which can be determined from the analysis of an autocorrelation function (ACF),
 | (5) |
 | (6) |
| α(OTFSI) | 0.00 | 1.00 | 1.36 |
|---|---|---|---|
| τ Li–N | 5.85 ± 0.31 | 2.57 ± 0.15 | 2.87 ± 0.11 |
| Cluster size [Å] | 4.25 | 4.47 | 4.63 |
Reducing the OTFSI polarizability leads to a decrease of the residence time. Further reduction of OTFSI polarizability results in a residence time which is roughly a factor two higher. Thus, we observed the slightly enhanced structural diffusion for a simulation with α(OTFSI) = 1.00 Å. This is expected since NTFSI interacts directly with Li+ in simulation with α(OTFSI) = 0.0 Å3. Thus, the oxygen density in the first coordination shell is higher in this case while the efficiency of structural diffusion is dramatically lowered when α(OTFSI) = 1.0 Å3.
To understand the influence of OTFSI polarizability, we then calculated the coordination number of TFSI molecules viaeqn (3). The coordination numbers as a function of distance for systems with all three polarizability parameters are shown in Fig. 6. It is clearly shown that n(r) has a plateau from 4.7 Å to 7 Å for non-polarizable OTFSI which is related to closed and well-defined coordination shells.18 Furthermore, it indicates that most TFSI molecules coordinate Li+ with two oxygens which is in agreement with the percentage of bidentate TFSI molecules (cf.Table 3). The original FF shows a small plateau for 5.0 Å ≤ r ≤ 6.3 Å. This results from a closed solvation shell and the shift to larger distances compared to non-polarizable FF is related to the presence of monodentate coordinated TFSI. In contrast, the modified FF shows no plateau. Thus, the coordination shell for the modified FF is less compact while the original FF shows a closed and compact coordination shell. Having this in mind, higher residence times can be related to the presence of a closed coordination shell.
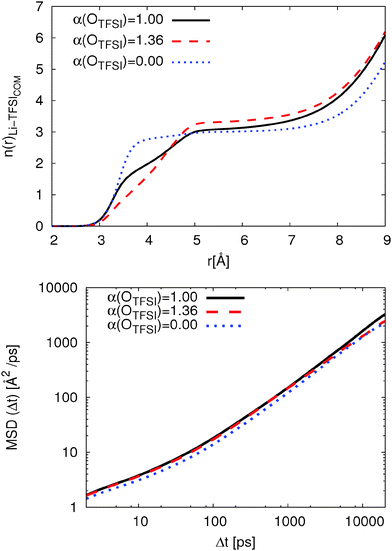 | ||
| Fig. 6 Coordination number to eqn (3) for TFSI on Li+ (top) and Li+ MSD at T = 423 K (bottom). | ||
With respect to the transport mechanisms, we compare the mean-square displacement (MSD) of Li+ for all three polarizability parameters in Fig. 6. The Li+ MSD is only slightly affected by reducing OTFSI polarizability according to ref. 36 (roughly 5%). Thus, the dramatic change in the coordination behavior influences the Li+ MSD by only 10%. In contrast, the MSD for Li+ coordinated by non-polarizable OTFSI is roughly 20% smaller. This is related to a closed, well-defined coordination shell and the long residence time of TFSI in the first coordination shell of Li+. This behavior is in good agreement with the results for the solvation of differently charged model spheres in ionic liquids and the correlation between dynamics and the local environment.18 Thus, the exchange rate of TFSI and the composition of the first coordination shell influence the Li+ MSD as Li et al. proposed with their transport mechanism.63
Table 4 also shows the size of formed [Li(TFSI)n](n−1)− clusters. Here, the distance of each TFSI molecules to Li+ is calculated if at least one oxygen is inside the first coordination shell. The cluster sizes are in good agreement with the percentage of bidentate coordinated TFSI since the cluster size becomes smaller with increasing Pbi,sys. With respect to the MSDs, one can observe that smaller cluster sizes do not necessarily lead to improved vehicular diffusion.
3.2.2.2 Self-diffusion coefficients. The Li+ MSD is only weakly affected by reducing OTFSI polarizability to α(OTFSI) = 1.0 Å3. Since further reduction leads to much smaller MSD, in this part only the polarizable OTFSI states are considered. A comparison for Li0.1,e for the modified and the original FF with experimental values and simulation data for a slightly lower concentration of 0.09 LiTFSI76 is shown in Fig. 7. A similar comparison with the experimental data was done for pyr13 in a previous work by Li et al.63
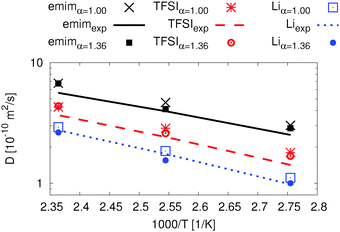 | ||
| Fig. 7 Ion dynamics from MD simulations for Li0.1,e, comparison of the diffusion coefficients for both APPLE&P versions with pfg-NMR data and simulation data.76 | ||
In Fig. 7 four data sets are shown. The experimental as well as the simulation data are for a slightly lower concentration of 0.09 LiTFSI.76 Nevertheless, both literature data and our simulations are in good agreement.
The deviation between diffusion coefficients using the original FF and the experimental data is inside the error of 2% for emim and TFSI and 7% for Li+ which was determined via splitting the trajectory at 423 K. The difference between the modified and the original FF is less than 5% for all three temperatures. Furthermore, the diffusion coefficients for all ionic species using the modified FF are slightly higher than the experimental ones while the concentration is slightly lower in the experiment. However, the agreement is excellent for both data sets since the extrapolation error of the experimental data sets has also been taken into account.
3.3 Influence of LiTFSI concentration
In this section, we focus on a comparison of the two ILEs as a function of LiTFSI salt concentration. We investigated the structural and transport properties of these ILs as a function of LiTFSI concentration in order to gain additional insight. The modified FF with reduced TFSI polarization was used in these simulations as it was shown to better capture structural, transport and energetic properties of ILs as shown above.| System | Li0.15 | Li0.19 | Li0.33 |
|---|---|---|---|
| CNO-emim | 4.61 | 4.63 | 4.56 |
| CNO-pyr13 | 4.61 | 4.59 | 4.53 |
| CNN-emim | 3.05 | 3.06 | 3.05 |
| P bi,fcs | 0.51 | 0.51 | 0.44 |
| P bi,sys | 0.23 | 0.3 | 0.44 |
| CNN-pyr13 | 3.02 | 3.04 | 3.02 |
| P bi,fcs | 0.53 | 0.51 | 0.45 |
| P bi,sys | 0.24 | 0.29 | 0.45 |
Table 5 clearly shows that both CNO,TFSI and CNN,TFSI are nearly unaffected by the IL cation and LiTFSI concentration. CNN,TFSI is in excellent agreement with the experimental results obtained by Nicotera et al. in a crystalline phase.91 They studied 2![[thin space (1/6-em)]](https://www.rsc.org/images/entities/char_2009.gif) :
:![[thin space (1/6-em)]](https://www.rsc.org/images/entities/char_2009.gif) 1 complexes of [pyr13][TFSI] with LiTFSI as a function of temperature and lithium salt concentration. In these complexes three TFSI molecules coordinate with one lithium ion which is in excellent agreement with CNN,TFSI. Moreover, Castriota et al. investigated these complexes via Raman spectroscopy again depending on temperature and lithium ion concentration.92 They reported a weak interaction between TFSI and pyr13 compared to the Li–TFSI interaction which is an indicator for the low influence of the organic IL cation on lithium ion coordination as it is shown by the coordination numbers in Table 5. This is in agreement with Raman spectroscopy93 but as previously mentioned “free” and monodentate coordinated TFSI molecules cannot be distinguished by these techniques.87
1 complexes of [pyr13][TFSI] with LiTFSI as a function of temperature and lithium salt concentration. In these complexes three TFSI molecules coordinate with one lithium ion which is in excellent agreement with CNN,TFSI. Moreover, Castriota et al. investigated these complexes via Raman spectroscopy again depending on temperature and lithium ion concentration.92 They reported a weak interaction between TFSI and pyr13 compared to the Li–TFSI interaction which is an indicator for the low influence of the organic IL cation on lithium ion coordination as it is shown by the coordination numbers in Table 5. This is in agreement with Raman spectroscopy93 but as previously mentioned “free” and monodentate coordinated TFSI molecules cannot be distinguished by these techniques.87
P bi,fcs is similar for both IL cations. It decreases with increasing LiTFSI concentration in the same way for both IL cations. This can be related to higher Li+:TFSI ratios with increasing LiTFSI concentration and the fact that TFSI tends to prefer the coordination on lithium ions. However, Pbi,sys increases with increasing LiTFSI concentration and is comparable for both IL cations. Thus, the Li+ first coordination shell as well as the coordination behavior of TFSI are unaffected by these two IL cations. Pbi,sys is in good agreement with the experimental results for emim-based ILEs21 and pyr14-based ILEs.90 This agreement can help to better understand the still ongoing discussion about the coordination of TFSI on lithium ions.21,63,86
We also determined the probability to find a specific number of lithium ions in the first coordination shell of TFSI. The corresponding graphs are shown in the ESI.† It becomes obvious that higher LiTFSI concentration leads to higher probability to find more than one lithium ion in the first coordination shell. The two lower concentrations are nearly similar. Furthermore, this quantity is independent from the IL cationic species which is in accordance with the observation related to the local environment of Li+.
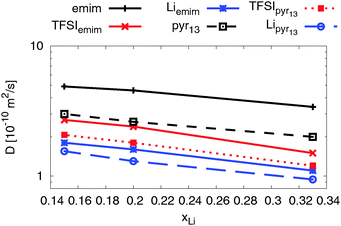 | ||
| Fig. 8 Self-diffusion coefficients for all three ionic species as a function of lithium ion concentration at T = 423 K. | ||
As expected the self-diffusion coefficients of all ionic species decrease with increasing lithium salt concentration. Interestingly, two ILEs show very similar concentration dependence, although the self-diffusion coefficients for all ionic species in the emim-based ILE are higher due to a relatively smaller viscosity of emimTFSI.30,80,83
The lithium ion transference number can be determined via
 | (7) |
| System | emim | pyr13 |
|---|---|---|
| Li0.15 | 0.041 | 0.053 |
| Li0.19 | 0.051 | 0.066 |
| Li0.33 | 0.089 | 0.128 |
The lithium ion transference number represents the percentage of lithium ion self-diffusion coefficient in relation to the sum of all self-diffusion coefficients weighted by the corresponding number of molecules. Table 6 clearly shows that higher lithium ion concentrations lead to higher transference numbers. The lithium ion transference number is roughly 20% higher in the pyr13-based systems than in emim-based ILEs at all three concentrations. Thus, the lithium ion dynamics in the pyr13-based systems are relatively faster as compared to cations and anions. This can be mainly related to the different interaction between TFSI and the two IL cations.
The residence time τLi–N of TFSI in the first coordination shell of Li+ is computed according to eqn (5) and (6). The corresponding residence times depending on IL cations and LiTFSI concentrations are shown in Table 7.
| System | Li0.15 | Li0.19 | Li0.33 |
|---|---|---|---|
| emim | 3.05 | 3.5 | 4.45 |
| pyr13 | 2.3 | 2.9 | 3.9 |
The residence times in the pyr13-based systems are lower than the residence times in the emim-based systems. This can be attributed to the different interaction of emim and pyr13 with TFSI as the RDFs for pure ILs indicate (cf.Fig. 2). Based on the stronger coordination of pyr13 on TFSI,80 it becomes obvious that pyr13 is a bigger competitor for TFSI coordination, i.e. pyr13 accelerates TFSI exchange rates. Therefore, it is reasonable to assume that a slower TFSI exchange rate leads to lower lithium ion transference numbers.
4 Conclusion
In this study, we examined two ionic liquid-based electrolytes doped with LiTFSI salt via atomistic molecular dynamics simulations using the many-body polarizable APPLE&P force fields.The structure of the coordination shell of Li+ was largely independent from the cation of the ionic liquid, e.g. emim or pyr13. The ion diffusion coefficients, including the Li+ diffusion coefficient, however, were found to be systematically slower in the pyr13-based ILEs compared to the emim-based ILEs largely due to higher viscosity of the former.83 Nevertheless, the exchange of TFSI in and out of the first coordination shell of Li+ was found to be faster in pyr13-based ILEs compared to emim-based ILEs resulting in higher lithium transference numbers in the former. This is attributed to the stronger interaction between pyr13 and TFSI compared to emim and TFSI80 highlighting the link between the lithium ion transport and the interaction of IL cations and IL anions.
We have also examined the influence of polarization on the structure of the coordination shell of Li+ and lithium ion transport. The initial decrease of the OTFSI polarizability resulted in the higher fraction of TFSI bidentate coordination bringing it in a better agreement with the experimental data. Furthermore, the ability of TFSI to act as a bridge between two or more lithium ions is weakened. Moreover, the force field utilizing the decreased polarizability of OTFSI predicted the Li+–TFSI− binding energy in a much better agreement with the high level quantum chemistry results.36 Due to systematic improvements in structural and gas-phase energetic properties we recommend usage of the revised (modified) force field with reduced OTFSI polarizability.
Acknowledgements
We greatly acknowledge helpful discussions with Jens Smiatek, Christian Schröder, Jose Nuno Canongia Lopes and Diddo Diddens. V. L. and A. H. thank the federal ministry of research and education (Förderkennzeichen: 03X4631N) for financial support. D. B. and O. B. gratefully acknowledge the support from project sponsored by Army Research Laboratory under Cooperative Agreement Number W911NF-12-2-0023. The views and conclusions contained in this document are those of the authors and should not be interpreted as representing the official policies, either expressed or implied, of ARL or the U.S. Government. The U.S. Government is authorized to reproduce and distribute reprints for Government purposes notwithstanding any copyright notation herein.References
- D. Appleby, C. L. Hussey, K. R. Seddon and J. E. Turp, Nature, 1986, 323, 614–616 CrossRef CAS.
- T. Welton, Chem. Rev., 1999, 99(8), 2071–2084 CrossRef CAS PubMed.
- M. J. Earle and K. R. Seddon, Pure Appl. Chem., 2000, 72, 1391–1398 CrossRef CAS.
- D. Zhao, M. Wu, Y. Kou and E. Min, Catal. Today, 2002, 74, 157–189 CrossRef CAS.
- P. Wasserscheid and W. Keim, Angew. Chem., Int. Ed., 2000, 39, 3772–3789 CrossRef CAS.
- J. F. Brennecke and E. J. Maginn, AIChE J., 2001, 47, 2384–2389 CrossRef CAS.
- J. S. Wilkes, Green Chem., 2002, 4, 73–80 RSC.
- R. D. Rogers and K. R. Seddon, Science, 2003, 302, 792–793 CrossRef PubMed.
- C. Chiappe and D. Pieraccini, J. Phys. Org. Chem., 2005, 18, 275–297 CrossRef CAS.
- D. R. MacFarlane, M. Forsyth, P. C. Howlett, J. M. Pringle, J. Sun, G. Annat, W. Neil and E. I. Izgorodina, Acc. Chem. Res., 2007, 40, 1165–1173 CrossRef CAS PubMed.
- M. Armand, F. Endres, D. MacFarlane, H. Ohno and B. Scrosati, Nat. Mater., 2009, 8, 621–629 CrossRef CAS PubMed.
- A. Lewandowski and A. Widerska Mocek, J. Power Sources, 2009, 194, 601–609 CrossRef CAS.
- M. V. Fedorov and A. A. Kornyshev, Chem. Rev., 2014, 114, 2978–3036 CrossRef CAS PubMed.
- H. Tokuda, S. Tsuzuki, M. A. B. H. Susan, K. Hayamizu and M. Watanabe, J. Phys. Chem. B, 2006, 110, 19593–19600 CrossRef CAS PubMed.
- R. P. Swatloski, S. K. Spear, J. D. Holbrey and R. D. Rogers, J. Am. Chem. Soc., 2002, 124, 4974–4975 CrossRef CAS PubMed.
- J. Wu, J. Zhang, H. Zhang, J. He, Q. Ren and M. Guo, Biomacromolecules, 2004, 5, 266–268 CrossRef CAS PubMed.
- H. Zhang, J. Wu, J. Zhang and J. He, Macromolecules, 2005, 38, 8272–8277 CrossRef CAS.
- V. Lesch, A. Heuer, C. Holm and J. Smiatek, Phys. Chem. Chem. Phys., 2015, 17, 8480–8490 RSC.
- W. Xu, E. I. Cooper and C. A. Angell, J. Phys. Chem. B, 2003, 107, 6170–6178 CrossRef CAS.
- K. Hayamizu, Y. Aihara, H. Nakagawa, T. Nukuda and W. S. Price, J. Phys. Chem. B, 2004, 108, 19527–19532 CrossRef CAS.
- J.-C. Lassègues, J. Grondin and D. Talaga, Phys. Chem. Chem. Phys., 2006, 8, 5629–5632 RSC.
- M. Galiski, A. Lewandowski and I. Stpniak, Electrochim. Acta, 2006, 51, 5567–5580 CrossRef.
- O. Borodin, G. D. Smith and W. Henderson, J. Phys. Chem. B, 2006, 110, 16879–16886 CrossRef CAS PubMed.
- S. K. Reed, O. J. Lanning and P. A. Madden, J. Chem. Phys., 2007, 126, 084704 CrossRef PubMed.
- S. K. Reed, P. A. Madden and A. Papadopoulos, J. Chem. Phys., 2008, 128, 124701 CrossRef PubMed.
- A. Balducci, M. Schmuck, W. Kern, B. Rupp, S. Passerini and M. Winter, ECS Trans., 2008, 11, 109–114 CAS.
- A. Guerfi, M. Dontigny, Y. Kobayashi, A. Vijh and K. Zaghib, J. Solid State Electrochem., 2009, 13, 1003–1014 CrossRef CAS.
- G. B. Appetecchi, M. Montanino, A. Balducci, S. F. Lux, M. Winter and S. Passerini, J. Power Sources, 2009, 192, 599–605 CrossRef CAS.
- C. Merlet, M. Salanne, B. Rotenberg and P. A. Madden, J. Phys. Chem. C, 2011, 115, 16613–16618 CAS.
- K. Hayamizu, S. Tsuzuki, S. Seki and Y. Umebayashi, J. Chem. Phys., 2011, 135, 084505 CrossRef PubMed.
- S. Li, G. Feng, P. F. Fulvio, P. C. Hillesheim, C. Liao, S. Dai and P. T. Cummings, J. Phys. Chem. Lett., 2012, 3, 2465–2469 CrossRef CAS PubMed.
- M. Joost, M. Kunze, S. Jeong, M. Schnhoff, M. Winter and S. Passerini, Electrochim. Acta, 2012, 86, 330–338 CrossRef CAS.
- T. Mendez-Morales, J. Carrete, S. Bouzn-Capelo, M. Perez-Rodriguez, O. Cabeza, L. J. Gallego and L. M. Varela, J. Phys. Chem. B, 2013, 117, 3207–3220 CrossRef CAS PubMed.
- C. J. F. Solano, S. Jeremias, E. Paillard, D. Beljonne and R. Lazzaroni, J. Chem. Phys., 2013, 139, 034502 CrossRef CAS PubMed.
- D. Diddens and A. Heuer, ACS Macro Lett., 2013, 2, 322–326 CrossRef CAS.
- D. W. McOwen, D. M. Seo, O. Borodin, J. Vatamanu, P. D. Boyle and W. A. Henderson, Energy Environ. Sci., 2014, 7, 416–426 CAS.
- A. Balducci, R. Dugas, P.-L. Taberna, P. Simon, D. Plee, M. Mastragostino and S. Passerini, J. Power Sources, 2007, 165, 922–927 CrossRef CAS.
- M. V. Fedorov and A. A. Kornyshev, Electrochim. Acta, 2008, 53, 6835–6840 CrossRef CAS.
- J. Vatamanu, O. Borodin and G. D. Smith, J. Phys. Chem. B, 2011, 115, 3073–3084 CrossRef CAS PubMed.
- J. Vatamanu, O. Borodin, D. Bedrov and G. D. Smith, J. Phys. Chem. C, 2012, 116, 7940–7951 CAS.
- A. Boisset, J. Jacquemin and M. Anouti, Electrochim. Acta, 2013, 102, 120–126 CrossRef CAS.
- K. Xu, Chem. Rev., 2004, 104, 4303–4418 CrossRef CAS PubMed.
- M. Ishikawa, T. Sugimoto, M. Kikuta, E. Ishiko and M. Kono, J. Power Sources, 2006, 162, 658–662 CrossRef CAS.
- Z. P. Rosol, N. J. German and S. M. Gross, Green Chem., 2009, 11, 1453–1457 RSC.
- R.-S. Khnel, N. Bckenfeld, S. Passerini, M. Winter and A. Balducci, Electrochim. Acta, 2011, 56, 4092–4099 CrossRef.
- K. Leung and C. M. Tenney, J. Phys. Chem. C, 2013, 117, 24224–24235 CAS.
- P. Allen and D. Tildesley, Computer Simulation of Liquids, Clarendon Press, 1989 Search PubMed.
- O. Borodin and G. D. Smith, J. Phys. Chem. B, 2006, 110, 11481–11490 CrossRef CAS PubMed.
- T. Köddermann, D. Paschek and R. Ludwig, ChemPhysChem, 2007, 8, 2464–2470 CrossRef PubMed.
- D. Bedrov, O. Borodin, Z. Li and G. D. Smith, J. Phys. Chem. B, 2010, 114, 4984–4997 CrossRef CAS PubMed.
- O. Borodin, Molecular Modeling in Electrolytes, in Electrolytes for Lithium and Lithium-Ion Batteries, ed. T. Jow, Springer, 2014, vol. 58 Search PubMed.
- S. Zahn, M. Brehm, M. Brssel, O. Hollczki, M. Kohagen, S. Lehmann, F. Malberg, A. S. Pensado, M. Schppke, H. Weber and B. Kirchner, J. Mol. Liq., 2014, 192, 71–76 CrossRef CAS.
- F. Dommert, K. Wendler, R. Berger, L. Delle Site and C. Holm, ChemPhysChem, 2012, 13, 1625–1637 CrossRef CAS PubMed.
- J. N. Canongia Lopes, J. Deschamps and A. A. H. Pdua, J. Phys. Chem. B, 2004, 108, 2038–2047 CrossRef.
- J. N. Canongia Lopes and A. A. Pádua, J. Phys. Chem. B, 2004, 108, 16893–16898 CrossRef.
- J. N. Canongia Lopes and A. A. Pádua, J. Phys. Chem. B, 2006, 110, 19586–19592 CrossRef CAS PubMed.
- J. N. Canongia Lopes, A. A. Pádua and K. Shimizu, J. Phys. Chem. B, 2008, 112, 5039–5046 CrossRef CAS PubMed.
- K. Shimizu, D. Almantariotis, M. F. C. Gomes, A. A. Pádua and J. N. Canongia Lopes, J. Phys. Chem. B, 2010, 114, 3592–3600 CrossRef CAS PubMed.
- V. Chaban, Phys. Chem. Chem. Phys., 2011, 13, 16055–16062 RSC.
- V. V. Chaban, I. V. Voroshylova and O. N. Kalugin, Phys. Chem. Chem. Phys., 2011, 13, 7910–7920 RSC.
- C. Schröder, Phys. Chem. Chem. Phys., 2012, 14, 3089–3102 RSC.
- O. Borodin, J. Phys. Chem. B, 2009, 113, 11463–11478 CrossRef CAS PubMed.
- Z. Li, O. Borodin, G. D. Smith and D. Bedrov, J. Phys. Chem. B, 2015, 119, 3085–3096 CrossRef CAS PubMed.
- D. M. Seo, O. Borodin, S.-D. Han, P. D. Boyle and W. A. Henderson, J. Electrochem. Soc., 2012, 159, A1489–A1500 CrossRef CAS.
- J. B. Haskins, W. R. Bennett, J. J. Wu, D. M. Hernndez, O. Borodin, J. D. Monk, C. W. Bauschlicher and J. W. Lawson, J. Phys. Chem. B, 2014, 118, 11295–11309 CrossRef CAS PubMed.
- Z. Li, G. D. Smith and D. Bedrov, J. Phys. Chem. B, 2012, 116, 12801–12809 CrossRef CAS PubMed.
- D. MacFarlane, S. Forsyth, J. Golding and G. Deacon, Green Chem., 2002, 4, 444–448 RSC.
- S. A. Forsyth, S. R. Batten, Q. Dai and D. R. MacFarlane, Aust. J. Chem., 2004, 57, 121–124 CrossRef CAS.
- W. A. Henderson and S. Passerini, Chem. Mater., 2004, 16, 2881–2885 CrossRef CAS.
- N. Madria, T. Arunkumar, N. G. Nair, A. Vadapalli, Y.-W. Huang, S. C. Jones and V. P. Reddy, J. Power Sources, 2013, 234, 277–284 CrossRef CAS.
- D. M. Seo, O. Borodin, D. Balogh, M. O'Connell, Q. Ly, S.-D. Han, S. Passerini and W. A. Henderson, J. Electrochem. Soc., 2013, 160, A1061–A1070 CrossRef CAS.
- C. M. Baker and A. D. MacKerell Jr., J. Mol. Model., 2010, 16, 567–576 CrossRef CAS PubMed.
- H. Yu, T. W. Whitfield, E. Harder, G. Lamoureux, I. Vorobyov, V. M. Anisimov, A. D. MacKerell Jr. and B. Roux, J. Chem. Theory Comput., 2010, 6, 774–786 CrossRef CAS PubMed.
- D. A. Case, T. A. Darden, T. E. I. Cheatham, C. L. Simmerling, J. Wang, R. E. Duke, R. Luo, M. Crowley, R. C. Walker, W. Zhang, K. M. Merz, B. Wang, S. Hayik, A. Roitberg, G. Seabra, I. Kolossvary, K. F. Wong, F. Paesani, J. Vanicek, X. Wu, S. Brozell, T. Steinbrecher, H. Gohlke, L. Yang, C. Tan, J. Mongan, V. Hornak, G. Cui, D. Mathews, M. Seetin, C. Sagui, V. Babin and P. Kollman, AMBER 10, 2008 Search PubMed.
- D. Diddens, A. Heuer and O. Borodin, Macromolecules, 2010, 43, 2028–2036 CrossRef CAS.
- V. Lesch, S. Jeremias, A. Moretti, S. Passerini, A. Heuer and O. Borodin, J. Phys. Chem. B, 2014, 118, 7367–7375 CrossRef CAS PubMed.
- G. J. Martyna, D. J. Tobias and M. L. Klein, J. Chem. Phys., 1994, 101, 4177–4189 CrossRef CAS.
- C. W. Bauschlicher, J. B. Haskins, E. W. Bucholz, J. W. Lawson and O. Borodin, J. Phys. Chem. B, 2014, 118, 10785–10794 CrossRef CAS PubMed.
- H. Tokuda, K. Hayamizu, K. Ishii, M. A. B. H. Susan and M. Watanabe, J. Phys. Chem. B, 2005, 109, 6103–6110 CrossRef CAS PubMed.
- O. Borodin, W. Gorecki, G. D. Smith and M. Armand, J. Phys. Chem. B, 2010, 114, 6786–6798 CrossRef CAS PubMed.
- A. Einstein and M. von Smoluchowski, Untersuchungen ber die Theorie der Brownschen Bewegung, Deutsch, 1997 Search PubMed.
- B. Dünweg and K. Kremer, J. Chem. Phys., 1993, 99, 6983–6997 CrossRef.
- K. Hayamizu, S. Tsuzuki, S. Seki, K. Fujii, M. Suenaga and Y. Umebayashi, J. Chem. Phys., 2010, 133, 194505 CrossRef PubMed.
- O. Borodin, G. D. Smith and R. Douglas, J. Phys. Chem. B, 2003, 107, 6824–6837 CrossRef CAS.
- K. Matsumoto, R. Hagiwara and O. Tamada, Solid State Sci., 2006, 8, 1103–1107 CrossRef CAS.
- Y. Umebayashi, H. Hamano, S. Seki, B. Minofar, K. Fujii, K. Hayamizu, S. Tsuzuki, Y. Kameda, S. Kohara and M. Watanabe, J. Phys. Chem. B, 2011, 115, 12179–12191 CrossRef CAS PubMed.
- D. M. Seo, P. D. Boyle, R. D. Sommer, J. S. Daubert, O. Borodin and W. A. Henderson, J. Phys. Chem. B, 2014, 118, 13601–13608 CrossRef CAS PubMed.
- U. Olsher, R. M. Izatt, J. S. Bradshaw and N. K. Dalley, Chem. Rev., 1991, 91, 137–164 CrossRef CAS.
- L. J. Hardwick, M. Holzapfel, A. Wokaun and P. Novk, J. Raman Spectrosc., 2007, 38, 110–112 CrossRef CAS.
- J. Pitawala, A. Martinelli, P. Johansson, P. Jacobsson and A. Matic, J. Non-Cryst. Solids, 2015, 407, 318–323 CrossRef CAS.
- I. Nicotera, C. Oliviero, W. A. Henderson, G. B. Appetecchi and S. Passerini, J. Phys. Chem. B, 2005, 109, 22814–22819 CrossRef CAS PubMed.
- M. Castriota, T. Caruso, R. Agostino, E. Cazzanelli, W. Henderson and S. Passerini, J. Phys. Chem. A, 2005, 109, 92–96 CrossRef CAS PubMed.
- Y. Umebayashi, T. Mitsugi, S. Fukuda, T. Fujimori, K. Fujii, R. Kanzaki, M. Takeuchi and S.-I. Ishiguro, J. Phys. Chem. B, 2007, 111, 13028–13032 CrossRef CAS PubMed.
- J.-M. Tarascon and M. Armand, Nature, 2001, 414, 359–367 CrossRef CAS PubMed.
Footnote |
| † Electronic supplementary information (ESI) available. See DOI: 10.1039/c5cp05111h |
| This journal is © the Owner Societies 2016 |

