
Implementing a strategy for on-chip detection of cell-free DNA fragments using GMR sensors: A translational application in cancer diagnostics using ALU elements†
T. M.
Dias
*ab,
F. A.
Cardoso
a,
S. A. M.
Martins
a,
V. C.
Martins
a,
S.
Cardoso
a,
J. F.
Gaspar
c,
G.
Monteiro
b and
P. P.
Freitas
a
aINESC-MN – Microsystems and Nanotechnologies, Rua Alves Redol, 9, 1000-029 Lisbon, Portugal. E-mail: tdias@inesc-mn.pt; Fax: +351 213145843; Tel: +351 213100237
bIBB – Institute for Bioengineering and Biosciences, Av. Rovisco Pais, 1049-001 Lisboa, Portugal
cToxomics, NOVA Medical School/Faculdade de Ciências Médicas Universidade Nova de Lisboa, Edifício CEDOC II, Rua Câmara Pestana, 6, 1150-082, Lisbon, Portugal
First published on 13th November 2015
Abstract
Cell-free DNA (cfDNA) is foreseen as a promising source for liquid biopsies in cancer diagnostics. Despite its promise, methods available for its evaluation lack in robustness or, in the case of next-generation sequencing (NGS), are extremely sensitive but overly complex for routine operation. In contrast to NGS, integrated lab-on-chip devices offer advantages particularly in terms of automation, cost and speed. These devices, however, have rarely demonstrated the detection of biologically relevant DNA fragments originating from blood. To this end, we present a strategy for the magnetic labeling and detection of cfDNA fragments, using an array of 30 magnetoresistive (MR) sensors integrated in a portable biochip platform. As a proof-of-concept, we selected the fragments ALU115 and ALU247, recently identified as promising cancer targets in cfDNA integrity assessment. This work reveals a rational optimization of the DNA probes design and density at the surface which allowed achieving specific target detection and increased inhibition of unspecific interactions, without the need for blocking agents. The developed strategy is adaptable for the detection of mutations, homologous or truncated sequences such as the case of ALU115 and ALU247, sequences that share great similarity. Upon optimization, the MR sensors detected a concentration of the ALU elements within the picomolar range, showing potential for cfDNA analysis in cancer diagnostics.
Introduction
The assessment of circulating cell-free DNA (cfDNA) is being targeted as a promising non-invasive methodology in cancer diagnostics.1 The cfDNA accumulates in blood mostly from cells dying either by apoptosis or necrosis, a process extensively described elsewhere.2,3 With cfDNA acting as a liquid biopsy, somatic mutations that were originated at an individual's tumor site can be potentially genotyped without having to perform invasive biopsies.4 The detection of cfDNA derived from tumors, however, carries substantial challenges, as circulating tumor DNA (ctDNA), often only represents a very small fraction (<1.0%) of the total cfDNA fraction.5 This presents a limitation for standard sequencing approaches such as Sanger sequencing and pyrosequencing which only detect mutant alleles in a sample down to 15% and 5%, respectively, of the total cfDNA fraction. In both cases, it is not enough to detect tumor-derived mutant fragments unless the patients are already affected with tumors in advanced stages.5,6 In contrast, techniques that use next-generation sequencing (NGS)7 or novel PCR approaches such as Scorpion Amplification Refractory Mutation Systems (ARMS-Scorpion),8 digital PCR,9 pyrophosphorolysis-activated polymerization (PAP) assays,10 beads, emulsion, amplification, and magnetics (BEAMing)11 or Tagged-Amplicon deep Sequencing (TAM-Seq)12 provide a sensitivity for mutants at 1% down to 0.01% or lower, though with a substantial extra financial cost allied to a complex operation.5,13 A midpoint should be met at the frontier between these high throughput NGS technologies and “ultra-low cost” diagnostic systems such as the conventional paper-based assays, so that patients can benefit from affordable, user-friendly approaches that are simultaneously robust and sensitive. Lab-on-chip technologies meet these criteria as they can be easily integrated with electronic components and highly sensitive detectors, requiring only a diminutive amount of test samples for analysis. As important as the development of new technologies, the discovery of relevant biomarkers is essential. Besides the identification of somatic mutations in ctDNA, the analysis of the total cfDNA levels in blood (either of normal cfDNA or tumor DNA) alongside with its integrity (size of the cfDNA fragments) has shown to be promising in the assessment of cancer, tumor staging and metastatic potential.14The analysis of the concentration and integrity of the cfDNA is promising as the whole DNA content is assessed surpassing the limitations in sensitivity required (<1%) for the identification of somatic alterations. Regarding the cfDNA integrity, in healthy individuals, apoptosis is highly predominant over necrosis leading to the release of small and uniform DNA fragments of around 180–200 bp into the bloodstream.15,16 In patients with cancer, the increased cellular turnover and number of cells dying by necrosis lead to the release of elevated amounts of undigested DNA into the circulation.17 With these concepts, Umetani et al. designed a method to measure the ratio of longer to shorter DNA fragments (DNA integrity index) based on the assessment of two ALU repeats by quantitative PCR (qPCR).18 The fragments assessed by this method were a sequence of 115 bp (ALU115) and a sequence of 247 bp (ALU247), of which, the ALU115 sequence was truncated within the ALU247. Various studies have reported this method, for example, in the diagnosis of gliomas,19 lobular breast cancer20 and in the detection and monitoring of colorectal cancer patients in both early and late stages by qPCR.21
This is the first time, however, that these ALU elements or in fact, up to our knowledge, blood-based cfDNA sequences are targeted for detection using a portable biochip system. The designed biochip comprises an array of 30 magnetoresistive (MR) sensors and offers higher sensitivity and increased portability when compared, for instance, to standard fluorescence techniques.22 Elucidation on the mechanism by which MR sensors detect biological entities is described elsewhere.23–25 MR sensors have been used in the multiplexed detection of proteins, magnetically labeled cells and short sequences of single-stranded (synthetic) DNA as a proof-of-concept for demonstration of GMR and TMR-based magnetoresistive platforms.26–31 Still to demonstrate is the detection of biologically relevant DNA fragments originated from blood as presented here. The methodology followed in this work is divided into three main sections. The first one addresses the generation of magnetically labeled DNA targets, from the stages of blood collection and cfDNA extraction to the amplification of ALU115 and ALU247 by PCR, digestion of the generated amplicons into single-stranded products and labeling with magnetic nanoparticles. The second section addresses the optimization strategy used to promote the specific binding between SH-capture115 (DNA probe designed to capture ALU115) with ALU115 and SH-capture247 (DNA probe designed to capture ALU247) with ALU247 at the surface of the sensors. The third section corresponds to the fabrication and characterization of the MR sensors used in this work and the detection and discrimination of ALU115 and ALU247.
Materials and methods
Plasma preparation and cell-free DNA purification
An average of 2.5 mL blood samples were collected from healthy donors into ethylenediaminetetraacetic acid (EDTA) Vacutainer tubes (BD®), and plasma was isolated via a double centrifugation process of 2500 rpm for 10 min, followed by additional 2500 rpm for 10 min, after a tube transfer following the first spin. Samples were processed within 30 min after collection to minimize the release of potential contaminants into the plasma, such as leukocyte genomic DNA. From 1 mL plasma samples, collected after centrifugation, cfDNA was isolated using the QIAamp Circulating Nucleic Acid Kit, and resuspended in 50 μL of Tris–EDTA (TE) buffer, pH 8.0. To validate the DNA extraction and to generate a sufficient amount of DNA amplicons for use in posterior biochip assays, real-time PCR was performed.Amplification of target fragments by PCR
Two sets of primers were designed for amplification of ALU115 and ALU247. The sequences of the primers were adapted from Umetani's work18 with modifications that include the addition of a 5′-phosphorylated terminal group in both ALU115 and ALU247 forward primers and a biotin moiety at the 5′-end of both reverse primers. Additionally, the forward primer used for the amplification of ALU115 was modified with a non-homologous overhang of 8 base pairs (bp) (GTAGGTAC) upstream to the homologous region of the primer. Generated ALU115 amplicons incorporate, therefore, the 8 bp overhang within their own sequence and assimilate, with this strategy, a distinctive signature from the generated ALU247 amplicons. The primers were purchased from StabVida, Portugal and the sequences, given the above considerations, are as follows: ALU115 forward: phosphate-5′-GTAGGTACCCTGAGGTCAGGAGTTC-3′; ALU115 reverse: biotin-5′-CCCGAGTAGCTGGGATTACA-3′; ALU247 forward: phosphate-5′-GTGGCTCACGCCTGTAATC-3′; ALU247 reverse: biotin-5′-CAGGCTGGAGTGCAGTGG-3′. The full ALU sequence (Fig. S1†), reaction mixture and PCR program are presented in the ESI data.† To validate the cfDNA extraction, a negative control (without template DNA) was run along with a positive control containing 20 ng of genomic DNA in the reaction mixture, extracted from Human Embryonic Kidney (HEK) 293T cells (ATCC-LGC Nr: CRL-11268) (additional information on the ESI methods†). PCR products were electrophoresed on a 2% agarose gel for size confirmation.Generation of single-stranded targets and labelling with magnetic nanoparticles
After size confirmation, the generated amplicons were purified from contaminants using the DNA Clean & Concentrator™-25 from Zymo research and diluted in TE (10 mM; pH 7.4) buffer for further use in labelling assays. The amount of generated fragments was quantified by UV absorption at 280 nm using a NanoDrop Spectrophotometer (NanoValue Plus from Bioxtra). A quantity of 22 ng μL−1 for ALU115 and 53 ng μL−1 for ALU247 was obtained, which corresponds to a concentration of approximately 0.6 μM and 0.7 μM, respectively.Lambda exonuclease was used in this work for the digestion of the generated double-stranded amplicons into single-stranded products that can be used in the hybridization assays with complementary DNA probes. The preferential digestion of one of the strands within the DNA double helix occurs when one of the strands is modified with a phosphate terminal group.32 The reaction used for the digestion consisted of 250 ng of DNA template ALU115 and 500 ng of ALU247 in separated solutions with 0.5 μL (2.5 units) of lambda exonuclease (supplied by New England Biolabs). The reaction mixture and digestion program used are provided in the ESI† (1.5 lambda exonuclease digestion). The digestion was assessed on 2% gel electrophoresis. After digestion, dilutions were performed reaching a target concentration of 3 nM and 300 pM for ALU115 and 2 nM and 200 pM for ALU247 based on the initial concentration of dsDNA quantified by UV absorption. The PCR products were finally bound to streptavidin-coated superparamagnetic 250 nm magnetic beads (prod. code 09-19-252, Micromod) through streptavidin–biotin interactions. At this step, 1 μL of target DNA at different concentrations were reacted with a 10 μL suspension of the beads, 10× diluted from the stock suspension, for 45 min at room temperature and under agitation. With the elution in the suspension of beads, the concentration of targets was diluted 10× from its initial solution. A detailed explanation is provided in the ESI† data (1.6 labelling of DNA targets with 250 nm magnetic beads).
Preparation of gold substrates functionalized with DNA capture probes
Single-stranded DNA probes (SH-capture115 and SH-capture247), complementary to ALU115 and ALU247, were synthesized by StabVida Portugal. The base sequences of SH-capture115 and SH-capture247 were 5′SH-TTTTTTTTTTTTTTTGTAGGTACCCTGAGGTCAGG-3′ and 5′SH-TTTTTTTTTTTTTTTGATCTGCAGTGGCTCACGCCTGT-3′, respectively. The probes were designed with a 15 bp thymine spacer to provide better mobility and availability for interactions with target fragments and were terminally thiolated to ensure their immobilization on gold fabricated structures. Various concentrations of the DNA probes were prepared (1 μM; 3 μM; 5 μM; 10 μM) and brought into contact with gold substrates by manual spotting. The gold layer on the substrates consisted of Ti 5 nm/Au 40 nm, deposited by sputtering (Alcatel, SCM-450) over a 1/4 of 6-inch silicon wafer and cut into small pieces of 7 × 5 mm2. Before the spotting of the DNA probes, the gold substrates underwent a meticulous cleaning process, as described elsewhere.30 A volume of 1 μL was dispensed for the spotting of each of the concentrations tested. Immobilization for each case proceeded for 2 h at room temperature. Unbounded DNA probes were washed with TE buffer after immobilization. All the steps were performed inside a Petri-dish in a humid atmosphere to prevent evaporation. The composition of TE and PB buffers is provided in the ESI.†Hybridization of magnetically labelled DNA targets with immobilized DNA probes
10 μL of the DNA targets conjugated to the magnetic beads, and at a concentration of 0.5 μM, were dispensed over the gold substrates previously functionalized with the DNA probes and left to settle and react for 45 minutes at room temperature inside a Petri-dish in a humid atmosphere to prevent evaporation. At this step, each of the generated conjugates was reacted with the correspondent complementary probes (i.e. ALU115 with SH-capture115 and ALU247 with SH-capture247) and cross-reacted (i.e. ALU115 with SH-capture247 and ALU247 with SH-capture115) for the various concentrations of DNA probes tested. A schematic representation of the procedure is presented in Fig. 1. These experiments were performed in order to select the condition that offered the highest specific binding between complementary pairs of probes–targets along with reduced cross-reactivity between the non-complementary pairs. After 45 min of incubation, unbounded or weekly bounded DNA-bead conjugates were removed by washing with PB buffer. Finally, the gold substrates were analysed by optical microscopy with a total magnification of 40×. The agglomerated magnetic nanoparticles over the surface exhibited a brownish colour that could be visualized depending on the density of particles agglomerated in each spot. To further and more accurately analyze the density of magnetic nanoparticles, ImageJ (image software analyzer) was used. The density of beads on spotted areas was calculated and subtracted from background reference values (areas outside the spots) to obtain the relative surface coverage. The values obtained from analysis with ImageJ must not be seen as absolute but used solely for comparison between different substrates subjected to the same conditions. | ||
| Fig. 1 Scheme with steps for the spotting of DNA probes and biomolecular recognition of magnetically labeled targets. (I) Bare gold substrates; (II) manual spotting of 1 μL of DNA probes; (III) 10 μL spotting of magnetically labeled targets over previously immobilized DNA probes (complementary or non-complementary probes); (IV) the specific recognition of targets by the complementary probes spotted at the surface creates a dense spot while the hybridization with non-complementary DNA probes results in the removal of the particles, after washing. | ||
Sensors and biochip microfabrication
The biochip configuration comprises an array of 30 U-shaped spin-valve (SV) sensors with the following stack deposited by ion beam deposition in a Nordiko 3000 tool: Ta 1.5/NiFe 3.6/CoFe 2.5/Cu 2.1/CoFe 3.3/MnIr 11/Ta 10 (thicknesses in nm).33 Here, NiFe, CoFe, and MnIr stand for Ni80Fe20, Co90Fe10 and Mn76Ir24 film compositions in %. The sensors were defined by direct write laser photolithography and ion milling, resulting in U-shaped sensors with a final active area of 2.5 × 80 μm2 (Fig. 2III inset). Contact leads (AlSiCu 300 nm/15 nm TiW(N)) were made by magnetron sputtering (Nordiko 7000 tool) and were defined by lift-off. The chip was further passivated with a 300 nm thick SiN layer deposited by CVD (at 350 °C). The passivation layer was opened by reactive ion etching at the contact pads. Finally, a thin gold pad (Ti 5 nm/Au 40 nm, 43 × 13 μm2) was sputtered and patterned by lift-off on top of the sensors. The sensors were arranged in six sensing regions each one including four active sensors (with gold) plus a reference sensor (without gold) (Fig. 2I and II). With the thiol–gold biochemistry, the gold pads determine where the biological probes will chemically bind. After fabrication, the biochips were wire-bonded on a printed circuit board (PCB) and the wires were protected from the external environment with a layer of silicone gel (Elastosil E41). Encapsulated sensors had an average magnetoresistance, minimum resistance and sensitivity (S) of (7.65 ± 0.14)%, (750 ± 30) Ω and (−1.27 ± 0.11) mV Oe−1, respectively (Fig. 2III). For the biochip readout, the PCB was connected to the portable measurement platform and the signal variation during each experiment was acquired in real-time for each of the sensors used.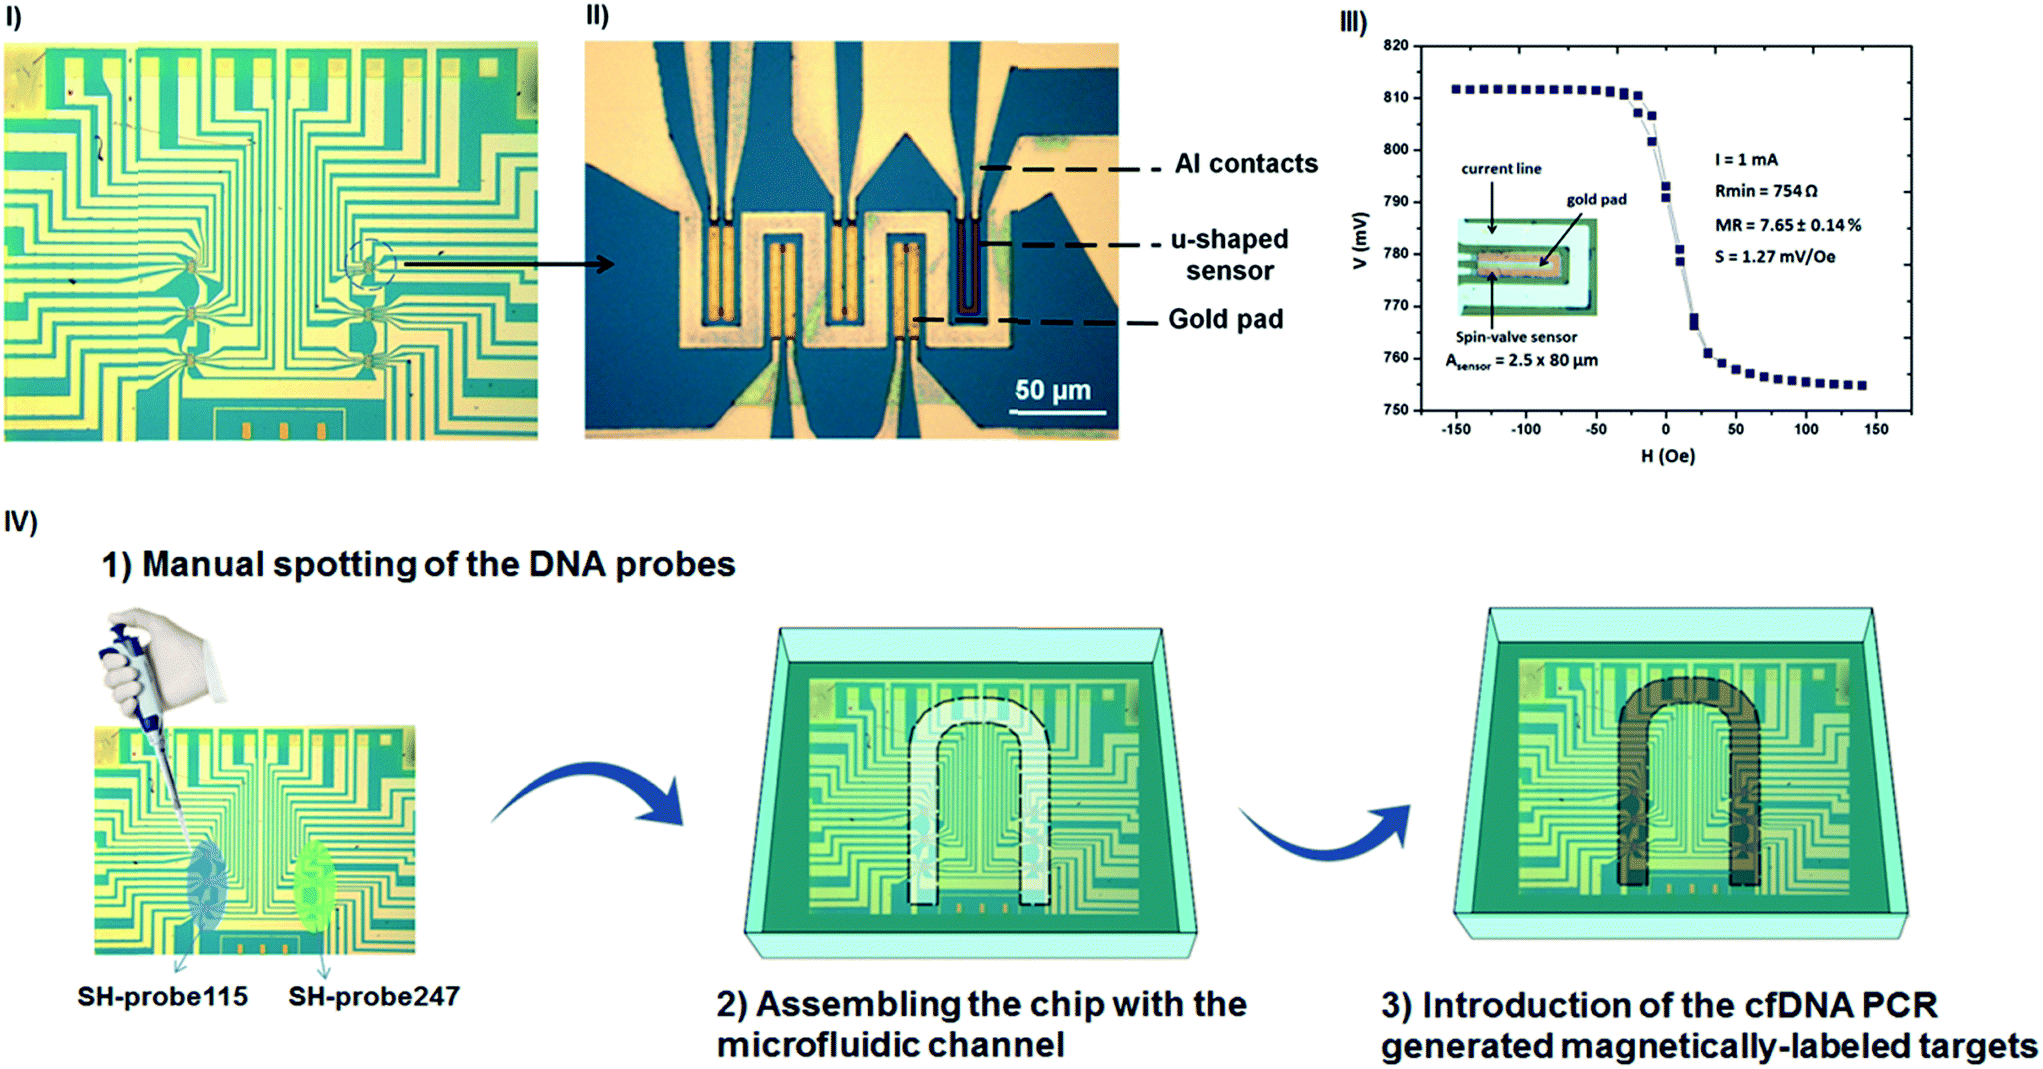 | ||
| Fig. 2 (I) Biochip comprising six sensing regions. (II) Each one including four active sensors (gold pad on top of the sensors) plus a reference sensor (without gold). (III) Transfer curve of a U-shaped spin-valve sensor (2.5 × 80 μm2). Inset: optical microscopy image (400× magnification) of a sensing unit comprising the spin-valve surrounded by an aluminium current line. (IV) Spotting of DNA probes and integration with microfluidics. (1) SH-capture115 was always spotted on the left column of the chip covering all the sensors in that area while the SH-capture247 was always spotted on the sensors at the right column of chip. (2) The biochip was integrated with a microfluidic channel to allow the (3) loading of the magnetically labeled targets into the system. | ||
Immobilization of the DNA probes on the gold pads and readout of the sensors
1 μL of the DNA probes, SH-capture115 and SH-capture247, were manually spotted over the sensors at a concentration of 5 μM in TE buffer. SH-capture115 was always spotted on the left column of the chip covering all the sensors in that area while the SH-capture247 was always spotted on the sensors at the right column of the chip (illustration in Fig. 2IV). Immobilization proceeded for 2 hours at room temperature inside a Petri-dish in a humid atmosphere to prevent evaporation of the spotted drops. After immobilization, unbounded DNA probes were removed by washing with TE buffer. The PCB carrier was then inserted in the measurement platform and integrated with a microfluidic module to allow the controlled injection of the magnetically labelled DNA targets onto the sensing areas of the chip. The process for fabrication of the microfluidic device is described in the ESI data.†Results
In this work, the optimization strategy for the detection of ALU115 and ALU247 using an array of magnetoresistive sensors integrated in a portable electronic platform is presented and discussed.Efficiency of cfDNA isolation and generation of single-stranded biotinylated DNA targets
The purification of cfDNA from plasma was validated by qPCR, using two calibrators per set of primers for ALU115 and ALU247, one positive control containing 20 ng of genomic DNA and a negative control without DNA. The amplification curves obtained for ALU115 and ALU247 are presented in the ESI data (Fig. S3 and S4†). The crossing points (Cp) for the reactions were derived and, as expected, the positive controls presented a lower Cp in comparison to the negative controls while the samples containing cfDNA purified from plasma led to a Cp value in between, but closer to the Cp of the positive controls. This indicates that a comparable amount of DNA was present in the initial sample (Fig. 3III). The specificity in the product formation was verified by the melting curves obtained after PCR where only one peak was observed per run (Fig. 3II). The generated products were within the expected molecular sizes as observed in Fig. 3I (ALU115 in lane 2 and ALU247 in lane 4). Additionally, after digestion with lambda exonuclease, the ALU products migrated further in the gel in comparison with the non-digested fragments (ssALU115 in lane 3 and ssALU247 in lane 5). | ||
| Fig. 3 DNA product analysis for ALU115 and ALU247. (I) Agarose gel with ALU115 and ALU247 before and after digestion with lambda exonuclease. 1 – HyperLadder IV (ranging from 10 kb to 200 bp). 2 – ALU115 before digestion. 3 – ALU115 after digestion. 4 – ALU247 before digestion. 5 – ALU247 after digestion. (II) Melting curve analysis of the PCR products. (III) Cp values obtained from the amplification by PCR of ALU115 and ALU247, including the positive and negative controls. The Cp values were derived using the fit points method. | ||
Surface biochemistry assays
SH-capture115 and SH-capture247, at different concentrations (1 μM, 3 μM, 5 μM and 10 μM), were individually spotted over gold fabricated substrates and hybridized with the generated amplicons ALU115 and ALU247, digested a priori with lambda exonuclease and labelled with the 250 nm magnetic beads. Before proceeding with analysis in the biochip platform, the hybridization between the capture probes and target DNA, in these assays, was assessed through optical microscopy and data treatment with ImageJ. When magnetically labelled ALU115 and ALU247 were spotted over gold substrates functionalized with TE (without DNA probes), a relative surface coverage of respectively 15.7 ± 0.7% and 27 ± 6% was obtained (Fig. 4I), suggesting that unspecific adsorption of the targets occurred, with a higher extent for ALU247, possibly due to its higher mass and increased number of nitrogen atoms in the DNA chain available for the unspecific adsorption on gold.34 The surface coverage for the interaction between complementary probe–target pairs (ALU115 with SH-capture115 and ALU247 with SH-capture247) at 1 μM concentration of DNA probes was identical to the surface coverage obtained when the pairs were cross-reacted (ALU115 with SH-capture247 and ALU247 with SH-capture115). These results are comparable to when no functionalization with DNA probes was performed. For a concentration three times higher than that of the DNA probes (3 μM), an increase in the surface coverage for ALU115 when paired with SH-capture115 was verified from 17.5 ± 2.5% to 21 ± 3.6%. For the cross-reaction of ALU115 with SH-capture247, the surface coverage decreased to 10 ± 0.9%. In the case of ALU247, the hybridization with SH-capture247 resulted in a coverage density of 27.0 ± 7.8% and a substantial decrease was verified when interacted with SH-capture115, from 32.7 ± 10.5 to 20.7 ± 5%. By increasing the concentration of the DNA probes to 5 μM, a surface coverage of 18.5 ± 2.6% and 6.0 ± 0.6% was obtained for ALU115 with SH-capture115 and with SH-capture247, respectively. For ALU247, the surface coverage was 26.6 ± 6.0% with SH-capture247 and 6.4 ± 0.5% with SH-capture115. To conclude, at a concentration of 5 μM, a proportionally higher surface coverage for complementary pairs of DNA probes and target DNA was obtained when compared to the non-specific pairs when cross-reacted. The concentration of probes was tested further at 10 μM and at this concentration, the unspecific interactions were shown to be practically inexistent; however, the specific interactions started to be compromised. The hybridization of ALU115 with SH-capture115 resulted in a surface coverage of 5 ± 0.2%, approximately three times less than for 5 μM. For the case of ALU247, the hybridization with SH-capture247 at this concentration, which resulted in a surface coverage of 18.0 ± 4.0%, also reduced in comparison to a concentration of 5 μM. The values reported here are specific to this system and assay conditions used in this study; however, the general trends presented in Fig. 4 should be expected for a wide range of parameters, including but not limited to the initial DNA target concentrations, probe–target kinetics, buffer's ionic strength or incubation times and temperature. An illustration summarizing the prevailing events for the different concentrations of probes is provided in Fig. 4II. Optical images from which the surface coverage percentages were calculated using ImageJ and are shown in Fig. S5† as an example of the formed spots for ALU115 when hybridized with SH-capture115 and SH-capture247. | ||
| Fig. 4 (I) Surface coverage (%) for various concentrations of probes SH-probe115 and SH-probe247 in interaction with magnetically labelled ALU115 and ALU247 (n ≥ 3). (II) Illustrations representing each situation and summarizing the prevailing event for each of the concentration of DNA probes. | ||
On-chip detection of ALU115 and ALU247
Droplets of 1 μL of SH-capture115 and SH-capture247 at a concentration of 5 μM (corresponding to 3 × 10¹² DNA probes per μL) were brought into contact with the biochip over the two columns of sensors, separately, before assembling with the microfluidic module. The measurement platform can detect in a single experiment the output signal of 24 bioactive sensors and of 6 reference sensors present in the biochip. For each sensor, a real-time acquisition of the signal was performed. Fig. 5 shows the signal acquisition obtained for six sensors, for the detection of magnetically labeled ALU115 at a concentration of 300 pM. Three of these sensors were functionalized with SH-capture115 and the other three with SH-capture247. For each of the sensors, the data presented in Fig. 5 correspond to the signal measured in real-time (Vmeasured) subtracted from the sensor's baseline signal (Vbaseline), acquired before the loading of the magnetic beads, and divided by the sensor's baseline (Vbaseline) (eqn (1)). | (1) |
 | ||
| Fig. 5 Signal response for the detection of ALU115 (300 pM) by sensors functionalized with complementary SH-probe115 (red curves) and sensors functionalized with non-complementary SH-probe247 (black curves). | ||
With these adjustments it was possible to normalize and compare in the same plot the signal output variation for various sensors (Voutput), as they all possess a different baseline signal but all vary proportionally to the presence of magnetic beads. In Fig. 5 the various phases of the measured signals are emphasized, starting with the (I) baseline acquisition (Vbaseline) of the sensor, acquired before the loading of the magnetic beads, followed by the (II) injection of the magnetically labelled DNA targets and (III) incubation to allow the targets to react with the DNA probes at the surface of the sensors. After incubation, (IV) a washing step is performed to remove unbounded or weakly bounded beads from the surface and, finally, (V) the binding signal (Vbinding), originated by specifically bounded beads, is acquired and subtracted from the baseline signal of the sensor (Vbaseline) to obtain the output signal variation (ΔVoutput). The ΔVoutput for each sensor is further subtracted from the output signal generated by the reference sensors (biologically inert) (ΔVoutput reference) to account for signal variations that may have been originated by thermal drifts at the surface of the sensors (ΔVcorrected) (eqn (2)).
| ΔVcorrected = ΔVoutput − ΔVoutput reference(Vrms/Vrms) | (2) |
The average of the normalized and corrected output signals (ΔVcorrected) for each of the interactions performed on-chip between the probes and targets is presented in Fig. 6. For each interaction a mean of at least 8 sensors was considered. The standard error of the mean for each case was calculated. When ALU115 (300 pM) was interacted with SH-capture115, a signal of 0.048 ± 0.0010 (Vrms/Vrms) was achieved, significantly higher than that when interacted with SH-capture247, with a signal of 0.003 ± 0.0002 (Vrms/Vrms). The hybridization of ALU247 (200 pM) with SH-capture247 resulted in a signal of 0.029 ± 0.0012 (Vrms/Vrms) while the same concentration of ALU247 with SH-capture115 resulted in 0.008 ± 0.0003 (Vrms/Vrms). Decreasing the concentration of ALU115 to 30 pM resulted in a signal of 0.018 ± 0.0050 (Vrms/Vrms) upon interaction with SH-capture115 while the interaction with SH-capture247 led to a signal of 0.001 ± 0.0001 (Vrms/Vrms). For a concentration of 20 pM of ALU247, a signal of 0.019 ± 0.0060 (Vrms/Vrms) was obtained for the pairing with SH-capture247. Finally, for the pairing with SH-capture115 the signal obtained was 0.004 ± 0.0010 (Vrms/Vrms). In Fig. S7,† a group of five sensors exhibiting the presence of magnetic particles is presented. The reference sensor is bioinert while the other four correspond to specific biointeractions between probe and target DNA after on-chip hybridization.
 | ||
| Fig. 6 On-chip detection of ALU115 and ALU247. Data obtained from the average of different sensors for each of the measurements (min = 8 sensors; max = 12 sensors). | ||
Discussion
This paper reports the optimization process for the detection of ALU115 and ALU247 with an integrated system based on magnetoresistive sensors as a promising lab-on-chip technology for cfDNA analysis. Its key features are portability, versatility for manufacturing and capability for integration with various electronic components and microfluidics, providing the system a superior autonomy when compared, for instance with conventional laboratory procedures.35The purification and amplification of the target fragments are still not integrated with the detection system but the strategy here employed serves as a basis for a total integrative device having in mind the required steps to generate magnetically labelled single-stranded fragments.
In the particular case of detection of the ALU elements, since the fragment ALU115 is truncated within ALU247, the detection and discrimination of both DNA targets required a particular optimization. ALU115 was generated by PCR but using a forward primer modified with a non-homologous 8 bp (GTAGGTAC) overhang, as a strategy to assimilate in ALU115 a distinctive signature from the generated ALU247 amplicons. SH-probe115 was designed with the complement of the 8 bp signature in order to target that region of ALU115 which in turn was absent in the ALU247 products. With this strategy, the complementarity between SH-capture115 and ALU115 was maintained while the complementarity between SH-capture115 and ALU247 was decreased by 40%. The 8 bp signature was balanced in terms of GC and AT contents to ensure stable binding between the probe and the complementary target. The reaction efficiency for ALU115 amplification was not affected by the 8 bp overhang as demonstrated by the amplification curves (Fig. S3 and S4†), product formation (verified on an agarose gel) and melting curve analysis (Fig. 5).
Regarding to the hybridization tests, it was important to optimize the biofunctionalization of the sensors so that specific complementary targets could be recognized at the surface of the sensors, simultaneously avoiding unspecific adsorption or cross-reactions. In particular, knowing that DNA adsorbs non-specifically to gold via interactions with nitrogen atoms from the DNA chains, this optimization was essential.36 Usually, blocking agents, such as bovine serum albumin (BSA), are used to diminish the amount of free sites at the surface and, therefore, used to prevent the unspecific interaction of target DNA with the gold atoms of the surface.37 As an alternative, in this work, a simple strategy was investigated based on the optimization of the DNA probe density at the surface so that no free gold spaces were available for the non-specific adsorption of DNA. It is well known that the density of DNA probes at the surface highly affects the amount of target DNA that can be captured.38 A highly dense monolayer of probes may inhibit the capture of complementary target DNA due to steric hindrance effects while a low dense monolayer may not be enough to specifically capture a good proportion of target DNA.34,39 These concepts were applied in this work so that the DNA probes themselves could act as blocking agents to non-complementary DNA but were still used at a concentration that allowed the recognition of complementary target DNA. At 1 μM, an equivalent surface coverage was verified for complementary probe–target pairs (ALU115 with SH-capture115 and ALU247 with SH-capture247) and for cross-reacted pairs (ALU115 with SH-capture247 and ALU247 with SH-capture115), indicating that the spots of beads may have been originated mainly through adsorption of the DNA targets on the gold substrates. An increased concentration of probes (3 μM) led to a decreased adsorption and increased specific binding as the surface coverage for the non-complementary pairs diminished in comparison to the complementary pairs. At 5 μM, the disparity between both complementary and cross-reacted pairs increased, meaning that the specific binding was favoured in comparison to the adsorbed fraction. The packaging of DNA probes, under this condition, seemed to have blocked the unspecific adsorption of DNA, to a greater extent, and limited the interaction of ALU247 with SH-capture115. At 10 μM, the amount of probes at the surface started competing with the specific hybridization amongst complementary probe–target pairs.
After optimization of the concentration of probes, the magnetic detection of both targets was validated in the picomolar range, using an array of magnetoresistive sensors as demonstrated in Fig. 5 and 6. Although in the past, the detection of DNA in the femtomolar range was performed, using magnetic fields to direct the magnetic particles towards the sensors, in this work, the limit of detection required for cfDNA analysis was circumvented by using pre-amplification of target DNA.25 This was performed to analyse the signal variation of the system for known concentrations of the targets, for the conditions tested in these assays. For evaluation in a clinical setting, the PCR would have to be stopped at the exponential phase of the reaction so that a correlation with initial DNA concentrations can be performed upon detection.
In conclusion, the strategy here utilized for the manipulation of the DNA target strands and, consequently, of the DNA capture probes, along with the optimization of their density at the surface, was effective in preventing the majority of the unspecific interactions without affecting specific target–probe recognition events. This strategy can be adapted to the detection of other truncated sequences or applied for the detection of polymorphisms or mutations as a method to decrease the specificity between cross-reactant species. In addition, the blocking of unspecific interactions solely by controlling the density of probes at the surface, in general, decreases the time and cost of any assay as no blocking solutions are required. Above all, these results demonstrate that MR sensors can effectively be used at the point-of-care for the detection of blood-based DNA biomarkers upon proper optimization of each particular case-study. For future work, a module for PCR amplification is expected to be implemented into the system so that the integration between amplification and detection can be achieved. Additionally required is a microfluidic module for purification of cfDNA from contaminants in the plasma, which affect the efficiency for target amplification and detection. Finally, we aim to detect other biomarkers, characteristic to specific types of cancer, in combination with ALU115 and ALU247, for a more inclusive analysis in cancer diagnostics, hopefully surpassing NGS devices in terms of speed, costs and portability.
Acknowledgements
The author Tomás Dias wants to thank FCT for his PhD grant SFRH/BD/81537/2011. INESC-MN acknowledges FCT funding through the IN associated laboratory (Pest-OE/CTM/LA0024/2011), and also the projects FCT-EXCL/CTM-NAN/0441/2012, PTDC/EEA-ELC/108555/2008, PTDC/CTM-NAN/110793/2009 and EXPL/EEI-ELC/1029/2012.References
- H. Schwarzenbach, D. S. B. Hoon and K. Pantel, Cell-free nucleic acids as biomarkers in cancer patients, Nat. Rev. Cancer, 2011, 11(6), 426–437 CrossRef CAS PubMed.
- S. Jahr, et al., DNA fragments in the blood plasma of cancer patients: quantitations and evidence for their origin from apoptotic and necrotic cells, Cancer Res., 2001, 61(4), 1659–1665 CAS.
- P. Anker, H. Mulcahy and M. Stroun, Circulating nucleic acids in plasma and serum as a noninvasive investigation for cancer: time for large-scale clinical studies?, Int. J. Cancer, 2003, 103(2), 149–152 CrossRef CAS PubMed.
- Y. I. Elshimali, et al., The clinical utilization of circulating cell free DNA (CCFDNA) in blood of cancer patients, Int. J. Mol. Sci., 2013, 14(9), 18925–18958 CrossRef CAS PubMed.
- L. A. Diaz Jr and A. Bardelli, Liquid biopsies: genotyping circulating tumor DNA, J. Clin. Oncol., 2014, 32(6), 579–586 CrossRef PubMed.
- F. Diehl, et al., Circulating mutant DNA to assess tumor dynamics, Nat. Med., 2008, 14(9), 985–990 CrossRef CAS PubMed.
- M. L. Metzker, Sequencing technologies-the next generation, Nat. Rev. Genet., 2010, 11(1), 31–46 CrossRef CAS PubMed.
- N. Ogasawara, et al., Feasibility and robustness of amplification refractory mutation system (ARMS)-based KRAS testing using clinically available formalin-fixed, paraffin-embedded samples of colorectal cancers, Jpn. J. Clin. Oncol., 2011, 41(1), 52–56 CrossRef PubMed.
- B. Vogelstein and K. W. Kinzler, Digital PCR, Proc. Natl. Acad. Sci. U. S. A., 1999, 96(16), 9236–9241 CrossRef CAS.
- Q. Liu and S. S. Sommer, Pyrophosphorolysis-activated polymerization (PAP): application to allele-specific amplification, BioTechniques, 2000, 29(5), 1072–1076 CAS , 1078, 1080 passim.
- D. Dressman, et al., Transforming single DNA molecules into fluorescent magnetic particles for detection and enumeration of genetic variations, Proc. Natl. Acad. Sci. U. S. A., 2003, 100(15), 8817–8822 CrossRef CAS PubMed.
- T. Forshew, et al., Noninvasive identification and monitoring of cancer mutations by targeted deep sequencing of plasma DNA, Sci. Transl. Med., 2012, 4(136), 136ra68 Search PubMed.
- A. Nekrutenko and J. Taylor, Next-generation sequencing data interpretation: enhancing reproducibility and accessibility, Nat. Rev. Genet., 2012, 13(9), 667–672 CrossRef CAS PubMed.
- E. Crowley, et al., Liquid biopsy: monitoring cancer-genetics in the blood, Nat. Rev. Clin. Oncol., 2013, 10(8), 472–484 CrossRef CAS PubMed.
- A. H. Wyllie, Glucocorticoid-induced thymocyte apoptosis is associated with endogenous endonuclease activation, Nature, 1980, 284(5756), 555–556 CrossRef CAS PubMed.
- F. Mouliere, et al., High fragmentation characterizes tumour-derived circulating DNA, PLoS One, 2011, 6(9), e23418 CAS.
- P. O. Delgado, et al., Characterization of cell-free circulating DNA in plasma in patients with prostate cancer, Tumor Biol., 2013, 34(2), 983–986 CrossRef CAS PubMed.
- N. Umetani, et al., Increased Integrity of Free Circulating DNA in Sera of Patients with Colorectal or Periampullary Cancer: Direct Quantitative PCR for ALU Repeats, Clin. Chem., 2006, 52(6), 1062–1069 CAS.
- W. Shi, et al., Prognostic value of free DNA quantification in serum and cerebrospinal fluid in glioma patients, J. Mol. Neurosci. MN, 2012, 46(3), 470–475 CrossRef CAS PubMed.
- O. J. Stotzer, et al., Diagnostic relevance of plasma DNA and DNA integrity for breast cancer, Tumor Biol., 2014, 35(2), 1183–1191 CrossRef PubMed.
- B. F. da Silva Filho, et al., Circulating cell-free DNA in serum as a biomarker of colorectal cancer, J. Clin. Pathol., 2013, 66(9), 775–778 CrossRef PubMed.
- J. Schotter, et al., Comparison of a prototype magnetoresistive biosensor to standard fluorescent DNA detection, Biosens. Bioelectron., 2004, 19(10), 1149–1156 CrossRef CAS PubMed.
- D. L. Graham, H. A. Ferreira and P. P. Freitas, Magnetoresistive-based biosensors and biochips, Trends Biotechnol., 2004, 22(9), 455–462 CrossRef CAS PubMed.
- D. A. Hall, et al., GMR biosensor arrays: a system perspective, Biosens. Bioelectron., 2010, 25(9), 2051–2057 CrossRef CAS PubMed.
- D. Issadore, et al., Magnetic sensing technology for molecular analyses, Lab Chip, 2014, 14(14), 2385–2397 RSC.
- R. S. Gaster, et al., Quantification of protein interactions and solution transport using high-density GMR sensor arrays, Nat. Nanotechnol., 2011, 6(5), 314–320 CrossRef CAS PubMed.
- W. Wang, et al., Magnetoresistive performance and comparison of supermagnetic nanoparticles on giant magnetoresistive sensor-based detection system, Sci. Rep., 2014, 4, 5716 Search PubMed.
- D. A. Hall, et al., A 256 pixel magnetoresistive biosensor microarray in 0.18 μm CMOS, IEEE J. Solid-State Circuits, 2013, 48(5), 1290–1301 CrossRef PubMed.
- E. Fernandes, et al., A bacteriophage detection tool for viability assessment of Salmonella cells, Biosens. Bioelectron., 2014, 52, 239–246 CrossRef CAS PubMed.
- V. C. Martins, et al., Femtomolar limit of detection with a magnetoresistive biochip, Biosens. Bioelectron., 2009, 24(8), 2690–2695 CrossRef CAS PubMed.
- E. Albisetti, et al., Photolithographic bio-patterning of magnetic sensors for biomolecular recognition, Sens. Actuators, B, 2014, 200, 39–46 CrossRef CAS.
- G. Lee, et al., Single-molecule analysis reveals three phases of DNA degradation by an exonuclease, Nat. Chem. Biol., 2011, 7(6), 367–374 CrossRef CAS PubMed.
- V. Gehanno, et al., Ion beam deposition of Mn–Ir spin valves, IEEE Trans. Magn., 1999, 35(5), 4361–4367 CrossRef CAS.
- H. Pei, et al., Scaffolded biosensors with designed DNA nanostructures, NPG Asia Mater., 2013, 5, e51 CrossRef CAS.
- J. Germano, et al., A portable and autonomous magnetic detection platform for biosensing, Sensors, 2009, 9(6), 4119–4137 CrossRef CAS PubMed.
- T. M. Herne and M. J. Tarlov, Characterization of DNA Probes Immobilized on Gold Surfaces, J. Am. Chem. Soc., 1997, 119(38), 8916–8920 CrossRef CAS.
- S. Taylor, et al., Impact of surface chemistry and blocking strategies on DNA microarrays, Nucleic Acids Res., 2003, 31(16), e87 CrossRef PubMed.
- D. S. Dandy, P. Wu and D. W. Grainger, Array feature size influences nucleic acid surface capture in DNA microarrays, Proc. Natl. Acad. Sci. U. S. A., 2007, 104(20), 8223–8228 CrossRef CAS PubMed.
- A. W. Peterson, R. J. Heaton and R. M. Georgiadis, The effect of surface probe density on DNA hybridization, Nucleic Acids Res., 2001, 29(24), 5163–5168 CrossRef CAS PubMed.
Footnote |
| † Electronic supplementary information (ESI) available. See DOI: 10.1039/c5ay01587a |
| This journal is © The Royal Society of Chemistry 2016 |