
Multilayer and multichannel membrane filtration for separation and preconcentration of trace analytes and its application in spectral analysis
Wei
Li
a,
Haiting
Wang
b,
Wei
Jiang
b,
Lei
Wang
a,
Ruoqiu
Zhang
a,
Hui
Li
c,
Ting
Wu
a and
Yiping
Du
*a
aShanghai Key Laboratory of Functional Materials Chemistry, Research Centre of Analysis and Test, East China University of Science and Technology, Shanghai 200237, P. R. China. E-mail: yipingdu@ecust.edu.cn; Tel: +86 21 64250551; Fax: +86 21 64252947T
bTechnical Center for Industrial Products and Raw Materials Inspection and Testing, Shanghai Entry-Exit Inspection & Inspection and Quarantine Bureau, Shanghai 200135, P. R. China
cDepartment of Science and Engineering, Dehong Teachers College, Mangshi 678400, P. R. China
First published on 16th November 2015
Abstract
Membrane filtration (microfiltration) as a solid-phase extraction technique with features of rapidity, simplicity of operation, low cost, and high enrichment efficiency has received considerable attention and has been widely used for separating and enriching analytes from fluids. On the basis of our previous study, a very simple but effective mode of multilayer membrane filtration-enrichment process was introduced into the case of quantitative detecting of two or more analytes in mixture samples to achieve the target of separating and concentrating analytes simultaneously. A case study was carried out to assess this method utilizing the carcinogenic dyes rhodamine B (RhB) and acid orange 7 as model analytes. Under the optimal conditions, linearity of the calibration curve based on the Kubelka–Munk function was achieved in the concentration range of 3–30 μg L−1 with the correlation coefficients (R2) of 0.9982 and 0.9952 for RhB and acid orange 7, respectively. Good repeatability was achieved utilizing 30, 10 and 5 μg L−1 solutions with the relative standard deviations (RSDs) of 3.1–6.4% for RhB and 2.4–5.8% for acid orange 7. The presented method was successfully employed to simultaneously quantify RhB and acid orange 7 in soft drink and candy samples.
1. Introduction
Despite the significant advances in analytical instruments in recent years, sample preparations, such as separation and preconcentration, are still the most important and crucial procedures in a whole analytical process. Membrane filtration (microfiltration) is a pressure-driven solid-phase extraction technique with features of rapidity, simplicity of operation, low cost, and high enrichment efficiency. It is often employed to separate and concentrate micron-sized and low concentration particles from fluids with microscopic pores (0.1–10 micrometer) in membrane filters. The mechanism of the membrane filtration-enrichment is primarily sieving when the size of particles of the concentrated compound is larger than the pore size of the membrane filter used. If a particle is not much smaller than the pore, then as it passes near the pore there is a definite probability that part of the particle will touch the filter matrix. If adhesive forces are strong enough, the particle will be trapped. In the case of smaller particles, it is presumably attributed to adsorption to the filter surface and in the pore, which is caused by the interactions, including van der Waals forces, electrostatic interaction, hydrophobic interaction, π–π interaction and hydrogen bonding, between the analyte molecule and the filter matrix.1–3 It has received considerable attention and has been widely used for the separation and preconcentration of trace metallic ions after chromogenic reactions4–10 and for several organic compounds.11–18 Unlike most of the studies, our group4,9,11,12 simplified the detection process by omitting the elution step and directly measuring the diffuse reflectance spectrum of the membrane filter concentrated analytes, i.e. on-line spectroscopic determination. This could avoid the use of eluents and also the influence caused by the elution operation. More importantly, without the eluting process, the dilution of the analytes with solvents can be prevented completely, therefore, the enrichment factor is usually very high.In our previous study,13 a multichannel device was designed for the membrane filtration-enrichment process, which contains six channels and can enrich six samples simultaneously at different positions on a membrane filter. With the assistance of the multichannel device, the poor reproducibility of enrichment and on-line detection processes resulting from the differences between membrane filters in the traditional method19–21 has been much improved.
However, in the case of simultaneously detecting two or more analytes whose absorbance peaks are close or even overlapped in one mixture sample, it is difficult to quantitatively determine the mixtures directly after routine membrane filtration. Sample separation is needed to eliminate the influence arising from each analyte. In addition, there is another situation wherein the two or more analytes could not all be enriched in one membrane filter or wherein their most suitable membrane filters are not the same. Thus, effectively simultaneous determination could not be fulfilled during a one membrane filtration process. In consideration of these circumstances, a very simple but effective mode of multilayer membrane filtration was introduced into the multichannel membrane filtration-enrichment process to achieve the target of separating and enriching analytes simultaneously, and extending the use of membrane filtration-enrichment. The principle of the multilayer membrane filtration mode is that of filtering the sample mixture solution through two or more different stacked membrane filters at one time. The analytes in the mixture solution will be captured by different membrane filters because of the selectivity of membrane filters. Then, the spectrum of each analyte can be measured with different membrane filters. In this way, the separation of the mixture is conveniently and easily achieved through one filtration process. In addition, the application of the proposed method can be extended to the analysis of real samples, which often have low concentration levels of analytes and high concentrations of interfering matrix components to reduce or remove compounds initially present in samples that interfere with the detection method.
This study was conducted on the basis of our previous study. Two carcinogenic industrial dyes, rhodamine B (RhB) and acid orange 7, which are banned as food additives by current legislation in many countries, were used as model analytes to evaluate the effectiveness of the presented method.
2. Experimental
2.1 Chemicals and reagents
All chemicals and reagents used were of analytical pure grade and used without further purification. Rhodamine B was purchased from Shanghai Yuanye Biology and Science Co. Ltd., China. Acid orange 7 was purchased from Shanghai Crystal Pure Biological Technology Co. Ltd., China. Mixed cellulose esters (MCA), cellulose acetate (CA), nylon, polyethersulfone (PES) and polytetrafluoroethylene (PTFE) membrane filters used in the present study were purchased from Xingya (Shanghai Xingya Purification Materials Factory, China) with the pore size of 0.1 μm and 50 mm in diameter.Standard stock solutions of RhB and acid orange 7 with the concentration of 100 μg mL−1 were prepared by dissolving the powdered reagents with ultra-pure water and stored in a refrigerator. All sample solutions were obtained by stepwise dilution of the stock solution with ultra-pure water.
2.2 Apparatus
A miniature fiber optic UV-Visible spectrometer (USB2000+, Ocean Optics (Shanghai) Co. Ltd., China) equipped with an integrating sphere accessory was used to obtain the UV-Vis spectral data from the membrane filter. A model PHS-25 pH meter (Mettler Toledo Instrument (Shanghai) Co. Ltd., China) was used for pH measurement. Ultra-pure water was obtained from an ultra-pure water purification system (SARTORIUS Arium 611 DI, Germany, 18.2 MΩ cm). Liquid chromatography mass spectrometry (LC-MS, Waters, Xevo G2-S QTof, USA) was utilized to detect the contents of RhB and acid orange 7 for evaluating the enrichment efficiency. An SHB-III Vadose water vacuum pump (Shanghai Weikai Instrument Equipment Co. Ltd., China) was used for the membrane filtration-enrichment.The membrane filtration-enrichment process was carried out by the homemade six-channel membrane filtration-enrichment device utilized in our previous study.13 The selected membrane filters were stacked up and placed between the multichannel solution importer and the filtration device (Fig. 1).
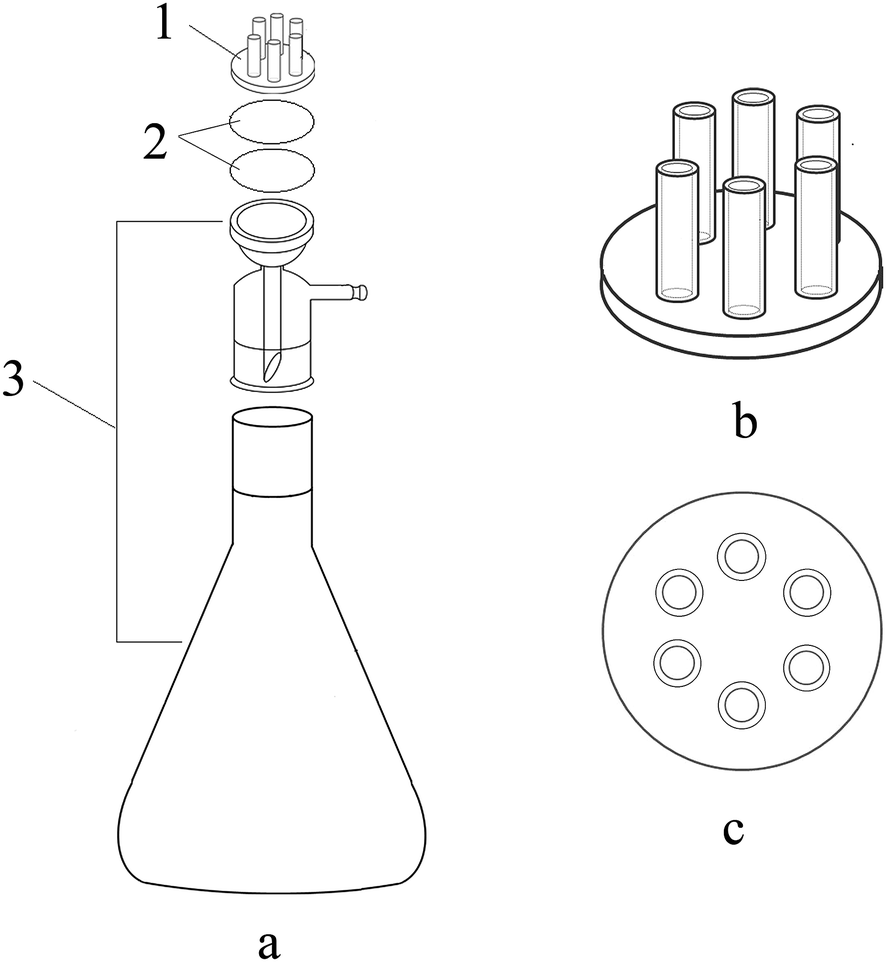 | ||
| Fig. 1 (a) Schematic of the multichannel membrane filtration-enrichment device (1) acrylic multichannel solution importer; (2) membrane filters; (3) filtration device. (b) Schematic of the acrylic multichannel solution importer. (c) Top view of the multichannel solution importer. | ||
2.3 Experiment procedure
For the multilayer membrane filtration-enrichment procedure under optimal conditions, an MCA membrane filter was stacked above a nylon membrane filter and they were placed between the multichannel solution importer and the filtration device. An 18 mL aliquot of sample solution containing RhB and acid orange 7 (without pH adjustment) was loaded into the six-channel membrane filtration-enrichment device and passed through the membrane filters under suction with a vacuum pump at a vacuum degree of 0.09 MPa. The analyte RhB was adsorbed by the upper MCA membrane filter and acid orange 7 was adsorbed by the nylon membrane filter below. After filtration, the membrane filters were air dried and the UV-Vis diffuse reflectance spectra were obtained on-line (without elution) for quantitative analysis. Absorbance peaks at 546 nm and 485 nm were considered for RhB and acid orange 7, respectively.3. Result and discussion
3.1 Selection of membrane filter type
The selection of suitable membrane filters is of great importance to achieve the goal of separating and enriching RhB and acid orange 7. The primary requirement of the membrane filter for the proposed multilayer filtration is that of enriching analytes selectively. Five commonly used membrane filters, i.e. MCA, CA, nylon, PES, and PTFE, were tested with RhB and acid orange 7 individual solutions. The UV-Vis diffuse reflectance spectrum of each membrane filter concentrated RhB or acid orange 7 was measured. According to the results, the PTFE membrane filter can barely capture both RhB and acid orange 7, and PES membrane filter shows a slight capacity for enriching the two analytes. Both MCA and CA membrane filters can enrich RhB, and the former provides the strongest absorbance, while they both show negligible capacities for enriching acid orange 7. On the other hand, a nylon membrane filter is capable of collecting only acid orange 7. Therefore, in subsequent experiments, MCA and nylon membrane filters were selected as a suitable set for enriching RhB and acid orange 7, respectively.3.2 Effect of pH
The variation of sample solution pH can lead to the deprotonation or the protonation of a neutral molecule, which will further result in the change of solubility of analytes and the efficiency of the membrane filtration-enrichment procedure. To obtain an appropriate pH for both RhB and acid orange 7, the effect of pH of each sample solution was studied within the range of 1–11, which was adjusted using HCl and NaOH solutions, respectively. As shown in Fig. 2, under acid conditions, the absorbance of RhB shows a gradual increasing tendency, whereas the suitable pH for acid orange 7 is around neutral (pH 7). Taking the sensitivities of detecting both RhB and acid orange 7 into account, a pH of 4–6 was suitable for this method. The pH of the sample solutions was about 5.6. For simplicity, the pH of the sample solutions was not adjusted in this study.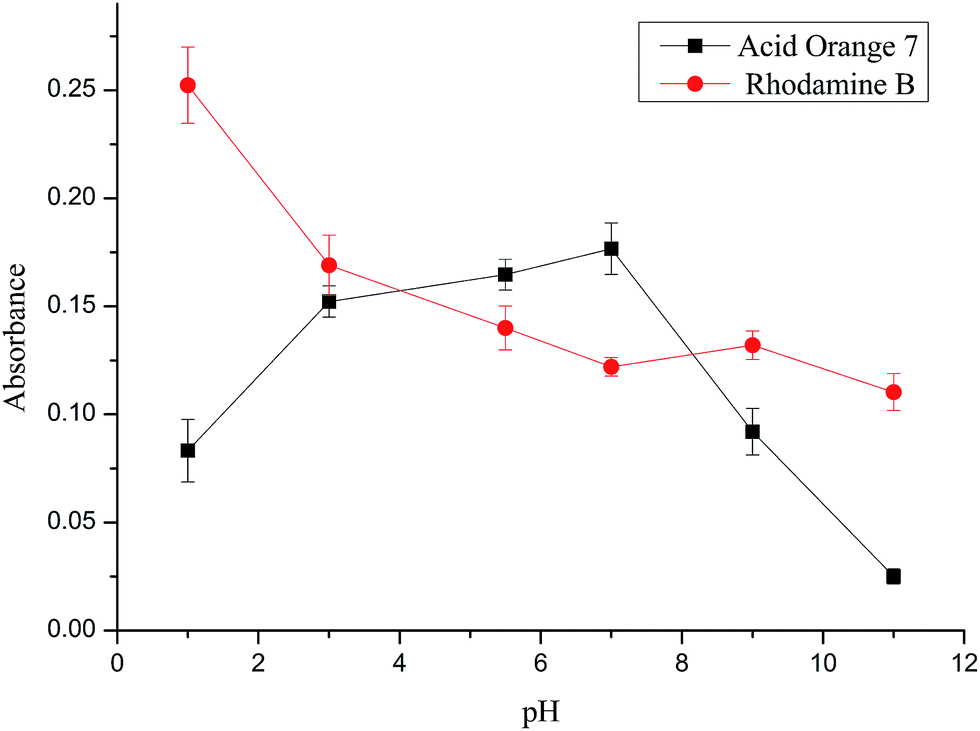 | ||
| Fig. 2 Effect of pH on absorbance of RhB at 546 nm and acid orange 7 at 485 nm. Experiment conditions: concentration of RhB and acid orange 7, 30 μg L−1, vacuum degree, 0.05 MPa; sample volume of 15 mL for RhB and 18 mL for acid orange 7. | ||
3.3 Effect of sample volume
When selecting a suitable sample volume, both the adsorption capacity of the membrane filter and the operation time should be taken into account besides the sensitivity. Sample mixture solutions with different volumes in the range of 5–30 mL were filtered under constant conditions. The results in Fig. 3 show that as the volume increases, there is a significant increase in the absorbance of acid orange 7. Moreover, for RhB, an increase in the absorbance occurs when the volume increases from 5 to 15 mL, and only a slight increase of absorbance is observed when the volume is more than 15 mL. Moreover, the operation time for 30 mL was about 10 min, which was more than twice that of 15 mL. To reach a compromise, 18 mL of sample mixture solution was adopted in further experiments.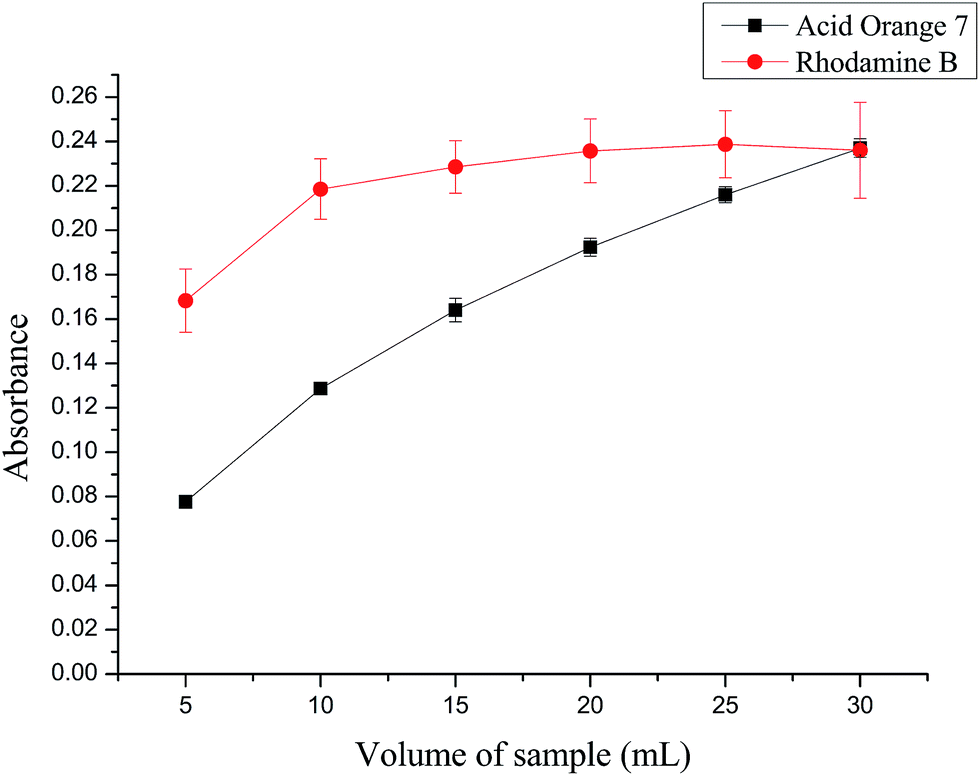 | ||
| Fig. 3 Effect of sample volume on absorbance of RhB at 546 nm and acid orange 7 at 485 nm. Experiment conditions: concentration of RhB and acid orange 7, 30 μg L−1; vacuum degree, 0.095 MPa. | ||
3.4 Effect of vacuum degree
The vacuum degree of a vacuum pump has an immediate impact on the membrane flux and the performance of interactions between analytes and the membrane filter, thus affecting the efficiency of filtration. The effect of vacuum degree was investigated within the range of 0.05–0.095 MPa with the sample mixture solution. The results in Fig. 4 illustrate that as the vacuum degree increases, the absorbance of membrane filter concentrated RhB decreases gradually because of the increase of membrane flux, whereas that of acid orange 7 increases very slightly. This may be explained by the fact that a low vacuum degree will lead to a low membrane flux and provide enough time for acid orange 7 to interact with the upper MCA membrane filter, and this ultimately results in a negligible enrichment of acid orange 7 on the MCA membrane filter. When the vacuum degree is or above 0.09 MPa, the time for interaction is not sufficient and acid orange 7 is directly enriched on the nylon membrane filter, skipping the interaction with MCA membrane filter. Thus, the absorbance values of the two analytes remain about the same. Considering both the stability and the operation time, the vacuum degree of 0.09 MPa was selected.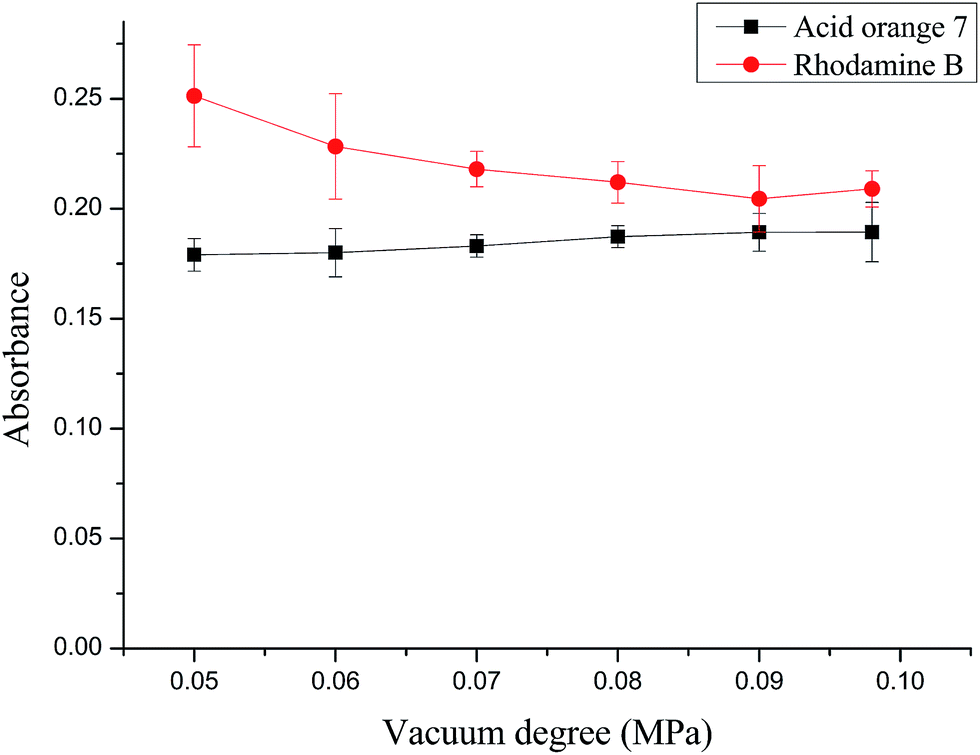 | ||
| Fig. 4 Effect of vacuum degree on absorbance of RhB at 546 nm and acid orange 7 at 485 nm. Experiment conditions: concentration of RhB and acid orange 7, 30 μg L−1, sample volume, 18 mL. | ||
3.5 Separation and enrichment performance of the method
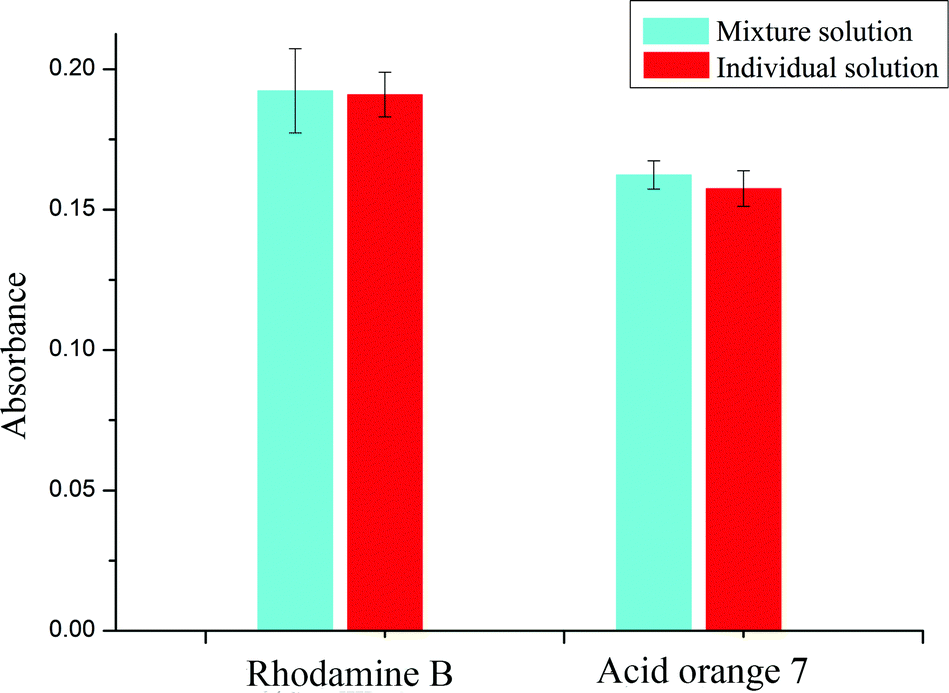
Enrichment efficiency is an intuitional criterion to evaluate the performance of separation and preconcentration of RhB and acid orange 7. The enrichment efficiency of the present method was assessed with 30 μg L−1 RhB and acid orange 7 individual solutions and their mixed solution with the help of LC-MS. The analytical results of LC-MS show that the enrichment efficiencies of RhB by the upper MCA membrane filter for individual and mixed solutions are 93% and 95%, respectively. In addition, those of acid orange 7 by the lower nylon membrane filter are all above 98%.The corresponding UV-Vis diffuse reflectance spectra of membrane filters processed with 30 μg L−1 RhB and acid orange 7 individual solutions and their mixed solution were measured and are illustrated in Fig. 5. According to Fig. 5, the values of absorbance of individual and mixed solutions for RhB are almost the same. For acid orange 7, the absorbance of a mixed solution is just a little higher than that of an individual solution. Therefore, it can be regarded that the two analytes do not affect the enrichment of each other.
 | ||
| Fig. 5 UV-Vis diffuse reflectance spectra of MCA and nylon membrane filters after filtering with 30 μg L−1 RhB and acid orange 7 individual solutions and their mixture solution (absorbance at 546 nm for RhB and 485 nm for acid orange 7; sample volume, 18 mL; vacuum degree, 0.09 MPa). | ||
The UV-Vis spectra of 1000 μg L−1 RhB, acid orange 7 and their mixture solutions were directly measured with a 1 cm cell and are plotted in Fig. 6. The UV-Vis diffuse reflectance spectra of membrane filters after the multilayer filtration with 25 μg L−1 mixture solution are also plotted. As shown in Fig. 6, the absorbance peak of RhB in solution is at 553 nm and that of acid orange 7 is at 485 nm. The two absorbance peaks are so close that the absorbance peak of acid orange 7 in the spectrum of the mixture is covered by that of RhB. Therefore, it is difficult to quantitatively analyze acid orange 7 without separation. However, with the help of the multilayer filtration process, individual spectra of the two analytes were obtained from different membrane filters. Because of interaction with the adsorbent, the spectra of analytes adsorbed on the membrane filters is more or less different from those of the free molecules in solution.22 On the other hand, the values of absorbance of the two analytes adsorbed on the membrane filters have significant increases compared to that in solution. These results indicate that after introducing the multilayer membrane filtration mode, the separation and enrichment of the two analytes can easily be implemented.
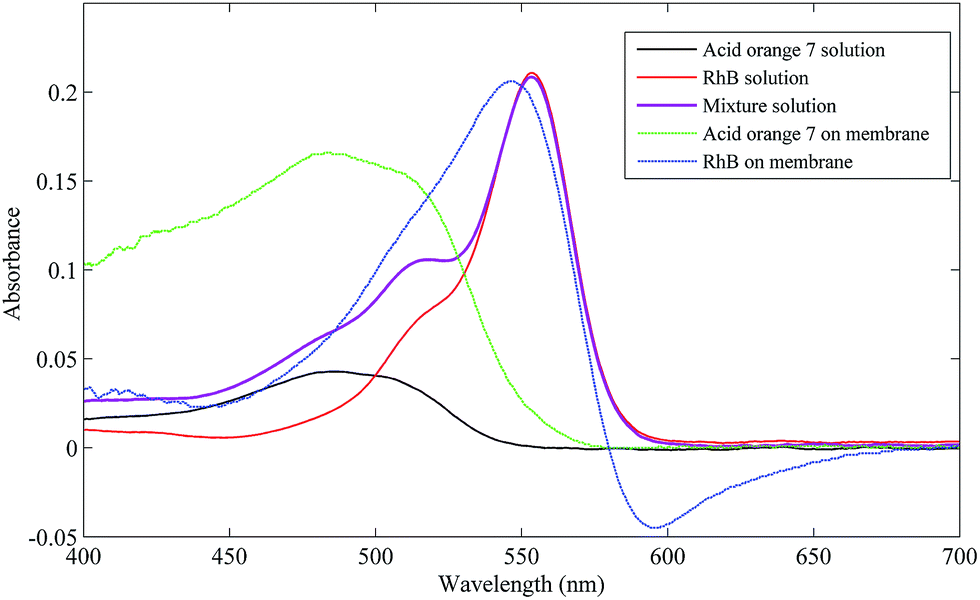 | ||
| Fig. 6 UV-Vis spectra of 1000 μg L−1 RhB, acid orange 7 and their mixture solutions. UV-Vis diffuse reflectance spectra of MCA and nylon membrane filters after filtering with 25 μg L−1 mixture solution by the multilayer mode described (sample volume, 18 mL; vacuum degree, 0.09 MPa). | ||
3.6 Analytical performance of the method
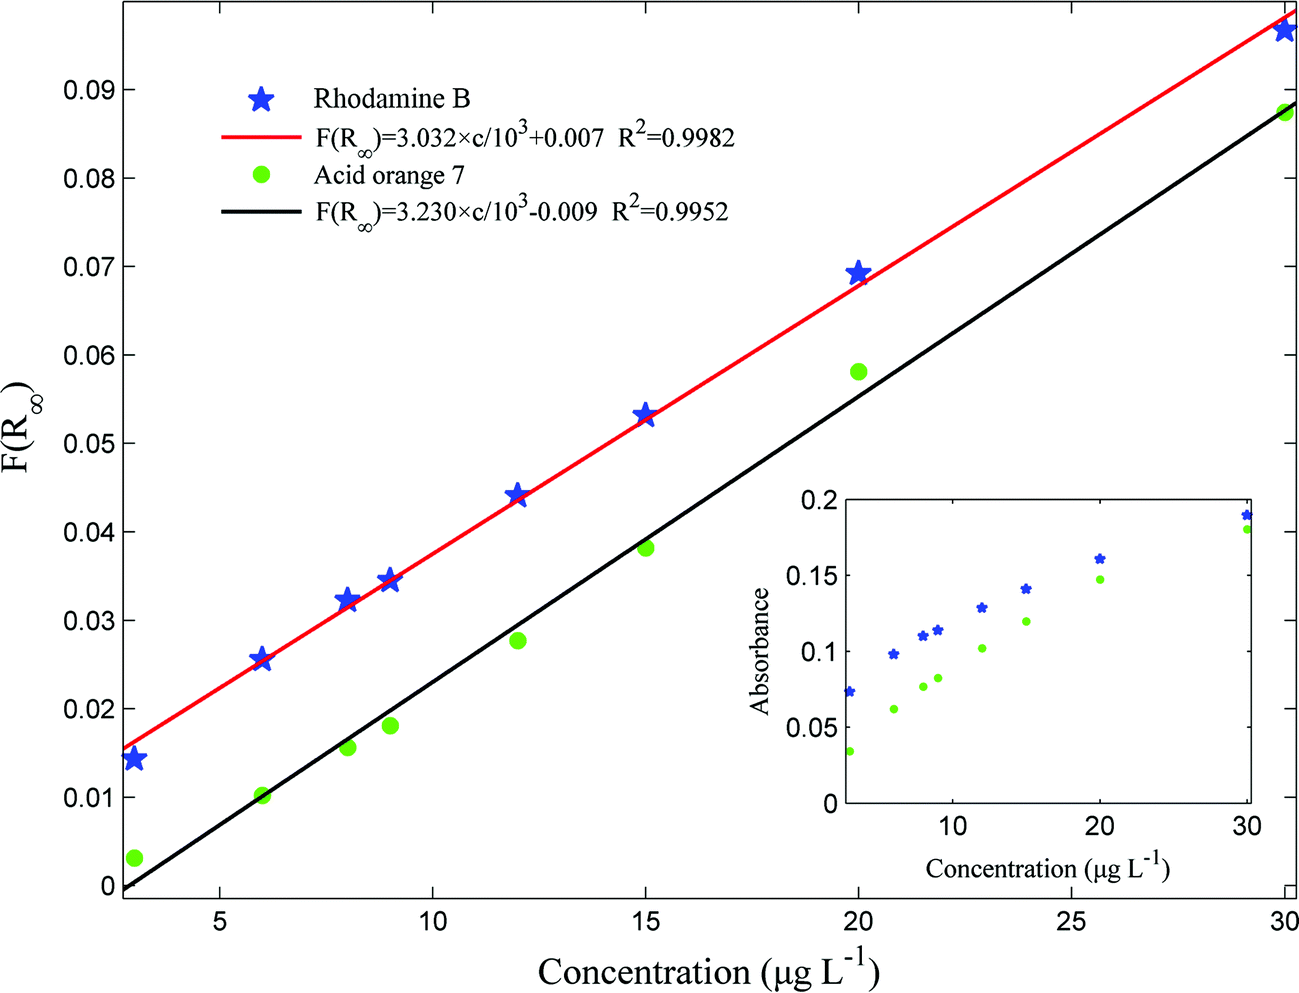
The quantitative relationship between the concentration of RhB in solution and the absorbance of the membrane filter has been investigated in our previous study.13 Linear models used in this study were also established by the Kubelka–Munk function, which reads as follow:23,24| F(R∞) = (1 − 10−A)2/2 × 10A = bc |
In the present study, a series of experiments were conducted with RhB and acid orange 7 mixture solutions in the concentration range of 3–30 μg L−1 and relevant absorbance peaks at 546 nm for RhB and 485 nm for acid orange 7 were measured and plotted in Fig. 7. From Fig. 7, it follows that linearities of calibration curves for the analytes are achieved only at low concentration levels (here they are 3–9 μg L−1 for RhB and 3–20 μg L−1 for acid orange 7 with the correlation coefficients (R2) of 0.9895 and 0.9896, respectively), which is consistent with our previous study.13 The limits of detection, defined as LOD = 3Sb/m (where Sb and m are standard deviation of the blank solution and slope of the calibration curve, respectively) are calculated to be 0.20 μg L−1 and 0.24 μg L−1 for RhB and acid orange 7, respectively. Similarly, when c is fitted with A by the Kubelka–Munk function, it provides linear curves with R2 of 0.9982 for RhB and 0.9952 for acid orange 7. Under the optimal conditions, the repeatability of the proposed method was evaluated using 3, 9 and 20 μg L−1 mixture solutions. The relative standard deviations (RSDs) were in acceptable ranges of 3.1–6.4% for RhB and 2.4–5.8% for acid orange 7. The comparisons of the proposed method with other studies in some literatures are given in Table 1, which indicates the good performance of the presented method. As mentioned before, the sensitivity of this method is greatly improved, because the on-line determination process excludes the elution operation, which completely prevents the dilution of the analytes with solvents, and retains the high enrichment factor. In addition, the results in Table 1 illustrate that the repeatability of this method is close to other methods and can meet the requirements of trace analysis.
 | ||
| Fig. 7 The relationship of the values of the Kubelka–Munk function F(R∞) and RhB and acid orange 7 concentrations in solution in the range of 3–30 μg L−1. The relationship of the absorbance and concentrations of RhB and acid orange 7 in solution (inset). Experiment conditions: vacuum degree, 0.09 MPa; sample volume, 18 mL. | ||
| Detection system | Analyte | Pretreatment | LOD (μg L−1) | RSD (%) | References |
|---|---|---|---|---|---|
| UV-Visible spectrophotometry | Rhodamine B | Cloud point extraction | 1.3 | 2.40 | 25 |
| UV-Visible spectrophotometry | Rhodamine B | Solid phase extraction (SPE) | 3.14 | 5.0 | 26 |
| UV-Visible spectrophotometry | Rhodamine B | Dispersive liquid–liquid microextraction | 6.1 | 0.9–4.1 | 27 |
| UV-Visible spectrophotometry | Sudan orange G | Membrane filtration | 4.9 | 4.3 | 28 |
| Ion-interaction HPLC | Acid orange 7 | Solid phase extraction | 7 | — | 29 |
| UPLC | Acid orange 7 | Microwave assisted extraction-SPE | 2.16 | — | 30 |
| UV-Visible spectrophotometry | Rhodamine B | Multilayer and multichannel membrane filtration | 0.20 | 3.1–6.4 | Present study |
| Acid orange 7 | 0.24 | 2.4–5.8 |
3.7 Real sample analysis
The effects of the potential interfering compounds, which usually exist in real samples, have been investigated previously. The common inorganic ions will not affect the membrane filtration-enrichment process.13 In this study, the proposed method was employed to quantify RhB and acid orange 7 in soft drink and candy samples to assess its accuracy and applicability. As a consequence of high contents of carbohydrates in drinks, these usually macromolecular compounds will occupy the pore spaces of the membrane filter and thereby influence the filtration. The soft drink applied in this study was diluted by 5 times with ultra-pure water. Moreover, besides carbohydrates in candy, there are several additives, such as thickener, emulgator and coating agent, which have strong impacts on the filtration. Thus, candy samples were prepared by dissolving 1 g with 5 mL ultra-pure water and purified by filtering through a PTFE syringe filter for five times and then diluted with ultra-pure water to 100 mL. No RhB and no acid orange 7 were detected in the two real samples even though sample solutions with large volumes were processed. Consequently, the soft drink and candy samples were spiked with RhB and acid orange 7 at the concentrations of 5, 10 and 15 μg L−1 to prepare man-made samples. Recovery experiments were conducted and the results are listed in Table 2. The recoveries of the target analytes are in acceptable ranges of 92.8–109.7% for RhB and 90.5–111.5% for acid orange 7 with all RSDs (n = 3) less than 9.2%, which verifies the feasibility of the current method.| Sample | Analytes added | Rhodamine B found | Recoverya (%) | RSD (%) | Acid orange 7 found | Recoverya (%) | RSD (%) |
|---|---|---|---|---|---|---|---|
| a Average of three independent measurements. | |||||||
| Soft drink (μg L −1 ) | |||||||
| — | ND | — | — | ND | — | — | |
| 25 | 23.2 | 92.8 | 7.2 | 24.9 | 99.8 | 2.2 | |
| 50 | 54.8 | 109.7 | 9.2 | 53.2 | 106.4 | 1.8 | |
| 75 | 76.9 | 102.6 | 5.9 | 83.6 | 111.5 | 3.3 | |
![[thin space (1/6-em)]](https://www.rsc.org/images/entities/char_2009.gif) |
|||||||
| Candy (μg g −1 ) | |||||||
| — | ND | — | — | ND | — | — | |
| 0.5 | 0.52 | 105.5 | 7.8 | 0.51 | 101.5 | 4.3 | |
| 1.0 | 1.04 | 105.7 | 8.2 | 0.91 | 90.5 | 1.2 | |
| 1.5 | 1.48 | 98.2 | 1.6 | 1.45 | 96.9 | 3.1 | |
4. Conclusions
In summary, we have initially presented a novel mode of multilayer membrane filtration, which can provide a simple way to simultaneously separate and concentrate analytes in mixture samples and extend the application of membrane filtration-enrichment. The proposed approach was evaluated by detecting rhodamine B and acid orange 7 in their mixture samples as a case study. The main parameters influencing the multilayer and multichannel filtration process were thoroughly optimized. The results reveal that the developed multilayer mode is facile and efficient. With its help, analytes in the mixture solution are separated and collected by different membrane filters because of the selectivity of membrane filters. Thus, the individual spectrum of each analyte is easily obtained from the different membrane filters. Good sensitivity and repeatability of the multichannel membrane filtration-enrichment technique, which have been proved in our previous study, were also obtained in this method. Moreover, the applicability of the method can also be extended to real sample analysis to reduce or remove the interference of matrix or other compounds initially present in samples.Acknowledgements
This study was supported by the Shanghai Inspection & Inspection and Quarantine Bureau (HK012-2015).References
- S. Chang, T. David Waite, A. I. Schäfer and A. G. Fane, Environ. Sci. Technol., 2003, 37, 3158–3163 CrossRef CAS PubMed.
- A. I. Schafer, I. Akanyeti and A. J. Semiao, Adv. Colloid Interface Sci., 2011, 164, 100–117 CrossRef PubMed.
- T. D. Brock, Membrane filtration: a user's guide and reference manual, Science Tech, 1983 Search PubMed.
- J. Iqbal, C. Yin, J. Geng, X. Li, X. Li, Y. Du and B. X. Liu, Microchim. Acta, 2012, 177, 195–200 CrossRef CAS.
- I. Narin and M. Soylak, Anal. Chim. Acta, 2003, 493, 205–212 CrossRef CAS.
- I. M. Raimundo and R. Narayanaswamy, Sens. Actuators, B, 2003, 90, 189–197 CrossRef CAS.
- Y. Takahashi, H. Kasai, H. Nakanishi and T. M. Suzuki, Angew. Chem., Int. Ed. Engl., 2006, 45, 913–916 CrossRef CAS PubMed.
- U. Divrikli, A. A. Kartal, M. Soylak and L. Elci, J. Hazard. Mater., 2007, 145, 459–464 CrossRef CAS PubMed.
- C. H. Yin, J. Iqbal, H. L. Hu, B. X. Liu, L. Zhang, B. L. Zhu and Y. P. Du, J. Hazard. Mater., 2012, 233, 207–212 CrossRef PubMed.
- Z. A. Alothman, Y. E. Unsal, M. Habila, M. Tuzen and M. Soylak, Desalin. Water Treat., 2015, 53, 3457–3465 CrossRef CAS.
- X. H. Yang, B. X. Liu, T. Wu and Y. P. Du, Anal. Lett., 2013, 46, 2410–2420 CrossRef CAS.
- G. Chen, H. Hu, T. Wu, P. Tong, B. Liu, B. Zhu and Y. Du, Food Control, 2014, 35, 218–222 CrossRef CAS.
- W. Li, L. Wang, P. J. Tong, J. Iqbal, X. F. Zhang, X. Wang and Y. P. Du, RSC Adv., 2014, 4, 52123–52129 RSC.
- V. Vasquez, M. E. Baez, M. Bravo and E. Fuentes, Anal. Bioanal. Chem., 2013, 405, 7497–7507 CrossRef CAS PubMed.
- A. Canas, P. Richter and G. M. Escandar, Anal. Chim. Acta, 2014, 852, 105–111 CrossRef CAS PubMed.
- Z. A. AlOthman, Y. E. Unsal, M. Habila, A. Shabaka, M. Tuzen and M. Soylak, Food Chem. Toxicol., 2012, 50, 2709–2713 CrossRef CAS PubMed.
- K. Chajara, C. H. Andersson, J. Lu, E. Widenkvist and H. Grennberg, New J. Chem., 2010, 34, 2275–2280 RSC.
- Z. Y. Yeo, S. P. Chai, P. W. Zhu, S. K. Mah and A. R. Mohamed, New J. Chem., 2015, 39, 4135–4140 RSC.
- J. S. Fritz, M. P. Arena, S. A. Steiner and M. D. Porter, J. Chromatogr. A, 2003, 997, 41–50 CrossRef CAS PubMed.
- M. P. Arena, M. D. Porter and J. S. Fritz, Anal. Chim. Acta, 2003, 482, 197–207 CrossRef CAS.
- M. P. Arena, M. D. Porter and J. S. Fritz, Anal. Chem., 2002, 74, 185–190 CrossRef CAS PubMed.
- G. Kortum and W. Braun, Angew. Chem., Int. Ed., 1963, 2, 333–341 CrossRef.
- P. Kubelka and F. Munk, Zeitschrift fur Technische Physik, 1931, 12, 596–601 Search PubMed.
- P. D. G. Kortüm, Reflectance Spectroscopy: Principles, Methods, Applications, Springer, Berlin Heidelberg, 1969, pp. 5–216 Search PubMed.
- N. Pourreza, S. Rastegarzadeh and A. Larki, Talanta, 2008, 77, 733–736 CrossRef CAS.
- M. Soylak, Y. E. Unsal, E. Yilmaz and M. Tuzen, Food Chem. Toxicol., 2011, 49, 1796–1799 CrossRef CAS PubMed.
- W. Li, X. Zhang, P. Tong, T. Wu, H. Hu, M. Wang and Y. Du, Spectrochim. Acta, Part A, 2014, 124, 159–164 CrossRef CAS PubMed.
- A. L. Za, Y. E. Unsal, M. Habila, A. Shabaka, M. Tuzen and M. Soylak, Food Chem. Toxicol., 2012, 50, 2709–2713 CrossRef PubMed.
- M. Perez-Urquiza, M. D. Prat and J. L. Beltran, J. Chromatogr. A, 2000, 871, 227–234 CrossRef CAS PubMed.
- H. Sun, N. Sun, H. Li, J. Zhang and Y. Yang, Food Anal. Methods, 2013, 6, 1291–1299 CrossRef.
| This journal is © The Royal Society of Chemistry 2016 |