Trap-state passivation of titania nanotubes by electrochemical doping for enhanced photoelectrochemical performance†
Lok-kun
Tsui
a,
Mikiko
Saito
b,
Takayuki
Homma
bc and
Giovanni
Zangari
*a
aDepartment of Materials Science and Engineering and CESE, University of Virginia, Charlottesville, Virginia 22904-4745, USA. E-mail: gz3e@virginia.edu; Tel: +1-434-243-5474
bInstitute for Nanoscience and Nanotechnology, Waseda University, Shinjuku-ku, Tokyo, 162-0041, Japan
cDepartment of Applied Chemistry, Waseda University, Okubo 3-4-1, Shinjuku, Tokyo 169-8555, Japan
First published on 4th November 2014
Abstract
TiO2 nanotubes are widely investigated materials for photoelectrochemical water splitting, but the presence of trap states limits their performance by facilitating the recombination of electron/hole pairs. In this investigation we unequivocally demonstrate that the photocurrent improvement observed in TiO2 nanotubes after performing electrochemical doping with hydrogen or lithium ions is due to trap state passivation. Specifically, electrochemical impedance spectroscopy evidences that trap state defects disappear upon electrochemical doping, concurrent with an increase in the electron lifetime and faster photocurrent transients. This results in a two-fold enhancement in the photocurrent under simulated sunlight at 1.0 V vs. SCE. Li intercalation was confirmed and the structure as well as the composition of the modified nanotubes was elucidated by GDOES, XPS, and TEM.
1. Introduction
Due to their unique combination of morphological, electronic, charge transport and environmental stability properties, TiO2 nanotube arrays have been widely investigated as photoanodes for solar water splitting applications.1–8 These materials are also attractive from a processing standpoint, since they can be simply and inexpensively formed by the anodization of Ti in F− ion containing electrolytes.9 The implementation of photoelectrochemical cells based on TiO2 nanotube arrays however has been hampered so far by two main material limitations: the wide bandgap of 3.2 eV,10 which limits the usable fraction of the solar spectrum to less than 5%, and the presence of various crystallographic and surface defects.11–13 Defects in TiO2 include not only beneficial shallow donors responsible for n-type doping in TiO2 originating from O vacancies, but also trap states facilitating recombination, which originate from incompletely coordinated Ti4+ sites, Ti3+, and surface OH groups.11,13–17 The density of defect states has been recently shown to be dependent on the synthesis conditions of the TiO2 nanotubes.18A possible approach to overcome at least one of these limitations is doping of TiO2 nanotubes with hydrogen or lithium. Hydrogenation of TiO2 nanoparticles at 200 °C in a 20 bar H2 atmosphere has been shown to form black TiO2 exhibiting visible light photocatalysis.19,20 A similar treatment on TiO2 nanotubes resulted in efficient water splitting without an applied bias or any catalyst.21 Thermal processing at atmospheric pressure in air22 or O2 flow23 yielded blue or black nanoparticles with visible light activity; annealing TiO2 nanotubes in a H2 atmosphere in contrast yielded improved photoactivity but no visible absorption.24 As an alternative to thermochemical methods, electrochemical doping has been utilized to incorporate Li or H into the TiO2 lattice. In this process, a negative bias applied to TiO2 in a suitable electrolyte containing Li+ or H+ ions results in ion intercalation in the lattice. Doping of TiO2 nanotubes increases their conductivity,25,26 enabling metal or semiconductor electroplating inside the tubes, and also changes their color, a phenomenon exploited in electrochromic devices.25,27 In a different context, the electrochemical intercalation of Li in TiO2 films or nanostructures has been investigated for Li-ion battery applications.28–30 The loading levels of H or Li have been sparsely reported; under high pressure atmospheres, H can be loaded into TiO2 up to a concentration of 1–3 wt%, corresponding to a molar H![[thin space (1/6-em)]](https://www.rsc.org/images/entities/char_2009.gif) :
:![[thin space (1/6-em)]](https://www.rsc.org/images/entities/char_2009.gif) Ti ratio of 0.8–2.4.31,32 Anatase TiO2 on the other hand can accommodate a Li concentration corresponding to Li
Ti ratio of 0.8–2.4.31,32 Anatase TiO2 on the other hand can accommodate a Li concentration corresponding to Li![[thin space (1/6-em)]](https://www.rsc.org/images/entities/char_2009.gif) :
:![[thin space (1/6-em)]](https://www.rsc.org/images/entities/char_2009.gif) Ti = 0.27–0.5.29,33,34 Ion intercalation into the lattice of TiO2 generally leads to the reduction of Ti4+ to Ti3+ according to (eqn (1) and (2)),25,26
Ti = 0.27–0.5.29,33,34 Ion intercalation into the lattice of TiO2 generally leads to the reduction of Ti4+ to Ti3+ according to (eqn (1) and (2)),25,26
| Ti(IV)O2 + Li+ + e− → LiTi(III)O2 | (1) |
| Ti(IV)O2 + H+ + e− → HTi(III)O2 | (2) |
Meekins14 and Kang35 for instance investigated the electrochemical doping of TiO2 and found no visible light response associated with doping; these two studies suggested that the enhancement in photoelectrochemical response could be associated with the passivation of trap states in TiO2. The evidence for trap state passivation however was indirect, through the detection of longer electron lifetimes14 and a decreased intensity of photoluminescence;35 a direct inspection of the defect structure in doped TiO2 and a validation of the above hypothesis have not yet been reported.
In this paper, we report on the enhancement in the photoelectrochemical performance of TiO2 nanotubes via electrochemical modification of TiO2 by Li and H, and we demonstrate that this effect is due to trap state passivation. Specifically, electrochemical impedance spectroscopy is used to determine the energy level and density of defect states, showing that the traps are no longer detectable after hydrogen or lithium doping. As a consequence, we assign the enhanced performance to trap state passivation, which limits recombination and enhances the electron lifetime. Additional characterization by GDOES, XPS, and high resolution TEM are used to further investigate the spatial extent and character of doping inside the TiO2 nanotubes.
2. Results and discussion
The crystal structure of TiO2 nanotubes does not change upon electrochemical intercalation, as determined by Raman spectroscopy and X-ray diffraction (ESI, Fig. S1†). Fig. 1 shows the high resolution TEM images obtained on TiO2 nanotubes before and after Li doping. As-made nanotubes exhibit well defined atomic lattice fringes at the edge of the walls, while TiO2 nanotubes modified by Li doping display a darker surface region at the wall edge, 7 nm in thickness, lacking well defined lattice fringes. The lattice parameters were extracted from this region by FFT analysis (see SI Fig. S2† for calculated diffraction patterns), and values of c = 0.94 nm and a = 0.37 nm were obtained, matching the standard values of anatase TiO2 (PDF 01-071-1166).36 The difference in contrast suggests the presence of somewhat different structures in the surface and subsurface regions; the uniformity of the lattice constant however does not support this notion. If Li intercalation occurs in the surface region, the measured lattice constants indicate that intercalation would induce little or no deformation in the crystal lattice of TiO2. The reported volume change upon lithium ion intercalation however is at most a 7% expansion in the lattice parameters and a 4% volume expansion of the TiO2 unit cell;34,37,38 this variation is difficult to detect in TEM images. The increased width of the diffraction peaks (see Fig. S2(e and f)†) upon Li doping however evidences the introduction of some strain, which we assign to the intercalation process.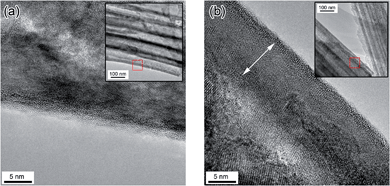 | ||
| Fig. 1 High resolution TEM images of (a) undoped and (b) Li doped TiO2 nanotubes. The inset in each region is a lower magnification TEM image of each location. | ||
The concentration of H or Li in electrochemically modified TiO2 nanotubes was analyzed by GDOES. Since this method involves the simultaneous removal of the material from the nanotube arrays of all the exposed surfaces during generation of the plasma, only an overall dopant fraction could be obtained; the measured value could also be affected by detection of the material being expelled from the substrate. GDOES detected Li within the Li-doped TiO2 nanotubes, but the hydrogen level was the same in the H-doped and untreated TiO2 nanotubes. In order to quantitatively assess the Li content, the integral of the Li and O atomic fraction detected as a function of sputtering time was computed. Assuming an O![[thin space (1/6-em)]](https://www.rsc.org/images/entities/char_2009.gif) :
:![[thin space (1/6-em)]](https://www.rsc.org/images/entities/char_2009.gif) Ti ratio of 2
Ti ratio of 2![[thin space (1/6-em)]](https://www.rsc.org/images/entities/char_2009.gif) :
:![[thin space (1/6-em)]](https://www.rsc.org/images/entities/char_2009.gif) 1 for TiO2, the average Li fraction within the nanotubes was determined to be 0.72%. With regard to the H concentration, we were unable to obtain a detectable difference among the various samples; this may be due to the H fraction being below 0.1 at% and therefore limited by the detection capability of this instrument. High resolution XPS spectra in the Ti 2p region for the three samples are plotted in Fig. 3. Two peaks are observed associated with the Ti 2p states39 and only a small shift by about 0.5–1.0 eV towards higher binding energies is observed after Li doping. According to the intercalation model summarized in eqn (1) and (2), doping should be accompanied by reduction of a fraction of the Ti4+ sites to Ti3+. A peak associated with the formation of Ti3+ upon Li intercalation at a concentration of Li0.32TiO2 has been observed by Södergren et al. and indicated in Fig. 2 at 456 eV;40 no peaks are however seen at this energy. It is possible that the limited fraction of Li intercalated into Ti may render the detection of the Ti3+ state by XPS impossible. In the case of H doping, Chen's black TiO2 formed by annealing in high pressure H2 atmospheres did not contain any other chemical states than Ti4+,20 but the same shoulder that Södergren et al. found was observed after UV illumination.40 Our results appear consistent with the XPS spectra obtained by Liu for H and by Kang for Li;21,35 in the latter study, the authors did not detect the formation of additional peaks associated with Ti3+ even with an extended Li intercalation time of 5 min.35
1 for TiO2, the average Li fraction within the nanotubes was determined to be 0.72%. With regard to the H concentration, we were unable to obtain a detectable difference among the various samples; this may be due to the H fraction being below 0.1 at% and therefore limited by the detection capability of this instrument. High resolution XPS spectra in the Ti 2p region for the three samples are plotted in Fig. 3. Two peaks are observed associated with the Ti 2p states39 and only a small shift by about 0.5–1.0 eV towards higher binding energies is observed after Li doping. According to the intercalation model summarized in eqn (1) and (2), doping should be accompanied by reduction of a fraction of the Ti4+ sites to Ti3+. A peak associated with the formation of Ti3+ upon Li intercalation at a concentration of Li0.32TiO2 has been observed by Södergren et al. and indicated in Fig. 2 at 456 eV;40 no peaks are however seen at this energy. It is possible that the limited fraction of Li intercalated into Ti may render the detection of the Ti3+ state by XPS impossible. In the case of H doping, Chen's black TiO2 formed by annealing in high pressure H2 atmospheres did not contain any other chemical states than Ti4+,20 but the same shoulder that Södergren et al. found was observed after UV illumination.40 Our results appear consistent with the XPS spectra obtained by Liu for H and by Kang for Li;21,35 in the latter study, the authors did not detect the formation of additional peaks associated with Ti3+ even with an extended Li intercalation time of 5 min.35
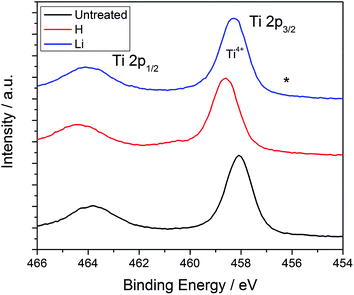 | ||
| Fig. 2 XPS spectra of TiO2 nanotubes unmodified and doped. (*) indicates the expected position of Ti3+ when significant Li intercalation occurs. | ||
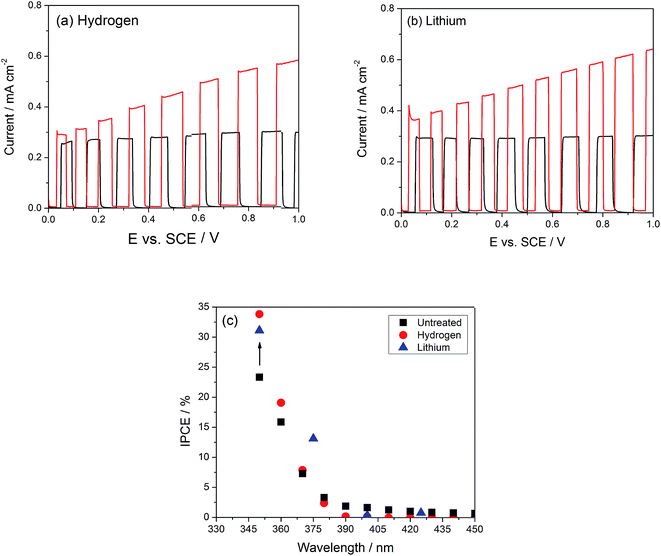
Fig. 3(a and b) compare the photocurrents under simulated sunlight of the TiO2 nanotubes modified with Li or H with those of the unmodified TiO2 ones. Qualitatively, the photocurrent is saturated between 0.1 and 1 VSCE in the unmodified nanotubes, while it increases gradually in both modifications, such that under an applied bias of 1.0 VSCE, the photocurrent in the modified nanotubes is up to two times as large as the unmodified ones. Photocurrent saturation under anodic bias has been ascribed to the increase in the depth of the space charge layer, reaching its maximum possible value when it attains the thickness of the nanotube walls.41 The fact that no geometric changes are seen in the tubes upon doping suggests that photocurrent saturation may not be due to space charge layer limitations, but to Fermi level pinning linked to a high density of defect states. We propose therefore that in the modified nanotubes an unpinning of the Fermi-level occurs due to the passivation of these trap states, while Fermi-level pinning by defects in unmodified tubes would result in photocurrent saturation under bias.42 The thickness of the space charge layer LSC can be readily calculated when the density of dopants and the dielectric constant for TiO2 are known,43 resulting in a value of 15 nm under a 2 V applied bias vs. flat band potential (ESI, Fig. S3†), which is half the nanotube wall thickness of 30–35 nm. The flat band potential of these TiO2 nanotubes is located at −0.2 VSCE.18,44 If the space charge layer expands from both sides, the potential at which the photocurrent is maximized should occur near 1.8 VSCE, well above the potential where it saturates, as shown in Fig. 3(a).
To address the possibility that doping of TiO2 with Li or H may induce a photoelectrochemical response under visible light, measurements of photocurrent spectra comparing undoped and doped TiO2 nanotube samples are plotted in Fig. 3(c), showing that no photocurrent is generated at wavelengths above ∼400 nm. This corresponds roughly to the 3.2 eV bandgap of anatase TiO2, which absorbs only light with wavelengths below 387.5 nm. At the same potential where the IPCE measurements were carried out (0.5 VSCE), the improvement under simulated sunlight is 1.4×, which is completely accounted for by the 1.4× increase in IPCE in the UV range. After electrochemical doping with Li or H, a brief transition to a black color is observed, but this dissipates within 30 seconds after the sample has been rinsed and dried. This is in contrast with the observation of permanent color change under thermochemical modification conditions,19,21–23 and suggests that electrochemical H or Li doping of TiO2 does not cause a permanent change in the band gap; the observed enhancement of the photocurrent response should be therefore associated only with trap state passivation. If this were the case, a decrease in the recombination rate should be observed; this could be indeed confirmed by monitoring the open circuit voltage decay,14,45 which directly correlates with the electron lifetime through eqn (3):
 | (3) |
In this equation, kB is Boltzmann's constant, T is the temperature in Kelvin, and e is the electron charge. The results are displayed in Fig. 4, which shows an increase in the electron lifetime at 0.2 VSCE by a factor of 20 for hydrogen doping and a factor of 2 after lithium doping. The increase in electron lifetime does not scale with the photocurrent, suggesting that other effects, such as the binding energy of electrons at these defect sites, may affect the trapping time and contribute to the observed effects.
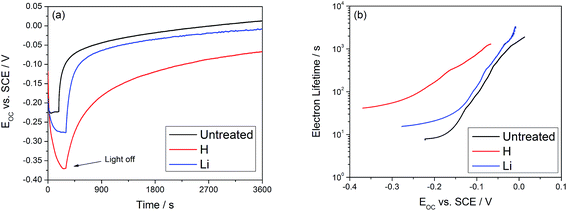 | ||
| Fig. 4 (a) OCV decay of TiO2 nanotubes following the switching off of UV light. (b) Calculated electron lifetime is improved by a factor of 20 for hydrogen and a factor of 2 for lithium. | ||
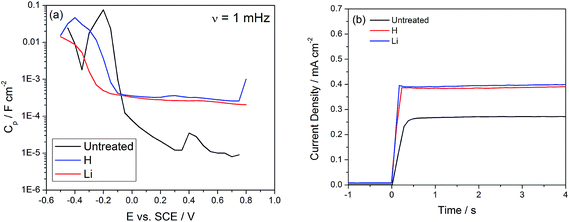
Electrochemical impedance spectroscopy and photocurrent transients were used to further investigate the trap passivation mechanism. To extract the density and energy level of crystalline defects, we obtained the interface capacitance (Cp) in the low frequency limit using eqn (4) (Fig. 6).46,47 In this equation, ω is the angular frequency, Im(Z) is the imaginary portion of the impedance, Re(Z) is the real portion of the impedance, and RΩ is the Ohmic resistance determined in the high frequency limit.
| Cp(ω) = −[ω*Im(Z)(1 + D2)]−1 | (4) |
Two peaks are observed in the unmodified TiO2 nanotubes, located at −0.2 and 0.4 VSCE and associated with shallow dopant states and deep level trap states, respectively.18 After H or Li doping the peak corresponding to the deep levels is no longer detectable in the capacitance scan (Fig. 5(a)), except for a flat background which increases by an order of magnitude in the positive potential (deep states) region. The increase in capacitance due to Li doping has been associated with an increase in the dielectric constant, up to 500–900 for heavily Li doped TiO2,34 and hydrogenation has also been shown to increase the capacitance of TiO2 by 40 times.48 Van de Krol et al. claimed that the increase of the dielectric constant may originate from an increase in the polarizability of TiO2 from intercalated Li ions.34 Evidence of trap state passivation is further supported by the photocurrent onset transients. In polycrystalline TiO2 nanotubes exhibiting a high density of trap states, a slow onset transient is associated with photogenerated charges initially being used for trap filling and later contributing to the observed steady state current density (Fig. 5(b)).49 Our calculations have placed the density of trap states associated with trap filling within an order of magnitude of the density of defects calculated with the frequency dependent capacitance, which strongly suggests that these trap states are responsible for the slow onset transients.44 After H or Li doping, the response to simulated sunlight illumination is much sharper and indicates suppression of losses associated with the capture of electrons by trap states (Fig. 5(b)).
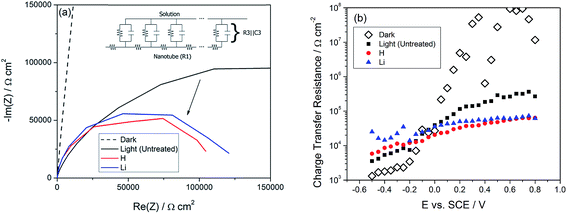
Electrochemical impedance spectroscopy under UV light illumination was also used to probe the kinetics of the photoelectrochemical reaction, which we assume to be water splitting. Fig. 6(a) shows the impedance response plotted in the Nyquist representation. A transmission line model (Fig. 6(a), Inset) was used to obtain the charge transfer resistance R3,18,50 and the results are plotted in Fig. 6(b). R3 under light is observed to drop by one order of magnitude after illumination, indicating improvements in the kinetics of the water splitting reaction. We do not attribute this to a catalytic effect of the doping process; rather, we hypothesize that more holes are available since they were not lost to recombination, resulting in an increased rate of the water splitting reaction.
Taking the density of trap states to be 9.7 × 1016 cm−3, as reported in ref. 18, the number density of Li or H that must be incorporated into TiO2 for complete trap state passivation can be calculated. The density of anatase TiO2 is 3.99 g cm−3, and its molar mass is 79.866 g mol−1.51 Therefore, the density of Ti atoms is 3.01 × 1022 cm−3. Dividing the trap density by the density of Ti atoms and assuming a one-electron reduction of a Ti4+ site to Ti3+, the fraction of Ti that must be reduced for complete trap state passivation is 3.22 × 10−6.14 As discussed above, this is five orders of magnitude smaller than the theoretical upper limit of Li intercalation at a stoichiometry of Li0.5TiO2. Even if a substantial portion of the Li/H diffuses out of TiO2, which could explain the transient nature of the electrochromism in the nanotubes, it is hypothesized that enough remains to retain the effect of photoelectrochemical enhancement. Adding more Li to the nanotubes by increasing the reduction time is found to have no effect (ESI, Fig. S4†). Numbers for the density of electrochemically intercalated H are not available, but this would also be several orders of magnitude smaller than the upper stoichiometry of H0.8–2.4TiO2 observed in thermochemically doped materials. We observe that in both H and Li modified TiO2, the performance enhancement is the same; this is in contrast to literature reports, showing that Li performs better.14 H and Li are both expected to readily incorporate into the interstitial sites formed by the voids within the octahedrons of the anatase TiO2 structure.20,32,34,52 If the underlying cause of the photocurrent enhancement is the trap state passivation that accompanies reactions in eqn (1) and (2) and both H and Li are located at similar sites there is no reason to expect that H and Li modified nanotubes would perform differently.
We may also estimate the depth of intercalation d by using a modified form of Faraday's Law to determine the fraction of TiO2 that is being reduced (eqn (5)). This calculation should only be valid for Li, where relatively few bubbles are observed during intercalation, and not for H, where a substantial portion of the current density during H doping would go towards hydrogen evolution, associated with vigorous gas generation at the electrode. If Q is the total charge passed, z is the number of electrons (1 for Ti4+ reduction), M is the molar mass of TiO2 (79.866 g mol−1), F is Faraday's Constant (96![[thin space (1/6-em)]](https://www.rsc.org/images/entities/char_2009.gif) 485 C mol−1), ρ is the density of anatase TiO2 (3.99 g cm−3),51 and x is a scaling constant based on the ratio of Li to Ti, then
485 C mol−1), ρ is the density of anatase TiO2 (3.99 g cm−3),51 and x is a scaling constant based on the ratio of Li to Ti, then
 | (5) |
A one-dimensional semi-infinite uniform block of lithiated TiO2 is assumed, with Li intercalation occurring at the surface. For every unit length of TiO2, only a fraction of the Ti4+ atoms can be reduced to Ti3+ to accommodate Li. Let's assume that at the surface TiO2 accommodates Li to a stoichiometry of Li0.5TiO2, thus calculating a lower bound on the minimum penetration of lithiation. Under this assumption, for a given length only half the Ti atoms may be reduced, such that x = 0.5. With a charge of 1.70 × 10⁻³ C cm−2, which corresponds to 3 s of the applied cathodic potential, a layer of Li0.5TiO2 would exhibit an intercalated depth of 7.1 nm. This is close to the thickness of the dark area observed in high resolution TEM images in Fig. 1. Van de Krol estimated that the maximum extent of lithiation could be up to 17 nm, placing this thickness within the thickness limit imposed by diffusion of Li in TiO2.34
Finally, two issues regarding the durability of the doping process were considered: the stability of a sample over extended periods of storage and the stability of the Li dopant in neutral electrolytes. The stability of the doping process was studied by recording the photocurrent before and after 1 month of sample storage in ambient air. In Fig. 7(a), we show the photocurrent of an H doped sample at 1.0 VSCE to be 0.57 mA cm−2 before storage and 0.47 mA cm−2 after storage, corresponding to a decrease of only 20% after 1 month. Kang et al. have raised the issue of the stability of Li in neutral electrolytes, claiming that doping before annealing the TiO2 nanotubes is necessary to maintain the doping effects.35Fig. 7(b) shows the current transient under a potentiostatic bias of 0.5 VSCE; less than 0.05 mA cm−2 decrease in the photocurrent is observed over 900 seconds. These results are in direct contrast to ref. 35, which showed no enhancement with Li doping in neutral electrolytes.
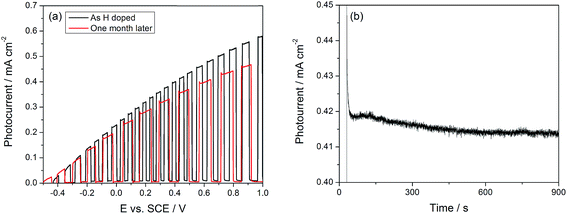 | ||
| Fig. 7 (a) Stability of H doped TiO2 NTs after prolonged storage. (b) Photocurrent transient of Li doped TiO2 showing stability over 15 minutes. | ||
3. Experimental section
TiO2 nanotubes were produced by a two-stage anodization method,44 using a Kepco BOP-100 power supply controlled with LabVIEW®. Ti foils (Alfa Aesar, 99+%, annealed, metals basis) were first cleaned by sequentially sonicating in acetone, isopropanol, and methanol, 30 minutes for each step. An electrical connection to each 2 cm × 0.7 cm × 0.127 mm Ti foil was made by spot welding a Ni wire to the top edge. The nanotubes were anodized in a two electrode configuration with a Pt mesh as the counter electrode, in an electrolyte containing 0.3 wt% NH4F and 2 vol% H2O (Millipore) in ethylene glycol at 50 V. The first anodization was carried out for 1 hour to form a ∼10 μm layer of nanotubes; this layer was then loosened by sonication in water for 30 minutes and removed with adhesive tape. In the second step, the nanotubes were anodized for 5 additional minutes under the same conditions to obtain highly uniform arrays of TiO2 nanotubes, 1 μm in length. The TiO2 nanotubes were finally annealed in air at 350 °C to convert amorphous TiO2 to anatase TiO2.53Hydrogen and lithium modification of TiO2 nanotubes was carried out in 0.5 M H2SO4 or 1 M LiClO4, respectively, with an applied potential of −1.55 VSCE for 3 s. Photocurrent measurements were carried out in a solution of 0.2 M Na2SO4 and 0.1 M NaCH3COO (pH = 7), in the potential range of 0 to 1.0 VSCE. This range was selected to avoid inadvertent doping during photocurrent testing. The light source was an Oriel Sol 1A solar simulator emitting AM 1.5 simulated sunlight with an intensity of 100 mW cm−2. Electrochemical impedance spectroscopy (EIS) measurements were carried out in the dark at potentials between 0.5 and −0.5 VSCE and in a frequency range from 200 kHz to 1 mHz with an amplitude of 20 mV. Under these same conditions, EIS was also carried out under the illumination of a 0.4 mW UV LED (Lumex SSL-LXTO46365C, λ = 363–370 nm); the resulting spectra were fitted to a transmission line equivalent circuit model.18,50 Open circuit voltage decay was measured by holding the samples under UV-LED illumination for 5 minutes at OCV, and then monitoring the voltage decay as a function of time. For these electrochemical measurements, a Pt mesh counter electrode, a saturated calomel reference electrode (SCE), and a BioLogic SP-150 potentiostat were used.
Transmission electron microscopy (TEM) images of TiO2 nanotubes were obtained by scratching with a razor blade several 3 × 3 mm2 Ti foils with TiO2 nanotubes, and collecting the resulting debris in a glass vial containing 2 mL of ethanol. This suspension was sonicated for 30 minutes, resulting in the ethanol turning into a pale white color. A lacy carbon TEM grid (Ted Pella) was then immersed into the ethanol-nanotube suspension and then dried under an incandescent lamp. This dipping and drying process was repeated for a total of 10 times to allow at least one fragment of the TiO2 nanotube array to appear in each grid window. High-resolution TEM images were obtained with an FEI Titan TEM. Glow discharge optical emission spectrometry and XPS measurements were performed on TiO2 nanotube array samples of 2 × 2 cm2 in size prepared as described above. A glow discharge optical emission spectrometer (GDOES, JY-5000RF, HORIBA) was used to investigate the H or Li content of the TiO2 nanotubes. The sampling area was 4 mm in diameter. Depth profiling was carried out at an argon pressure of 600 Pa, at a power of 35 W. X-ray photoelectron spectroscopy (XPS, JPS-9010 TR, JEOL Ltd.) measurements were performed to determine the oxidation state of Ti. The radiation source was MgKα and the measurement was carried out at 10 kV and 10 mA. The sampling area was 7 mm in diameter. The XPS spectra were calibrated to the peak of C 1s.
4. Conclusion
We have studied the structural changes, the mechanism and the increase in the photoelectrochemical performance of 1 μm long TiO2 nanotubes upon H or Li doping, showing that the two treatment methods are equally effective and can produce up to 200% improvement in the photocurrent under simulated sunlight at 1.0 VSCE. EIS and photocurrent transients prove that performance enhancement is due to trap state passivation, suggesting new avenues to further tailor the properties. Our measurements have confirmed that Li is present in sufficient amounts to be detected by GDOES, but small enough that the hypothesized Ti3+ chemical state cannot be resolved using XPS. Calculations show that minute amounts of Li and H are sufficient to passivate the trap states in TiO2, explaining why extended intercalation times reported in the literature do not provide further enhancements.Acknowledgements
We acknowledge the support from the ARCS Foundation and from the National Science Foundation Grant no. CMMI-1229603.References
- C. Das, P. Roy, M. Yang, H. Jha and P. Schmuki, Nanoscale, 2011, 3, 3094–3096 RSC
.
- Z. Zhang, X. Yang, M. N. Hedhili, E. Ahmed, L. Shi and P. Wang, ACS Appl. Mater. Interfaces, 2014, 6, 691–696 CAS
.
- B. Chen, J. Hou and K. Lu, Langmuir, 2013, 29, 5911–5919 CrossRef CAS PubMed
.
- A. Mazare, I. Paramasivam, K. Lee and P. Schmuki, Electrochem. Commun., 2011, 13, 1030–1034 CrossRef CAS PubMed
.
- Q. Kang, J. Cao, Y. Zhang, L. Liu, H. Xu and J. Ye, J. Mater. Chem. A, 2013, 1, 5766 CAS
.
- M. Altomare, K. Lee, M. S. Killian, E. Selli and P. Schmuki, Chemistry, 2013, 19, 5841–5844 CrossRef CAS PubMed
.
- J. Tang, J. R. Durrant and D. R. Klug, J. Am. Chem. Soc., 2008, 130, 13885–13891 CrossRef CAS PubMed
.
- L.-k. Tsui and G. Zangari, J. Electrochem. Soc., 2014, 161, D3066–D3077 CrossRef CAS PubMed
.
- P. Roy, S. Berger and P. Schmuki, Angew. Chem., Int. Ed. Engl., 2011, 50, 2904–2939 CrossRef CAS PubMed
.
- L. Kavan, M. Grätzel, S. E. Gilbert, C. Klemenz and H. J. Scheel, J. Am. Chem. Soc., 1996, 118, 6716–6723 CrossRef CAS
.
- T. Berger, M. Sterrer, O. Diwald, E. Knözinger, D. Panayotov, T. L. Thompson and J. T. Yates, J. Phys. Chem. B, 2005, 109, 6061–6068 CrossRef CAS PubMed
.
- C. P. Kumar, N. O. Gopal, T. C. Wang, M.-S. Wong and S. C. Ke, J. Phys. Chem. B, 2006, 110, 5223–5229 CrossRef CAS PubMed
.
- A. Hagfeldt, H. Lindström, S. Södergren and S.-E. Lindquist, J. Electroanal. Chem., 1995, 381, 39–46 CrossRef
.
- B. H. Meekins and P. V. Kamat, ACS Nano, 2009, 3, 3437–3446 CrossRef CAS PubMed
.
- B. J. Morgan and G. W. Watson, Phys. Rev. B: Condens. Matter Mater. Phys., 2009, 80, 2–5 Search PubMed
.
- S. A. Ali Yahia, L. Hamadou, A. Kadri, N. Benbrahim and E. M. M. Sutter, J. Electrochem. Soc., 2012, 159, K83 CrossRef PubMed
.
- S.-C. Ke, T.-C. Wang, M.-S. Wong and N. O. Gopal, J. Phys. Chem. B, 2006, 110, 11628–11634 CrossRef CAS PubMed
.
- L. Tsui and G. Zangari, Electrochim. Acta, 2014, 121, 203–209 CrossRef CAS PubMed
.
- X. Chen, L. Liu, P. Y. Yu and S. S. Mao, Science, 2011, 331, 746–750 CrossRef CAS PubMed
.
- X. Chen, L. Liu, Z. Liu, M. a. Marcus, W.-C. Wang, N. a. Oyler, M. E. Grass, B. Mao, P.-A. Glans, P. Y. Yu, J. Guo and S. S. Mao, Sci. Rep., 2013, 3, 1510 Search PubMed
.
- N. Liu, C. Schneider, D. Freitag, M. Hartmann, U. Venkatesan, J. Müller, E. Spiecker and P. Schmuki, Nano Lett., 2014, 14, 3309–3313 CrossRef CAS PubMed
.
- F. Zuo, L. Wang, T. Wu, Z. Zhang, D. Borchardt and P. Feng, J. Am. Chem. Soc., 2010, 132, 11856–11857 CrossRef CAS PubMed
.
- A. Naldoni, M. Allieta, S. Santangelo, M. Marelli, F. Fabbri, S. Cappelli, C. L. Bianchi, R. Psaro and V. Dal Santo, J. Am. Chem. Soc., 2012, 134, 7600–7603 CrossRef CAS PubMed
.
- D. Wang, L. Liu, F. Zhang, K. Tao, E. Pippel and K. Domen, Nano Lett., 2011, 11, 3649–3655 CrossRef CAS PubMed
.
- R. Hahn, A. Ghicov, H. Tsuchiya, J. M. Macak, A. G. Muñoz and P. Schmuki, Phys. Status Solidi A, 2007, 204, 1281–1285 CrossRef CAS
.
- J. M. Macak, B. G. Gong, M. Hueppe and P. Schmuki, Adv. Mater., 2007, 19, 3027–3031 CrossRef CAS
.
- A. Ghicov, H. Tsuchiya, R. Hahn, J. M. Macak, A. G. Muñoz and P. Schmuki, Electrochem. Commun., 2006, 8, 528–532 CrossRef CAS PubMed
.
- Q. L. Wu, J. Li, R. D. Deshpande, N. Subramanian, S. E. Rankin, F. Yang and Y. Cheng, J. Phys. Chem. C, 2012, 116, 18669–18677 CAS
.
- K. H. Reiman, K. M. Brace, T. J. Gordon-Smith, I. Nandhakumar, G. S. Attard and J. R. Owen, Electrochem. Commun., 2006, 8, 517–522 CrossRef CAS PubMed
.
- W. Wei, G. Oltean, C.-W. Tai, K. Edström, F. Björefors and L. Nyholm, J. Mater. Chem. A, 2013, 1, 8160 CAS
.
- P. Raghunath, W. F. Huang and M. C. Lin, J. Chem. Phys., 2013, 138, 154705 CrossRef CAS PubMed
.
- C. Sun, Y. Jia, X.-H. Yang, H.-G. Yang, X. Yao, G. Q. Lu, A. Selloni and S. C. Smith, J. Phys. Chem. C, 2011, 115, 25590–25594 CAS
.
- M. Wagemaker, W. J. H. Borghols and F. M. Mulder, J. Am. Chem. Soc., 2007, 129, 4323–4327 CrossRef CAS PubMed
.
- R. van de Krol, A. Goossens and J. Schoonman, J. Phys. Chem. B, 1999, 103, 7151–7159 CrossRef CAS
.
- U. Kang and H. Park, Appl. Catal., B, 2013, 140–141, 233–240 CrossRef CAS PubMed
.
-
International Centre for Diffraction Data, ICDD DDView+, version 4.8.0.5, Newtown Square, PA, USA, 2009 Search PubMed
.
- R. J. Cava, A. Santoro, D. W. Murphy, S. M. Zahurak, R. M. Fleming, P. Marsh and R. S. Roth, J. Solid State Chem., 1986, 65, 63–71 CrossRef CAS
.
- R. Van De Krol, A. Goossens and E. A. Meulenkamp, J. Electrochem. Soc., 1999, 146, 3150–3154 CrossRef CAS PubMed
.
- H. G. Yang and H. C. Zeng, J. Phys. Chem. B, 2004, 108, 3492–3495 CrossRef CAS
.
- S. Södergren, H. Siegbahn, H. Rensmo, H. Lindström, A. Hagfeldt and S. Lindquist, J. Phys. Chem. B, 1997, 101, 3087–3090 CrossRef
.
- R. Beranek, H. Tsuchiya, T. Sugishima, J. M. Macak, L. Taveira, S. Fujimoto, H. Kisch and P. Schmuki, Appl. Phys. Lett., 2005, 87, 243114 CrossRef PubMed
.
- A. J. Bard, A. B. Bocarsly, F. R. F. Fan, E. G. Walton and M. S. Wrighton, J. Am. Chem. Soc., 1980, 102, 3671–3677 CrossRef CAS
.
- G. K. Boschloo, J. Electrochem. Soc., 1997, 144, 1311 CrossRef CAS PubMed
.
- L. Tsui, T. Homma and G. Zangari, J. Phys. Chem. C, 2013, 117, 6979–6989 CAS
.
- A. Zaban, M. Greenshtein and J. Bisquert, ChemPhysChem, 2003, 4, 859–864 CrossRef CAS PubMed
.
- G. Oskam, P. P. M. Hoffmann and P. P. C. Searson, Phys. Rev. Lett., 1996, 76, 1521–1524 CrossRef CAS
.
- G. Oskam, J. C. Schmidt, P. M. Hoffmann and P. C. Searson, J. Electrochem. Soc., 1996, 143, 2531 CrossRef CAS PubMed
.
- X. Lu, G. Wang, T. Zhai, M. Yu, J. Gan, Y. Tong and Y. Li, Nano Lett., 2012, 12, 1690–1696 CrossRef CAS PubMed
.
- K. Schwarzburg and F. Willig, Appl. Phys. Lett., 1991, 58, 2520 CrossRef CAS PubMed
.
- J. Bisquert, G. Garcia-Belmonte, F. Fabregat-Santiago, N. S. Ferriols, P. Bogdanoff and E. C. Pereira, J. Phys. Chem. B, 2000, 104, 2287–2298 CrossRef CAS
.
-
CRC Handbook of Chemistry & Physics, ed. W. H. D. Lide, Taylor and Francis Group, LLC, Boca Raton, FL, 94th edn, 2014, pp. 4–96 Search PubMed
.
- B. Zachau-Christiansen, K. West, T. Jacobsen and S. Atlung, Solid State Ionics, 1988, 30, 1176–1182 CrossRef
.
- A. Tighineanu, T. Ruff, S. P. Albu, R. Hahn and P. Schmuki, Chem. Phys. Lett., 2010, 494, 260–263 CrossRef CAS PubMed
.
Footnote |
| † Electronic supplementary information (ESI) available: Raman spectra, XRD patterns, FFTs of HR-TEM images, calculation of the thickness of the space charge layer, and influence of Li doping time. See DOI: 10.1039/c4ta05620e |
| This journal is © The Royal Society of Chemistry 2015 |

