Synthesis and lithium-storage properties of MnO/reduced graphene oxide composites derived from graphene oxide plus the transformation of Mn(VI) to Mn(II) by the reducing power of graphene oxide†
Guixia
Zhao‡
ab,
Xiubing
Huang‡
b,
Xiangke
Wang‡
*acde,
Paul
Connor‡
b,
Jiaxing
Li‡
a,
Shouwei
Zhang‡
a and
John T. S.
Irvine‡
*b
aSchool of Environment and Chemical Engineering, North China Electric Power University, Beijing 102206, P. R. China. E-mail: xkwang@ipp.ac.cn; xkwang@ncepu.edu.cn; Fax: +86 55165591310; Tel: +86 55165592788
bSchool of Chemistry, University of St Andrews, St Andrews, Fife, KY16 9ST, UK. E-mail: jtsi@st-andrews.ac.uk; Fax: +44 (0)1334 463808; Tel: +44 (0)1334463817
cFaculty of Engineering, King Abdulaziz University, Jeddah 21589, Saudi Arabia
dSchool for Radiological and Interdisciplinary Sciences, Soochow University, 215123, Suzhou, P. R. China
eCollaborative Innovation Center of Radiation Medicine of Jiangsu Higher Education Institutions, P. R. China
First published on 31st October 2014
Abstract
In this report, a novel method is proposed to prepare MnO/reduced graphene oxide (rGO) composites via calcining the precursors (i.e. δ-MnO2/graphene oxide composites) at 500 °C in Ar using no external reducing gas, in which graphene oxide (GO) successfully serves as a reductant by releasing CO during its thermolysis for the first time. By controlling the initial ratios of GO to KMnO4, differently composed precursors can be obtained via the redox reaction between GO and KMnO4, then leading to the formation of composites with different MnO/rGO ratios and dispersion of MnO on the rGO surface (denoted as MGC1 and MGC2). When applied as an active material in lithium ion batteries, MGC1 shows excellent cycling performance and capacity retention. Under 100 and 200 mA g−1, MGC1 could deliver reversible capacities as high as 900 and 750 mA h g−1, respectively, after more than 100 cycles. Considering the simple operation and low energy consumption in the whole material synthesis processes, the present strategy is feasible and effective for practical application. Even more importantly, the reductibility of graphene oxide upon thermolysis is utilized for the first time, which is meaningful for its extension in synthesis of functional nanomaterials.
With the increasing power and energy demand in portable electronic vehicles and devices, great effort has been made in developing new high-performance electrode materials for high-power rechargeable lithium-ion batteries (LIBs).1–5 Transition metal oxides, such as SnO2,6–8 TiO2,9 MoOx,10,11 and MnO2,12,13 have been widely studied as anode materials in LIBs since first proposed in 2000 by Poizot et al.14 Among these transition metal oxides, manganese oxides (MnOx) were a promising candidate series because of their relatively low thermodynamic equilibrium voltage versus Li/Li+,15–17 and low electromotive force,18–20 as well as their environmental benignity and low cost. However, there are still several drawbacks such as: (1) the large volume change and gradual agglomeration of metal grains21,22 during the discharge/charge reaction and (2) intrinsically low electronic conductivity, both of which result in the rapid fading of capacities during the cycling process.23 To overcome these challenges, many research studies were focused on the incorporation of carbon nanomaterials such as carbon nanotubes24–26 and carbon nanofibers27 into MnOx to suppress the pulverization and capacity fading. After the discovery of graphene, much interest was paid to graphene/MnOx nanocomposites for LIBs with high capacity and long-life.23,28–30 However, many of these composites were synthesized under severe conditions and usually needed higher cost for calcination. For example, in Sun et al.'s report, by mixing Mn(CH3COO)2 and GO solutions, and adding hydrazine hydrate, a Mn-precursor/graphene intermediate was obtained, which was then annealed at 500 °C in a 5% H2/Ar atmosphere for 5 h to obtain the final MnO/graphene composite.31 A similar strategy was used for a N-doped MnO/graphene hybrid by calcining a precursor, i.e. Mn3O4/graphene, at 800 °C for 5 h under a NH3 atmosphere.32 In Qian's group, the precursors MnOOH nanowires were first synthesized through a hydrothermal procedure and after the following calcination in air, Mn2O3 nanowires were obtained. The final MnO@C core–shell nanowires were produced by exposing these Mn2O3 nanowires to argon and an acetylene/argon gas mixture at 500 °C.33
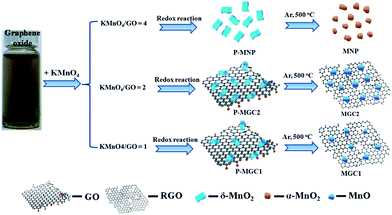
Different from many of the reported studies, we herein introduce MnO/rGO composites via a quite different synthesis approach. As reported in many publications,34,35 theoretical and experimental proof has proved that thermal reduction of graphene oxide would release CO and CO2, and the CO–CO2 ratios were dependent on the thermal conditions. Therefore, in this work, we tried to utilize the reductive CO released from GO to in situ reduce MnO2 in the MnO2/GO composites to obtain MnO/rGO composites without using any external reductive gases, such as H2 and CO, which makes the synthesis process with less cost and more safety. What is more important, GO is utilized as a solid reductant for the first time and this valuable finding will arouse much interest in the GO research for material synthesis. In our previous research, it has been proven that the mild redox reaction between graphene oxide and KMnO4 would result in highly active δ-MnO2 nanosheets.36 In the present work, by adjusting the ratio of graphene oxide and KMnO4, different contents of graphene oxide can be retained in the δ-MnO2/graphene oxide composites. As shown in Fig. 1, we typically tried three different weight ratios between KMnO4 and graphene oxide. The redox reaction between the two reactants resulted in three precursors, P-MNP, P-MGC2 and P-MGC1. Through the further calcination under Ar at 500 °C, δ-MnO2 in the precursors (P-MGC2 and P-MGC1) can be reduced to MnO due to the reductive gas (CO) release from the thermolysis of graphene oxide, resulting in the formation of MGC2 and MGC1. No graphene oxide was found in the P-MNP, so that after the calcination under Ar at 500 °C, δ-MnO2 was transferred to α-MnO2 nanoparticles (denoted as MNP). The general synthesis process for these manganese oxides and their hybrids with graphene is illustrated in Fig. 1 (see more experimental details in the ESI†).
Results and discussion
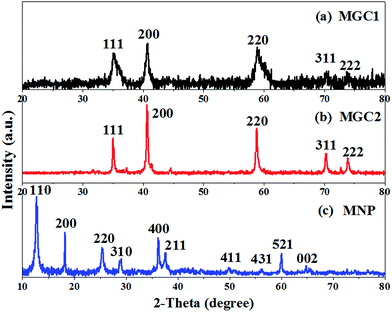
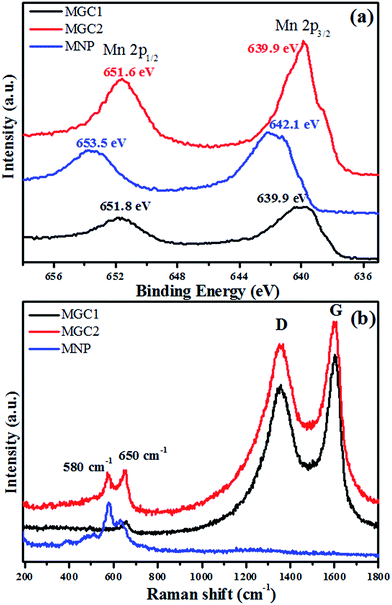
The precursors resulting from the redox reaction between graphene oxide and KMnO4 were found to contain δ-MnO2 with a monoclinic birnessite (containing K) phase from the XRD (Fig. SI1, ESI†), similar to our reported results. And the TGA results in air (Fig. SI2a–c, ESI†) showed that no graphene oxide remained in P-MNP, while for P-MGC2 and P-MGC1, it can be implied that the remaining graphene oxide contents were about 14% and 37%, respectively, by calculating the mass loss during heating in air. After annealing these precursors at 500 °C for 90 min under an Ar atmosphere, different manganese oxides were obtained. Fig. 2 shows the XRD patterns of MGC1, MGC2 and MNP. It is obvious that MNP (Fig. 2c) is indexed to a pure α-MnO2 phase with a tetragonal crystal system (JCPDS no. 44-0141), while MGC2 (Fig. 2b) and MGC1 (Fig. 2a) readily correspond to a cubic phase of MnO (JCPDS no. 07-0230), and their TGA analysis in air indicates that rGO contents are about 18% and 39%, respectively (Fig. SI2d–f, ESI†).The high-resolution X-ray photoelectron spectroscopy (XPS) analysis is shown in Fig. 3a. The peaks at around 640 and 651 eV for MGC2 and MGC1 are attributed to Mn(II) 2p3/2 and 2p1/2, respectively,37 which are quite different from the peaks for MNP located at about 642 and 653 eV, the characteristics of Mn(IV).38 Raman spectra were obtained to further identify the structure and constituent of MNP, MGC2 and MGC1, as presented in Fig. 3b. The characteristic D band and G band of carbon materials are present in MGC2 and MGC1, but absent in MNP, further indicating that there is no graphene in MNP. Additionally, the peaks at around 580 and 650 cm−1 for MGC2 are assigned to manganese oxide.39–41 In the sample MGC1, there is only one peak around 650 cm−1 for MnO, which may be due to the fact that the signal intensity for the metal–oxygen bond is usually lower than that of the D and G bands for rGO. And in MGC1, the graphene content is higher than that in MGC2, so the D and G peak intensities are even much higher than that for the metal–oxygen bond. As a result, the peak at 580 cm−1 is not as obvious as that at 650 cm−1 in MGC1.
Fig. 4, 5 and 6 show the typical SEM and TEM images of MNP, MGC2 and MGC1, respectively. Evidently, α-MnO2 nanoparticles in MNP are dispersed well with the size of about 50 nm with a narrow size distribution (Fig. 4a and c). For MGC2 and MGC1 as shown in Fig. 5 and 6, MnO nanoparticles are both with a size of ca. 50 nm, and it is also obvious to note that the graphene content in MGC2 is lower than that in MGC1, which leads to more aggregation of MnO in MGC2 while MnO nanoparticles in MGC1 are dispersed well on the surface of rGO. The high-resolution TEM (HRTEM) images of MGC2 (Fig. 5d) and MGC1 (Fig. 6d) show the interplanar distance of ca. 0.25 nm, corresponding to the (111) plane of cubic MnO. The FFT (Fast Fourier Transform) patterns in the inset in the HRTEM images also show the spot pattern representative of the crystalline phase, although the intensity is quite low due to the low crystallinity of MnO nanoparticles. However, MNP showed a different lattice spacing of ca. 0.48 nm (Fig. 4d), which corresponds to the (200) plane of α-MnO2. The N2 adsorption–desorption isotherms (see Fig. SI3, ESI†) also showed a higher BET specific surface area of MGC1 (46.3 m2 g−1) than that of MGC2 (27.4 m2 g−1).
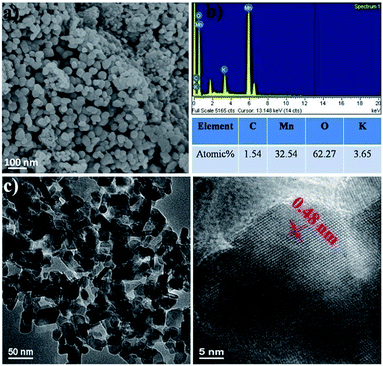 | ||
| Fig. 4 (a and b) SEM images and corresponding Energy Dispersive Spectra (EDS) of MNP; (c and d) TEM and HRTEM images of MNP. | ||
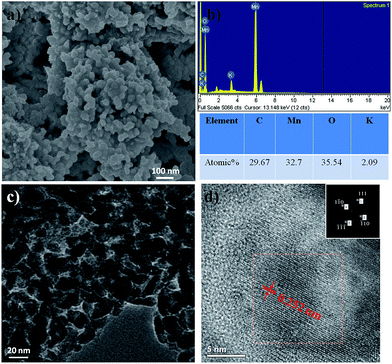 | ||
| Fig. 5 (a and b) SEM images and corresponding Energy Dispersive Spectra (EDS) of MGC2; (c and d) TEM and HRTEM images of MGC2 (the inset in (d) shows the FFT pattern with marked spots). | ||
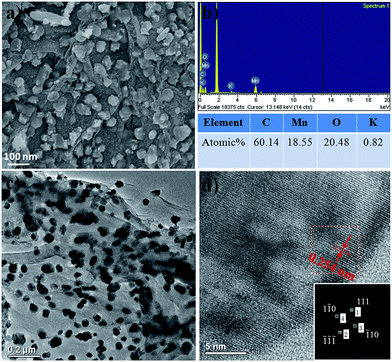 | ||
| Fig. 6 (a and b) SEM images and corresponding Energy Dispersive Spectra (EDS) of MGC1; (c and d) TEM and HRTEM images of MGC1 (the inset in (d) shows the FFT pattern with marked spots). | ||
The energy-dispersive spectra (EDS) also indicate the existence of Mn, O and C in MGC1 and MGC2. The rough atom ratio of Mn to O is about 1![[thin space (1/6-em)]](https://www.rsc.org/images/entities/char_2009.gif) :
:![[thin space (1/6-em)]](https://www.rsc.org/images/entities/char_2009.gif) 1 and the atom ratios of C to Mn are also consistent with the previous analysis. For MNP, the rough atom ratio of Mn to O is about 1
1 and the atom ratios of C to Mn are also consistent with the previous analysis. For MNP, the rough atom ratio of Mn to O is about 1![[thin space (1/6-em)]](https://www.rsc.org/images/entities/char_2009.gif) :
:![[thin space (1/6-em)]](https://www.rsc.org/images/entities/char_2009.gif) 2 and the little signal (about 1.5 atom%) for carbon may come from the environment or adsorbed CO2. From the above analysis, by increasing the initial ratio of graphene oxide to KMnO4 in the redox reaction, the more graphene oxide can be remained in the resulting δ-MnO2/GO composites (pure δ-MnO2, i.e. P-MNP was obtained when the weight ratio of KMnO4 to GO was 4
2 and the little signal (about 1.5 atom%) for carbon may come from the environment or adsorbed CO2. From the above analysis, by increasing the initial ratio of graphene oxide to KMnO4 in the redox reaction, the more graphene oxide can be remained in the resulting δ-MnO2/GO composites (pure δ-MnO2, i.e. P-MNP was obtained when the weight ratio of KMnO4 to GO was 4![[thin space (1/6-em)]](https://www.rsc.org/images/entities/char_2009.gif) :
:![[thin space (1/6-em)]](https://www.rsc.org/images/entities/char_2009.gif) 1). During further heating treatment under an Ar atmosphere, the carbon in graphene skeleton cannot reduce MnO2 since the temperature is only 500 °C.42 The remaining graphene oxide undergoes thermolysis to release CO and CO2, as reported by many researchers.34,35 Thus, even in the inert atmosphere, MnO2 can be reduced to MnO, which is decorated on the graphene support and the remaining graphene oxide is also reduced to rGO at the same time. This is quite different from results reported by Sun et al.,31 where Mn2+ was used as the Mn source and H2/Ar was used as the reductive gas for graphene oxide. For P-MNP, the absence of graphene oxide means the absence of CO release, so α-MnO2 nanoparticles were obtained because of the phase change of δ-MnO2 into α-MnO2 during high-temperature treatment. In summary, in this work, the reducing power of graphene oxide has been successfully proven and used to prepare MnO from MnO2 without any extra reductants.
1). During further heating treatment under an Ar atmosphere, the carbon in graphene skeleton cannot reduce MnO2 since the temperature is only 500 °C.42 The remaining graphene oxide undergoes thermolysis to release CO and CO2, as reported by many researchers.34,35 Thus, even in the inert atmosphere, MnO2 can be reduced to MnO, which is decorated on the graphene support and the remaining graphene oxide is also reduced to rGO at the same time. This is quite different from results reported by Sun et al.,31 where Mn2+ was used as the Mn source and H2/Ar was used as the reductive gas for graphene oxide. For P-MNP, the absence of graphene oxide means the absence of CO release, so α-MnO2 nanoparticles were obtained because of the phase change of δ-MnO2 into α-MnO2 during high-temperature treatment. In summary, in this work, the reducing power of graphene oxide has been successfully proven and used to prepare MnO from MnO2 without any extra reductants.
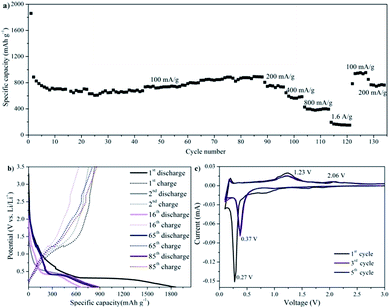
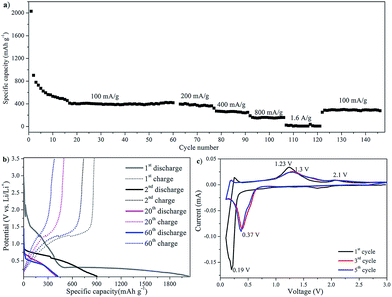
The electrochemical lithium-storage performance of the as-prepared MnO/rGO composites was also investigated. The galvanostatic discharge/charge cycling performance was tested at a current of 100 mA g−1 with a voltage window of 0.05–3.5 V. As shown in Fig. 7a, for a current density of 100 mA g−1, the first discharge capacity of MGC1 was over 1800 mA h g−1, and the initial capacity loss is about 50%, which is believed due to the disordered rGO and the trap sites for Li on its surface to form SEI. Interestingly, in the following cycling, the capacity increased gradually and stabilized at 900 mA h g−1 after 85 cycles. The capacity rise has been reported in many published studies and was considered to be attributed to a possible activation process in the electrode.31,33 The initial capacity has a significant irreversible component; however, capacity in subsequent cycles is of similar order to that expected for Mn2+/Mn0 conversion. On a number of cycles, the capacity exceeded than that expected for just the Mn couple and may possibly reflect a component due to the organic polymeric/gel like films formed reversibly by decomposition at low potential.33,43 According to the theoretical overall reaction between lithium and graphene nanosheets, 2C + Li+ + e− ↔ LiC2 (with a capacity of 1116 mA h g−1)44–46 and the theoretical conversion of MnO and Li, MnO + 2Li+ + 2e− ↔ Li2O + Mn (with a capacity of 756 mA h g−1),47 as well as the content analysis of the composite through TGA shown in Fig. SI2d–f,† the theoretical capacity for MGC1 is about 896 mA h g−1, which is in good agreement with the stable capacity of 900 mA h g−1 after 85 cycles at a low current density of 100 mA g−1.
In the following rate capability test at various current densities, discharge capacities of 750 mA h g−1, 580 mA h g−1, 400 mA h g−1 and 160 mA h g−1 were retained at current densities of 200 mA g−1, 400 mA g−1, 800 mA g−1 and 1.6 A g−1, respectively. It seems that the rate performance is not as high as that of other reported carbon–MnO materials.31,33 For the MnO/graphene prepared by Sun et al., the reversible capacity is high up to 2014.1 mA h g−1 at a current of 200 mA g−1 and 625.8 mA h g−1 at a current of 3000 mA g−1.31 Also according to Li et al., the MnO@C electrode delivered a capacity of 861 mA h g−1 at a current of 100 mA g−1 and 462 mA h g−1 at a current of 2000 mA g−1.33 The relatively low rate capability may be ascribed to the relatively low electronic conductivity of reduced graphene oxide in the active material that results in the incomplete discharge/charge process at high current densities. However, importantly, the capacity was able to recover to more than 900 mA h g−1 after 120 cycles when the current density was returned to 100 mA g−1. More details of the discharge/charge process can be seen from the discharge/charge voltage profile in Fig. 7b, which shows a discharge plateau at ca. 0.31 V in the 1st cycling and a shifted plateau at ca. 0.42 V in the later cycling. It also shows a charging plateau at ca. 1.2 V and in the further cyclings, from 16th to 85th cycling, another small charge slope gradually broadened, which was in agreement with the increased capacities in the discharge/charge process.
Fig. 7c shows the potentiostatic discharge/charge cycling behavior of the MGC1 electrode. In the first discharge, a sharp cathodic peak at about 0.27 V was considered due to the complete reduction of Mn(II) to Mn(0), and this peak shifted to 0.37 V in the following cycles, which was supposed to be due to the improved kinetics and the alternated microstructure of the MGC1 electrode after the first cycle.48–50 In the 1st anodic process, the peak at ca. 1.23 V was ascribed to the oxidation of Mn(0) to Mn(II), which also remained at 1.23 V in the subsequent cycles. It is noted that there is another small oxidation peak at ca. 2.06 V, which is quite stable with cycling. This peak also appeared in many previous studies on MnO/graphene and MnOx/carbon electrodes and it is considered due to the fact that Mn(II) could be re-oxidized to a higher oxidation state with the aid of fast Li reaction kinetics and the synergistic effects of carbon and MnOx.31,42,44,45,51–53 It is worth noting that the second and onward cycling CV curves remained almost unchanged, indicating the relatively stable discharge/charge process with good chemical reversibility.
For the other MnO/rGO composites (i.e. MGC2) as shown in Fig. 8a, the capacity and rate capability are not as good as MGC1. Under a current of 100 mA g−1, the stable discharge capacity was about 400 mA h g−1, while at higher currents of 200 mA g−1, 400 mA g−1, 800 mA g−1 and 1.6 A g−1, only 380 mA h g−1, 270 mA h g−1, 170 mA h g−1 and 20 mA h g−1 were remained, respectively. When the current density went back to 100 mA g−1, the stable capacity was only recovered to 300 mA h g−1. It is easy to discern that MGC2 did not experience any increase in the capacity performance. From the discharge/charge voltage profile shown in Fig. 8b, it is also noted that only one charge slope located at ca. 1.2 V, although the discharge slope location in the whole cycling is similar to that of MGC1.
The potentiostatic cycling performance of MGC2 (Fig. 8c) showed a cathodic peak at 0.19 V, which shifted to 0.37 V in the following cycling. In the first anodic process, a main peak was located at 1.23 V, corresponding to the electrochemical oxidation of Mn(0) to Mn(II). There was another small peak at ca. 2.1 V, which reflected the re-oxidization of Mn(II) to a higher oxidation. It is worth pointing out that this peak became less evident upon cycling, which is quite different from that of MGC1 (as shown in Fig. 7c). It is inferred that the reaction kinetics and the synergistic effects of carbon and MnO in MGC2 is not as good as that in MGC1.
According to the morphology and the component analysis mentioned above, the different performance may be due to the fact that MnO nanoparticles are dispersed homogeneously on the graphene skeleton in MGC1, and so the aggregation of these active MnO nanoparticles can be effectively prevented. Furthermore, more graphene in MGC1 enhanced the electrical conductivity, the chemical stability and the synergistic effects of the components in the active electrode materials. Additionally, the higher specific surface area of MGC1 also benefits lithium ion and electron transport. Thus, utilization efficiency of MnO during lithiation and delithiation is largely enhanced, although the capacity of MGC1 is still not high enough under high current densities, which may be due to the fact that the graphene component in the composite has significant defects arising from the thermal reduction of graphene oxide54,55 and thus the electrical conductivity is not as high as pristine graphene.56 While for MGC2, the graphene content is much lower as compared to that in MGC1, which leads to poor electronic conductivity and severe aggregation of MnO as shown in TEM images, thus the performance is not as good as that of MGC1.
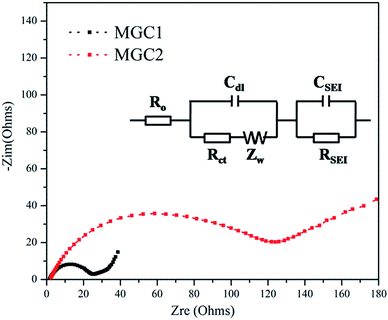
To prove the important effect of the graphene content, electrochemical impedance spectroscopy (EIS) measurement was also carried out with the frequency ranging from 100 kHz to 100 mHz using fresh batteries. Fig. 9 shows the Nyquist plots of MGC1 and MGC2 without any discharge/charge cycles, which are similar and composed of one semicircle and an inclined line, indicative of diffusion. The diameter of the semicircle reflects the resistance of the charge-transfer reaction at the electrode/electrolyte interface while the slope line is related to the Warburg impedance originated from the diffusion of lithium ions in the electrode. It is obvious that the MGC1 electrode exhibits a much lower resistance than MGC2, proving that MnO dispersed well on graphene displayed improved conductivity and discharge/charge kinetics.
Conclusions
In summary, a novel approach for fabricating MnO/rGO composites was introduced for the first time by utilizing the reducing power of graphene oxide during the thermolysis of precursors, i.e., MnO2/graphene oxide composites. CO releasing out from the graphene oxide can successfully reduce MnO2 to form MnO while graphene oxide was reduced partially to form rGO, thus no reducing gas or agent is used during the calcination. By controlling the ratio of initial reactants (KMnO4 and graphene oxide), the component of the MnO2/graphene oxide composites can be tuned, then further leading to different composed MnO/rGO composites, denoted as MGC1 and MGC2, both of which were applied as active materials for lithium ion batteries. MGC1 showed a superior cycling performance and lithium-storage capacity. Under 100 and 200 mA g−1, MGC1 could deliver reversible capacities as high as 900 and 750 mA h g−1, respectively after more than 100 cycles. In consideration of the simple and low-cost synthesis process, it is quite promising to apply the composites for practical manufacture. The results also contribute a lot to the extension of graphene oxide in synthesizing other functional materials due to the first utilization of its reducing power in the thermolysis.Acknowledgements
The authors acknowledge the financial support from the National Natural Science Foundation of China (21272236, 21225730, 21207136 and 91326202), the Ministry of Science and Technology of China (2011CB933700), the Jiangsu Provincial Key Laboratory of Radiation Medicine and Protection and the Priority Academic Program Development of Jiangsu Higher Education Institutions.References
- A. Magasinski, P. Dixon, B. Hertzberg, A. Kvit, J. Ayala and G. Yushin, Nat. Mater., 2010, 9, 353–358 CrossRef CAS PubMed.
- L.-X. Yuan, Z.-H. Wang, W.-X. Zhang, X.-L. Hu, J.-T. Chen, Y.-H. Huang and J. B. Goodenough, Energy Environ. Sci., 2011, 4, 269–284 CAS.
- C. K. Chan, H. Peng, G. Liu, K. McIlwrath, X. F. Zhang, R. A. Huggins and Y. Cui, Nat. Nanotechnol., 2008, 3, 31–35 CrossRef CAS PubMed.
- K. Kang, Y. S. Meng, J. Bréger, C. P. Grey and G. Ceder, Science, 2006, 311, 977–980 CrossRef CAS PubMed.
- H. Li, Z. Wang, L. Chen and X. Huang, Adv. Mater., 2009, 21, 4593–4607 CrossRef CAS.
- J. S. Chen, Y. L. Cheah, Y. T. Chen, N. Jayaprakash, S. Madhavi, Y. H. Yang and X. W. Lou, J. Phys. Chem. C, 2009, 113, 20504–20508 CAS.
- X. W. Lou, J. S. Chen, P. Chen and L. A. Archer, Chem. Mater., 2009, 21, 2868–2874 CrossRef CAS.
- X. W. Lou, C. M. Li and L. A. Archer, Adv. Mater., 2009, 21, 2536–2539 CrossRef CAS.
- J. S. Chen, Y. L. Tan, C. M. Li, Y. L. Cheah, D. Luan, S. Madhavi, F. Y. C. Boey, L. A. Archer and X. W. Lou, J. Am. Chem. Soc., 2010, 132, 6124–6130 CrossRef CAS PubMed.
- Y. Sun, X. Hu, W. Luo and Y. Huang, ACS Nano, 2011, 5, 7100–7107 CrossRef CAS PubMed.
- Y. Sun, X. Hu, J. C. Yu, Q. Li, W. Luo, L. Yuan, W. Zhang and Y. Huang, Energy Environ. Sci., 2011, 4, 2870–2877 CAS.
- O. Ghodbane, J.-L. Pascal and F. d. r. Favier, ACS Appl. Mater. Interfaces, 2009, 1, 1130–1139 CAS.
- Z. Lei, F. Shi and L. Lu, ACS Appl. Mater. Interfaces, 2012, 4, 1058–1064 CAS.
- P. Poizot, S. Laruelle, S. Grugeon, L. Dupont and J. M. Tarascon, Nature, 2000, 407, 496–499 CrossRef CAS PubMed.
- X. Fang, X. Lu, X. Guo, Y. Mao, Y.-S. Hu, J. Wang, Z. Wang, F. Wu, H. Liu and L. Chen, Electrochem. Commun., 2010, 12, 1520–1523 CrossRef CAS PubMed.
- S. Laruelle, S. Grugeon, P. Poizot, M. Dolle, L. Dupont and J. Tarascon, J. Electrochem. Soc., 2002, 149, A627–A634 CrossRef CAS PubMed.
- H. Li, P. Balaya and J. Maier, J. Electrochem. Soc., 2004, 151, A1878–A1885 CrossRef CAS PubMed.
- M.-S. Wu, Y.-H. Ou and Y.-P. Lin, Electrochim. Acta, 2010, 55, 3240–3244 CrossRef CAS PubMed.
- K. M. Nam, J. H. Shim, D.-W. Han, H. S. Kwon, Y.-M. Kang, Y. Li, H. Song, W. S. Seo and J. T. Park, Chem. Mater., 2010, 22, 4446–4454 CrossRef CAS.
- J. Xiang, J. Tu, Y. Yuan, X. Huang, Y. Zhou and L. Zhang, Electrochem. Commun., 2009, 11, 262–265 CrossRef CAS PubMed.
- J. Fan, T. Wang, C. Yu, B. Tu, Z. Jiang and D. Zhao, Adv. Mater., 2004, 16, 1432–1436 CrossRef CAS.
- F. Cheng, Z. Tao, J. Liang and J. Chen, Chem. Mater., 2007, 20, 667–681 CrossRef.
- J. Guo, Q. Liu, C. Wang and M. R. Zachariah, Adv. Funct. Mater., 2012, 22, 803–811 CrossRef CAS.
- H. Xia, M. Lai and L. Lu, J. Mater. Chem., 2010, 20, 6896–6902 RSC.
- A. L. M. Reddy, M. M. Shaijumon, S. R. Gowda and P. M. Ajayan, Nano Lett., 2009, 9, 1002–1006 CrossRef CAS PubMed.
- Y. Ding, C. Wu, H. Yu, J. Xie, G. Cao, T. Zhu, X. Zhao and Y. Zeng, Electrochim. Acta, 2011, 56, 5844–5848 CrossRef CAS PubMed.
- L. Ji and X. Zhang, Electrochem. Commun., 2009, 11, 795–798 CrossRef CAS PubMed.
- Y. Sun, X. Hu, W. Luo, F. Xia and Y. Huang, Adv. Funct. Mater., 2012, 23, 2436–2444 CrossRef.
- K. Zhang, P. Han, L. Gu, L. Zhang, Z. Liu, Q. Kong, C. Zhang, S. Dong, Z. Zhang and J. Yao, ACS Appl. Mater. Interfaces, 2012, 4, 658–664 CAS.
- A. Yu, H. W. Park, A. Davies, D. C. Higgins, Z. Chen and X. Xiao, J. Phys. Chem. Lett., 2011, 2, 1855–1860 CrossRef CAS.
- Y. Sun, X. Hu, W. Luo, F. Xia and Y. Huang, Adv. Funct. Mater., 2013, 23, 2436–2444 CrossRef CAS.
- K. J. Zhang, P. X. Han, L. Gu, L. X. Zhang, Z. H. Liu, Q. S. Kong, C. J. Zhang, S. M. Dong, Z. Y. Zhang, J. H. Yao, H. X. Xu, G. L. Cui and L. Q. Chen, ACS Appl. Mater. Interfaces, 2012, 4, 658–664 CAS.
- X. Li, S. Xiong, J. Li, X. Liang, J. Wang, J. Bai and Y. Qian, Chem.–Eur. J., 2013, 19, 11310–11319 CrossRef CAS PubMed.
- I. Jung, D. Dikin, S. Park, W. Cai, S. L. Mielke and R. S. Ruoff, J. Phys. Chem. C, 2008, 112, 20264–20268 CAS.
- R. Larciprete, S. Fabris, T. Sun, P. Lacovig, A. Baraldi and S. Lizzit, J. Am. Chem. Soc., 2011, 133, 17315–17321 CrossRef CAS PubMed.
- G. Zhao, J. Li, L. Jiang, H. Dong, X. Wang and W. Hu, Chem. Sci., 2012, 3, 433–437 RSC.
- J. F. Moulder, W. F. Stickle, P. E. Sobol and K. D. Bomben, Handbook of X-ray photoelectron spectroscopy, Perkin-Elmer, Boca Raton, FL, 1992 Search PubMed.
- A. A. Audi and P. Sherwood, Surf. Interface Anal., 2002, 33, 274–282 CrossRef CAS.
- T. W. Kim, H. Yoo, I. Y. Kim, H. W. Ha, A. R. Han, J. S. Chang, J. S. Lee and S. J. Hwang, Adv. Funct. Mater., 2011, 21, 2301–2310 CrossRef CAS.
- M. Wei, Y. Konishi, H. Zhou, H. Sugihara and H. Arakawa, Nanotechnology, 2005, 16, 245 CrossRef CAS PubMed.
- M. Polverejan, J. C. Villegas and S. L. Suib, J. Am. Chem. Soc., 2004, 126, 7774–7775 CrossRef CAS PubMed.
- A. H. Reidies, in Ullmann's Encyclopedia of Industrial Chemistry, Wiley-VCH Verlag GmbH & Co. KGaA, 2000 Search PubMed.
- Y. Hou, Y. Cheng, T. Hobson and J. Liu, Nano Lett., 2010, 10, 2727–2733 CrossRef CAS PubMed.
- S. Q. Wang, J. Y. Zhang and C. H. Chen, J. Power Sources, 2010, 195, 5379–5381 CrossRef CAS PubMed.
- D. Y. Pan, S. Wang, B. Zhao, M. H. Wu, H. J. Zhang, Y. Wang and Z. Jiao, Chem. Mater., 2009, 21, 3136–3142 CrossRef CAS.
- P. C. Lian, X. F. Zhu, S. Z. Liang, Z. Li, W. S. Yang and H. H. Wang, Electrochim. Acta, 2010, 55, 3909–3914 CrossRef CAS PubMed.
- B. Sun, Z. X. Chen, H. S. Kim, H. Ahn and G. X. Wang, J. Power Sources, 2011, 196, 3346–3349 CrossRef CAS PubMed.
- O. Delmer, P. Balaya, L. Kienle and J. Maier, Adv. Mater., 2008, 20, 501–505 CrossRef CAS.
- J. Liu and Q. Pan, Electrochem. Solid-State Lett., 2010, 13, A139–A142 CrossRef CAS PubMed.
- K. Zhong, X. Xia, B. Zhang, H. Li, Z. Wang and L. Chen, J. Power Sources, 2010, 195, 3300–3308 CrossRef CAS PubMed.
- H. Wang, L.-F. Cui, Y. Yang, H. Sanchez Casalongue, J. T. Robinson, Y. Liang, Y. Cui and H. Dai, J. Am. Chem. Soc., 2010, 132, 13978–13980 CrossRef CAS PubMed.
- J. Gao, M. A. Lowe and H. D. Abruña, Chem. Mater., 2011, 23, 3223–3227 CrossRef CAS.
- J. Guo, Q. Liu, C. Wang and M. R. Zachariah, Adv. Funct. Mater., 2012, 22, 803–811 CrossRef CAS.
- C. Gómez-Navarro, J. C. Meyer, R. S. Sundaram, A. Chuvilin, S. Kurasch, M. Burghard, K. Kern and U. Kaiser, Nano Lett., 2010, 10, 1144–1148 CrossRef PubMed.
- G. Lu, L. E. Ocola and J. Chen, Appl. Phys. Lett., 2009, 94, 083111–083113 CrossRef PubMed.
- S. Stankovich, D. A. Dikin, R. D. Piner, K. A. Kohlhaas, A. Kleinhammes, Y. Jia, Y. Wu, S. T. Nguyen and R. S. Ruoff, Carbon, 2007, 45, 1558–1565 CrossRef CAS PubMed.
Footnotes |
| † Electronic supplementary information (ESI) available: Material synthesis and characterization, electrochemical measurements, XRD patterns of the precursors, component analysis of precursors and final products by TGA and N2 adsorption–desorption isotherms of MGC1 and MGC2. See DOI: 10.1039/c4ta05376a |
| ‡ The manuscript was written through contributions of all authors. All authors have given approval to the final version of the manuscript. The authors declare no competing financial interest. |
| This journal is © The Royal Society of Chemistry 2015 |

