Impact of distributions on the photocatalytic performance of anatase nanoparticle ensembles
Amanda S.
Barnard
*
CSIRO Virtual Nanoscience Laboratory, 343 Royal Parade, Parkville, Victoria 3052, Australia. E-mail: amanda.barnard@csiro.au; Tel: +61-3-9662-7356
First published on 30th October 2014
Abstract
While it has been established that the size and shape of nanoparticle photocatalysts determines their performance, producing monodispersed samples is not always economically efficient. Most samples contain a distributions of sizes and shapes, and so predictions based on single-particle properties often fail to identify which feature is more important than the other. Using simple statistical approaches and ensembles of structures it is possible to explore the impact of reducing different types of polydispersivity, and thus identify realistic targets for synthesis at the industrial scale. In the case of anatase, photocatalytic performance can be significantly increased without requiring monodispersivity, provided some of the particles are small.
Titania nanostructures are of considerable commercial interest, due to their superior photochemical properties.1–3 The crystalline polymorph and the morphology are known to be critical parameters4–9 in determining the overall performance7,10 and general suitability for specific applications.11
While rutile is the thermodynamically stable phase of titania under ambient conditions at the macroscale,12 synthesis of nanocrystalline titania consistently resulted in anatase nanocrystals,13 and it is now well established that anatase is the thermodynamically stable phase at the nanoscale.14,15 It has previously been demonstrated that the morphology of anatase nanostructures can be engineered with remarkable control,16,17 but this requires very specific synthesis conditions and preserving this degree of control may not be commercially viable for large scale production. Most samples typically contain distributions of sizes and shapes, and so detailed predictions of the performance of polydispersed samples of anatase (which go beyond conventional single-particle structure/property relationships) are needed to provide a basis for commercial decisions. These decisions include, but are not limited to, the degree and type of monodispersivity required, and the cost effectiveness of achieving it. Should synthesis efforts be targeted toward producing anatase nanoparticles of a specific size and/or shape, and what is the fault tolerance for persistent polydispersivity?
Both size and shape are critical to the performance of a photocatalysis, since the efficiency of reactions typically depends on the crystallographic orientation of the surface facets, the total available surface area, and the type of reaction.18 In the case of anatase, the {001} facets are the most photoactive,17,19,20 and this can be experimentally estimated by measuring the products of reactions at the surfaces, using a variety of techniques.21 Among the reaction products, the OH˙ radical is extremely important, as it is related to the photocatalytic oxidation of water.22,23 Moreover, it has been established that addition of hydrogen peroxide in the titania photocatalytic system accelerates the OH˙ formation, thereby improving the activity.24 In this case, OH˙ is formed on reduction of hydrogen peroxide with a conduction band electron, ecb− (which is the primary reaction for the production of OH˙), or by O2˙−. Alternatively, hydrogen peroxide can be oxidized to O2˙− by a valence band hole, hvb+ (which is the primary reaction for O2˙− production), or by OH˙.25
Theoretically the efficiency can be estimated via the in-plane density of Ti cations on the anatase {001}, which is 6.99 × 10¹⁸ m−2, and the total area of the {001} facets (which depends on the size and the shape).26 To begin to explore the impact of structural polydispersivity on photocatalytic performance we must first establish a virtual sample of anatase nanoparticles, and calculate their relative stability. While it is possible to generate a large set of explicit virtual samples (that contain a considerable variety of shapes and sizes) to study anatase nanoparticle ensembles using explicit computer simulations, this represents a very large undertaking (particularly if we wish to use ab initio simulation methods) and considerable time and resources will be spent describing structures that have a very low probability of observation and contribute little to the properties of the ensemble. It is more efficient to use an analytical model to generate the sample, rather than to attempt to simulate thousands of individual nanoparticles. This can be done in a straightforward manner using a model27 parameterized by density functional theory,28 where it is a simple matter to compare the free energy of formation of any input morphology29 in an appropriate thermochemical bath using ab initio thermodynamics.30
Previously it has been established that a phenomenological nanomorphology model, designed to compare the thermodynamic stability of isolated (unsupported) nanoparticles, is ideally suited to this task. The model used here provides the geometric summation of the Gibbs free energy with contributions from the particle bulk and surfaces, such that:
 | (1) |
 , and
, and  (to be consistent with the Laplace–Young formalism).
The temperature-dependent free energy ΔG(T) may be determined by parameterizing with γi(T) and σi(T). This may be done using any suitable computational method, provided that it is used consistently (to avoid uncertainties associated with the mixing methods) and has sufficient accuracy to distinguish between different facets and provide the right energetic ordering. From experiment, it is usually found that titania surfaces include TiOH surface hydroxyl groups,32–36 and under neutral pH conditions the surfaces are terminated with H2O (either as molecular H2O or as dissociated OH− + H+) or OH.37,38 For this reason the temperature-dependent specific surface energies and isotropic surface stresses for H2O– and OH–terminated surfaces have been included, as described in ref. 30. These properties were originally calculated using ab initio thermodynamics, based on simulations performed using density functional theory (DFT) within the generalized gradient approximation (GGA),28 and have been shown to support excellent agreement with experimental observations of photocatalytic activity.26 In the present study we have averaged over H2O– and OH–terminated surface results, as we aim to study particles that will occupy the coexistence zone of the phase diagram.30
Once parameterized, the models above can be used to compare the relative stability of each shape (n), and predict their probability of observation (p) as a function of the probe temperature T. This can be easily obtained using a Boltzmann distribution:
| p(n) = e−Gn(T)β | (2) |
 | (3) |
Using the size- and shape-dependent relative stability Gn we can compute the probabilities pn∀n ∈ N, and then determine the populations for a range of equilibrium and non-equilibrium (metastable) geometries. Irrespective of the sizes and shapes included in the ensemble, the populations for non-equilibrium structures are always non-zero at finite temperatures, though they are of course low for the least stable morphologies. The ensemble average of the density of active sites (X) can then be computed for any ensemble containing N particles using:
 | (4) |
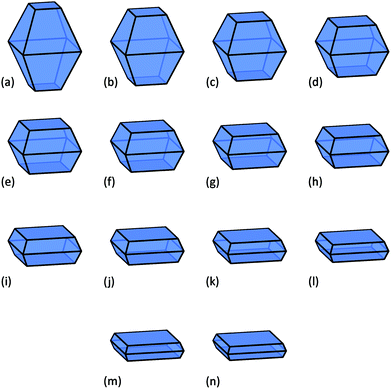
In this study a virtual sample of nanoparticles from 3 nm to 60 nm in average diameter has been used (spanning the range characteristic of typical commercial samples21), with shapes containing a fractional area of the active {001} facets ranging from 10% to 75%. These shapes are illustrated in Fig. 1, where we can see that as we increase the area of the {001} facets the particles become platelets, and accurately replicate the morphologies targeted by many groups.17,20
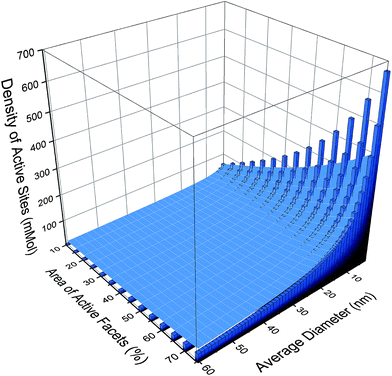
If we apply resolution of 1 nm to the size distribution and a 5% resolution to the shape distribution, then there are 812 possible monodispersed size/shape combinations. This size/shape resolution is trivial to achieve theoretically, but complicated to achieve computationally, and challenging to achieve experimentally. For each of these monodispersed combinations a theoretical estimate of the photocatalytic performance, based on the number density of cations on the {001} facets, is shown as a histogram in Fig. 2. Here we can see that the activity will increase with both increasing {001} area and decreasing particle size (or equivalently, increasing the effective molar area), though the absolute values resulting from this type of prediction should be used with caution (as the efficiency of real samples may not be ideal). While including all active sites will undoubtedly be an overestimation, the relative differences between different ensembles (computed consistently) can be used with confidence. With this is mind, it is easy to see the scope for improving the photocatalytic performance if this degree of monodispersivity and size/shape selectivity could be achieved.
However, if no attempt were made to create monodispersed samples then the virtual sample would be an ensemble containing all of these 812 combinations, and the prevalence of each configuration will be determined by the probability of observation, which is related to the relative thermodynamic stability.31 Computing the probability of each configuration and applying it as a weighting factor to each structure, as illustrated by the overlaid surface-plot in Fig. 2, we can begin to see the impact of polydispersivity. At small sizes the maximal activity is reduced by ∼50% since these particles are less thermodynamically stable and therefore less likely.
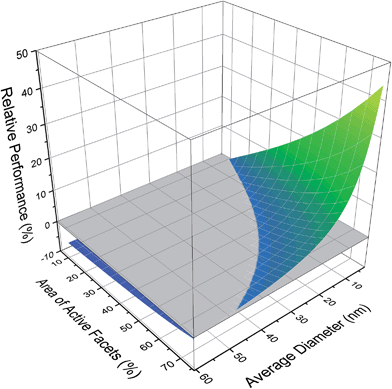
If we consider the polydispersed sample in its entirety, the ensemble average is 43.65 sites per mMol, with a very unsatisfactory standard deviation of 50.64. To gain some appreciation of which size/shape combinations should be targeted to improve the photocatalytic performance, Fig. 3 provides the change in the micromolar density of active sites, relative to the ensemble average (which is set to zero). Here we can see that the majority of configurations perform below the ensemble average and so targeting these sizes and shapes will retard performance; it is better to retain the natural polydispersivity. Conversely we can also see that there is a significant advantage in targeting small platelets, where the performance enhancement can be has high as 44%. What we cannot discern from these results, is whether it is better to concentrate on controlling the size or the shape.
 | ||
| Fig. 3 Photocatalytic performance of different size/shape configurations in the ensemble, relative to the ensemble average (shown in grey). | ||
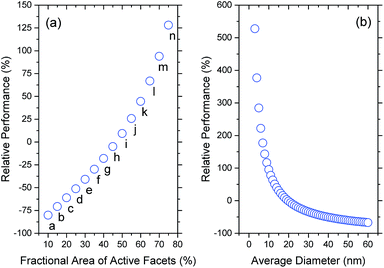
One advantage in using a statistical approach is that we can easily construct smaller, more selective ensembles and predict how the selectivity will impact the performance (relative to the entire ensemble average). Fig. 4 provides series of results for two different types of selective ensembles. In Fig. 4(a) we can see the impact of giving priority to shape-selectivity, where each sample is monodispersed in terms of shape, but polydispersed in terms of size (including contributions from all sizes between 3 nm to 60 nm weighted by their probability of observation); the data labels refer to the figure labels in Fig. 1. In Fig. 4(b) we can see the impact of giving priority to size-selectivity, where each sample is monodispersed in terms of size, but polydispersed in terms of shape (including contributions from all shapes in Fig. 1 weighted by their probability of observation). By comparing these results it is immediately clear that a greater performance enhancement will be achieved by focussing on controlling the size; the photocatalytic activity can be increased by 2× to 5× if particles could be reduced to <7 nm, irrespective of the shapes.
 | ||
| Fig. 4 Change in photocatalytic performance of different selective ensembles, relative the entire ensemble average. (a) Shape-selected ensembles, containing a weighted distribution of sizes (where the labels refer to the parts in Fig. 1). (b) Size-selected ensembles, containing a weighted distribution of the shapes shown in Fig. 1. | ||
Of course, this degree of selectivity still assumes a high degree of control is possible during synthesis, and this may be difficult (and/or expensive) to achieve at the industrial level. To assess the impact of a more moderate degree of structural control, Table 1 provides the ensemble averages and the change in the relative performance (with respect to the entire ensemble average) for a range of different restricted ensembles. In the rows the impact of smaller size-distributions are shown, and in the columns the impact of different shape-distributions; in each case eliminating some, but not all, of the polydispersivity.
| Size range | {001}-retarded | {001}-unrestricted | {001}-enriched |
|---|---|---|---|
| 3–30 nm | 32.72 (−25.05%) | 72.91 (+67.02%) | 95.02 (+117.66%) |
| 3–40 nm | 29.53 (−32.35%) | 59.37 (+36.00%) | 84.81 (+94.29%) |
| 3–50 nm | 25.10 (−42.50%) | 50.51 (+15.70%) | 72.08 (+65.11%) |
| 3–60 nm (All) | 21.68 (−50.33%) | 43.65 (0%) | 62.25 (+42.60%) |
| 10–60 nm | 14.53 (−66.72%) | 29.79 (−31.75%) | 42.60 (−2.42%) |
| 20–60 nm | 11.30 (−74.11%) | 23.26 (−46.72%) | 33.25 (−23.83%) |
| 30–60 nm | 9.55 (−78.11%) | 19.69 (−54.90%) | 28.14 (−35.54%) |
We can see from the results in Table 1 that there are gains to be made from both size and shape control, but size-control will be far more profitable. Enrichment of the samples with {001} facets is only advantageous if the size distribution contains small anatase nanoparticles. If a polydispersed sample could be restricted to less than 30 nm in size, and simultaneously limited to a {001}-enriched platelet-like morphology, these results indicate that the photocatalytic performance will double.
Although it is well known that engineering the shape of photocatalyst will enhance performance, a fact that is certainly supported by these results, the outcome of the comparisons presented here indicate that it is not as important as size. Given the time and cost associated with controlling size, shape, and the degree of polydispersivity in both, this suggests that attention and resources should be directed toward producing samples of small nanoparticles with a high fraction of {001} facets — but achieving perfect monodispersivity is unnecessary. Distributions in both size and shape are acceptable (and can even be useful), provided they are the right distributions; and they can be reproduced as required.
Acknowledgements
Computational resources for this project were supplied by the National Computing Infrastructure national facility under Mass Allocation Scheme, Grant p00.References
- T. L. Thompson and J. T. Yates Jr, Chem. Rev., 2006, 106, 4428–4453 CrossRef CAS PubMed.
- A. Fujishima, X. Zhang and D. A. Tryk, Surf. Sci. Rep., 2008, 63, 515–582 CrossRef CAS PubMed.
- A. Kudo and Y. Misekia, Chem. Soc. Rev., 2009, 38, 253–278 RSC.
- Z. Zhang, C. C. Wang, R. Zakaria and J. Y. Ying, J. Phys. Chem. B, 1998, 102, 10871–10878 CrossRef CAS.
- K. D. Jang, S.-K. Kim and S.-J. Kim, J. Nanopart. Res., 2001, 3, 141–147 CrossRef.
- T. Paunesku, T. Rajh, G. Wiederrecht, J. Maser, S. Vogt, S. N. Tojićvć, M. Protić, B. Lai, J. Oryhon, M. Thurnauer and G. Woloschak, Nat. Mater., 2003, 2, 343–346 CrossRef CAS PubMed.
- N. Balázs, K. Mogyorósi, D. F. Srankó, A. Pallagi, T. Alapi, A. Oszkó, A. Dombi and P. Sipos, Appl. Catal., B, 2008, 84, 356–362 CrossRef PubMed.
- N. Balázs, D. F. Srankó, A. Dombi, P. Sipos and K. Mogyorósi, Appl. Catal., B, 2010, 96, 569–576 CrossRef PubMed.
- K. Mogyorósi, N. Balázs, D. F. Srankó, E. Tombácz, I. Dékány, A. Oszkó, P. Sipos and A. Dombi, Appl. Catal., B, 2010, 96, 577–585 CrossRef PubMed.
- A. Testino, I. R. Bellobono, V. Buscaglia, C. Canevali, M. D'Arienzo, S. Polizzi, R. Scotti and F. Morazzoni, J. Am. Chem. Soc., 2007, 129, 3564–3575 CrossRef CAS PubMed.
- X. B. Chen and S. S. Mao, Chem. Rev., 2007, 107, 2891–2959 CrossRef CAS PubMed.
- J. Muscat, V. Swamy and N. M. Harrison, Phys. Rev. B: Condens. Matter Mater. Phys., 2002, 65, 224112–224126 CrossRef.
- H. Zhang, M. Finnegan and J. F. Banfield, Nano Lett., 2001, 1, 81–84 CrossRef CAS.
- M. R. Ranade, A. Navrotsky, H. Z. Zhang, J. F. Banfield, S. H. Elder, A. Zaban, P. H. Borse, S. K. Kulkarni, G. S. Doran and H. J. Whitfield, Proc. Natl. Acad. Sci. U. S. A., 2002, 99, 6476–6481 CrossRef CAS PubMed.
- A. A. Levchenko, G. Li, J. Boerio-Goates, B. F. Woodfield and A. Navrotsky, Chem. Mater., 2006, 18, 6324–6332 CrossRef CAS.
- N. Satoh, T. Nakashima, K. Kamikura and K. Yamamoto, Nat. Nanotechnol., 2008, 3, 106–111 CrossRef CAS PubMed.
- H. G. Yang, C. H. Sun, S. Z. Qiao, J. Zou, G. Liu, S. C. Smith, H. M. Cheng and G. Q. Lu, Nature, 2008, 453, 638–641 CrossRef CAS PubMed.
- K. Ishibashi, A. Fujishima, T. Watanabe and K. Hashimoto, J. Photochem. Photobiol., A, 2000, 134, 139–142 CrossRef CAS.
- T. Ohno, K. Sarukawa and M. Matsumura, New J. Chem., 2002, 26, 1167–1170 RSC.
- W. Q. Fang, X.-Q. Gong and H. G. Yang, J. Phys. Chem. Lett., 2011, 2, 725–734 CrossRef CAS.
- A. Moiseev, M. Krichevskaya, F. Qi, A. P. Weber and J. Deubener, Chem. Eng. J., 2013, 228, 614–621 CrossRef CAS PubMed.
- M. R. Hoffmann, S. T. Martin, W. Choi and D. W. Bahnemann, Chem. Rev., 1995, 95, 69–96 CrossRef CAS.
- Y. F. Li, Z. P. Liu, L. L. Liu and W. Gao, J. Am. Chem. Soc., 2010, 132, 13008–13015 CrossRef CAS PubMed.
- L. X. Chen and C. Zhao, Langmuir, 2001, 17, 4118–4122 CrossRef.
- T. Hirakawa and Y. Nosaka, Langmuir, 2002, 18, 3247–3254 CrossRef CAS.
- A. S. Barnard, Energy Environ. Sci., 2011, 4, 439–443 CAS.
- A. S. Barnard, J. Phys. Chem. B, 2006, 110, 24498–24504 CrossRef CAS PubMed.
- A. S. Barnard, P. Zapol and L. A. Curtiss, Surf. Sci., 2005, 582, 173–188 CrossRef CAS PubMed.
- A. S. Barnard and P. Zapol, J. Phys. Chem. B, 2004, 108, 18435–18440 CrossRef CAS.
- A. S. Barnard and H. Xu, ACS Nano, 2008, 2, 2237–2242 CrossRef CAS PubMed.
- A. S. Barnard, Nanoscale, 2014, 8, 9985–9990 Search PubMed.
- M. C. Thurnauer, T. Rajh and D. M. Tiede, Acta Chem. Scand., 1997, 51, 610–618 CrossRef CAS PubMed.
- Y. Nakaoka and Y. Nosaka, J. Photochem. Photobiol., A, 1997, 110, 299–305 CrossRef CAS.
- S. H. Szczepankiewicz, J. A. Moss and M. R. Hoffmann, J. Phys. Chem. B, 2002, 106, 7654–7658 CrossRef CAS.
- T. Kasuga, M. Hiramatsu, A. Hoson, T. Sekino and K. Niihara, Adv. Mater., 1999, 11, 1307–1311 CrossRef CAS.
- Z. V. Saponjic, N. Dimitrijevic, D. Tiede, A. Goshe, X. Zuo, L. Chen, A. S. Barnard, P. Zapol, L. A. Curtiss and T. Rajh, Adv. Mater., 2005, 17, 965–971 CrossRef CAS.
- U. Diebold, Surf. Sci. Rep., 2003, 48, 53–229 CrossRef CAS.
- M. R. Hoffmann, S. T. Martin, W. Choi and D. W. Bahnemann, Chem. Rev., 1995, 95, 69–96 CrossRef CAS.
| This journal is © The Royal Society of Chemistry 2015 |


