Converting real-world mixed waste plastics into porous carbon nanosheets with excellent performance in the adsorption of an organic dye from wastewater†
Jiang
Gong
ab,
Jie
Liu
a,
Xuecheng
Chen
ac,
Zhiwei
Jiang
a,
Xin
Wen
a,
Ewa
Mijowska
c and
Tao
Tang
*a
aState Key Laboratory of Polymer Physics and Chemistry, Changchun Institute of Applied Chemistry, Chinese Academy of Sciences, Changchun 130022, China. E-mail: ttang@ciac.ac.cn; Fax: +86 431 85262827; Tel: +86 431 85262004
bUniversity of Chinese Academy of Sciences, Beijing 100049, China
cInstitute of Chemical and Environment Engineering, West Pomeranian University of Technology, Szczecinul. Pulaskiego 10, 70-322 Szczecin, Poland
First published on 31st October 2014
Abstract
Waste plastic utilization and wastewater treatment are the two most serious challenges on the path to urbanization and industrialization, due to the limited fossil fuel resources, ever-increasing energy demands, and severe environmental pollution. The conversion of waste plastics into high value-added carbon nanomaterials has become a promising way to utilize waste plastics; however, most current studies are limited to single component waste plastic; besides, little attention has been paid to porous carbon nanosheets (PCNSs). Herein, a facile approach was established to prepare PCNSs by the carbonization of real-world mixed waste plastics on organically-modified montmorillonite and subsequent KOH activation. The morphology, microstructure, textural property, phase structure, surface element composition, and thermal stability of the PCNSs were investigated. The PCNSs showed high specific surface area (2315 m2 g−1) and large pore volume (3.319 cm3 g−1) with high purity (>99.6%). More importantly, the PCNSs exhibited fast adsorption (about 95% of methylene blue (MB) was removed during the first 10 min of adsorption), an unprecedented adsorption capacity of 769.2 mg g−1 (higher than most of reported adsorbents), and excellent recyclability (after ten cycles, an adsorption capacity of 692.0 mg g−1 remained and 90 wt% of the PCNS was reclaimed) for MB from wastewater. This was attributed to the high specific surface area and large pore volume of the PCNS, and due to multiple adsorption mechanisms, including pore filling, hydrogen bonding, and π–π and electrostatic interactions between MB and the PCNS. It is believed that this work not only provides a novel potential way to utilize waste plastics, but also presents a facile sustainable approach to synthesize PCNSs, which will be an ideal candidate for various applications.
1. Introduction
Owing to the global scale of severe water pollution from industrial pollutants, the creation of efficient absorbent materials for the separation and removal of pollutants from wastewater is of utmost importance to address the environmental issues.1–10 The adsorption of organic dyes using adsorbents is generally low-cost and versatile, and represents one of the most widely used methods for removing organic dyes from wastewater.11–15 A variety of efficient absorbents, including carbon nanotubes (CNTs),16 graphene,17 activated cup-stacked CNTs (CS-CNTs),18 Ni/C nanomaterials,19 BN hollow spheres,20 Ni nanospheres,21 porous MnO2 microspheres,22 montmorillonite,23 activated CNTs,24 activated carbon,25 ordered mesoporous carbon,26,27 carbon nanofiber (CNF) aerogels,28 and carbonaceous nanofiber membranes,29 have been employed for the adsorption of organic dyes from wastewater. In particular, activated carbon with a huge surface area is extensively applied, due to its high efficiency for the removal of pollutants; however, it shows some drawbacks, such as slow adsorption kinetics, poor selectivity, and limited working capacity for the removal of large-sized molecules.Recently, carbon nanosheets (CNSs), two-dimensional carbon nanostructures of stacked graphene sheets with a few nanometers thickness, have received considerable research interest, because of their high surface area, developed porous structure, abundant surface functional groups, and good chemical and thermal stabilities, and due to their potential applicabilition in various fields, such as adsorption,30 energy storage,31 organic transistor,32 and the oxygen reduction reaction.33 Compared to activated carbon, the much smaller thickness of CNSs enables fast adsorption kinetics and a high utilization degree of the overall porosity and surface area. Additionally, the aggregation or restacking that inevitably occurs in graphene assemblies, and which results in a significant compromise or degradation of the unique properties of individual sheets, can be avoided in a CNS, thanks to its weaker intersheet van der Waals attraction than graphene. As a consequence, their particular physicochemical properties make CNSs ideal absorbents for environmental remediation.
On the other hand, as we know, plastics have become an essential part of our modern lifestyle; the world production of plastics increased from 1.7 million tons in 1950 to 288 million tons in 2012. Correspondingly, more than 25 million tons of waste plastics were generated in 2012 in Europe.34 The ever-increasing generation of waste plastics has created terrible environment issues and further aggravated the energy crisis, because most plastics are not biodegradable and originate from unsustainable fossil fuels. Sustaining development and the growing global demands for energy, chemicals, and materials have fostered research efforts to exploit renewable raw materials to reduce the dependency on the limited fossil fuels35–41 and to develop low environmental impact technologies for the sustainable recycling of waste plastics in place of the current practice of incineration and landfilling.42,43 The mechanical recycling of waste plastics is far from widely accepted by the population because of the low quality of the recycled plastic mixture. Also, chemical recycling can recover the petrochemical components from waste plastics to produce monomers, fuels, gases, and other useful chemicals.44,45 However, the development of facile, economically feasible, sustainable approaches to largely transform waste plastics into high value-added products is extremely important for competitiveness and to stimulate the utilization progress of waste plastics.
Since most plastics contain a high content of carbon, special attention has been focused on the utilization of waste plastics, including polypropylene (PP), polyethylene (PE), and polystyrene (PS), to synthesize valuable carbon nanomaterials (CNMs), such as CNTs, CS-CNTs, CNFs, carbon spheres (CSs), hollow CSs (HCSs), and graphene.46–59 For example, Wu et al. catalyzed the gasification of waste PP and PS into CNTs using Ni–Mn–Al catalyst;46 however, the quality of CNTs needed to be improved. Zhuo et al. synthesized CNTs from recycled PE using stainless-steel wire mesh as a catalyst by a pyrolysis-combustion technique;48 unfortunately, the yield of CNTs was low (about 10%). Pol et al. used an autoclave as a reactor to convert PP and PS into CNTs and CSs, which showed high performance in lithium electrochemical cells;49 but the high pressure nature of the autoclave was not suitable for massive and continuous production. Ruan et al. converted waste PS into high quality graphene using a Cu foil as a template by chemical vapor deposition.52 Our group found that the combination of solid acid (or a halogenated compound, or activated carbon) with a nickel (or cobalt) catalyst could convert PP, PE, and PS into CNTs, CS-CNTs, CNFs, and HCSs with a high yield under atmospheric conditions.53–59 Unfortunately, most current studies are limited to single component waste plastic and no studies involving real-world mixed waste plastics, which mainly consist of PP, PE, and PS,60 have been reported. Therefore, converting real-world mixed waste plastics into high value-added CNMs with controlled morphology and high yield is of great significance for the comprehensive utilization of the large amount of waste plastics.
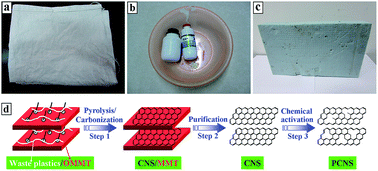
In this work, real-world mixed waste plastics, which consisted of PP from waste woven bags (Fig. 1a), PE from waste vessels (Fig. 1b), and PS from waste foam sheets (Fig. 1c), were effectively transformed into CNSs on organically-modified montmorillonite (OMMT). Compared to other common carbon sources for the synthesis of CNSs, such as hexachloroethane,30 polyaniline,31 pitch,32,61 folic acid,33 methane,62 ladder-like compound,63 phenol-formaldehyde resin,64 resorcinol-formaldehyde resin,65–67 acetylene,68 glycerol, and melamine,69 the reutilization of real-world mixed waste plastics to synthesize CNSs not only has advantages from cheap and abundant sources, and environmentally friendly and cost-effective methods, but it also contributes to sustainable development and relieves the energy crisis. More importantly, after KOH activation, porous CNSs (PCNSs) with a high specific surface area (2315 m2 g−1) and large pore volume (3.319 cm3 g−1) were synthesized, which demonstrated fast adsorption, unprecedented adsorption capacity (769.2 mg g−1, higher than most of reported adsorbents), and excellent recyclability for the removal of methylene blue (MB) from wastewater.
2. Experimental
2.1 Materials
Real-world mixed waste plastics (Fig. 1a–c) were washed and cut into small pieces before being used. OMMT (Closite 15A, organic modifier: dimethyl-dihydrogenated tallow quarternary ammonium, and modifier concentration: 125 mequiv. per 100 g clay) was purchased from Southern Clay. MB was of analytical grade quality and supplied by Alfa Aesar. All other chemicals were of analytical-grade quality. All the solutions were prepared using deionized water and analytical-grade chemicals to eliminate the impurities including oxidation substances.2.2 Preparation of PCNSs
Real-world mixed waste plastics (15.00 g) consisting of PP (26.9 wt%, 4.04 g), PE (56.3 wt%, 8.45 g), and PS (16.8 wt%, 2.51 g) according to previous work60 were mixed with OMMT at a weight ratio of 1![[thin space (1/6-em)]](https://www.rsc.org/images/entities/char_2009.gif) :
:![[thin space (1/6-em)]](https://www.rsc.org/images/entities/char_2009.gif) 4 in a Brabender mixer at 100 rpm and 190 °C for 5 min. CNS/MMT composite was first synthesized by carbonizing the resultant mixed waste plastics/OMMT composite (Fig. 1d, step 1) in a conventional quartz tube reactor with an internal diameter of 60 mm at 700 °C under a N2 atmosphere (Fig. S1 in the ESI†). A previous study demonstrated that OMMT not only promotes the degradation of mixed plastics into aromatics and light hydrocarbons, but also catalyzes these degradation products into CNS through a polymerization mechanism.70 Subsequently, after purifying the CNS/MMT composite by hydrofluoric acid and nitric acid (Fig. 1d, step 2), 9.10 g of CNSs was obtained, and then mixed with KOH at a weight ratio of 1
4 in a Brabender mixer at 100 rpm and 190 °C for 5 min. CNS/MMT composite was first synthesized by carbonizing the resultant mixed waste plastics/OMMT composite (Fig. 1d, step 1) in a conventional quartz tube reactor with an internal diameter of 60 mm at 700 °C under a N2 atmosphere (Fig. S1 in the ESI†). A previous study demonstrated that OMMT not only promotes the degradation of mixed plastics into aromatics and light hydrocarbons, but also catalyzes these degradation products into CNS through a polymerization mechanism.70 Subsequently, after purifying the CNS/MMT composite by hydrofluoric acid and nitric acid (Fig. 1d, step 2), 9.10 g of CNSs was obtained, and then mixed with KOH at a weight ratio of 1![[thin space (1/6-em)]](https://www.rsc.org/images/entities/char_2009.gif) :
:![[thin space (1/6-em)]](https://www.rsc.org/images/entities/char_2009.gif) 6 and chemically activated at 850 °C for 1.5 h under an Ar atmosphere. The resultant product was washed with 15 wt% HCl solution and deionized water to neutral conditions, and finally dried at 120 °C for 12 h (Fig. 1d, step 3) to prepare the PCNSs (6.47 g).
6 and chemically activated at 850 °C for 1.5 h under an Ar atmosphere. The resultant product was washed with 15 wt% HCl solution and deionized water to neutral conditions, and finally dried at 120 °C for 12 h (Fig. 1d, step 3) to prepare the PCNSs (6.47 g).
2.3 Characterization
The morphologies of the CNSs and PCNSs were observed by field-emission scanning electron microscope (FE-SEM, XL30ESEM-FEG). The microstructures of the CNSs and PCNSs were investigated using transmission electron microscope (TEM, JEM-1011) at an accelerating voltage of 100 kV and a high-resolution TEM (HRTEM) on a FEI Tecnai G2 S-Twin transmission electron microscope operating at 200 kV. The phase structures of the CNSs and PCNSs were analyzed by X-ray diffraction (XRD) using a D8 advance X-ray diffractometer with Cu Kα radiation operating at 40 kV and 200 mA. Raman spectroscopy (T6400, excitation-beam wavelength: 514.5 nm) was used to characterize the vibrational properties of the CNSs and PCNSs. The textural properties of the CNSs and PCNSs were measured by nitrogen adsorption/desorption at 77 K using a Quantachrome Autosorb-1C-MS analyzer. The specific surface area was calculated by the Brunauer–Emmett–Teller (BET) method. The surface element compositions of the CNSs and PCNSs were characterized by means of X-ray photoelectron spectroscopy (XPS) carried out on a VG ESCALAB MK II spectrometer using an Al Kα exciting radiation from an X-ray source operated at 10.0 kV and 10 mA. The thermal stabilities of the CNSs and PCNSs were measured by thermal gravimetric analysis (TGA) under air flow at a heating rate of 10 °C min−1 using a TA Instruments SDT Q600. The functional groups of the PCNSs before and after MB adsorption, and pure MB, were characterized by Fourier-transform infrared spectroscopy (FT-IR, Bio-Rad FTS-135).2.4 Adsorption experiment
The adsorption experiment of MB using CNSs or PCNSs was carried out in a batch process by stirring 25.0 mg CNSs or PCNSs in 50.0 mL of MB solution in a 100 mL polyethylene flask. The equipment was exposed to a normal slight white light source, which was far away from UV light. A working solution of MB was prepared from the stock solution (1000 mg L−1) to the desired concentration for each experimental run. The pH of MB solution was adjusted to 6 by 0.5 mol L−1 HCl solution. After stirring for 180 min, 1.0 mL of MB solution was withdrawn by a syringe, diluted, and filtered through a 0.25 μm membrane for later analysis of MB concentration. The absorbance of MB solution was measured by UV/Vis/NIR spectrophotometer (Lambda 900) to monitor the absorbance at λmax = 665 ± 1 nm, corresponding to the maximum absorbance. The concentration of MB solution was determined by a linear regression equation obtained by plotting the calibration curve for MB over a range of concentrations.3. Results and discussion
3.1 Morphology and microstructure
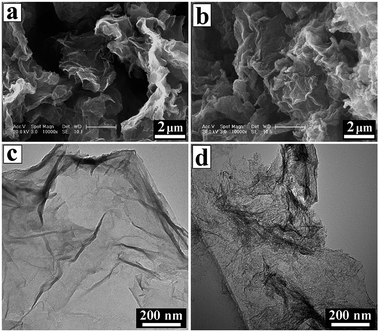
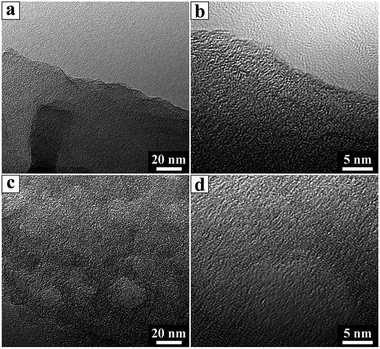
FE-SEM and TEM observations were conducted to characterize the morphologies of the CNSs and PCNSs. FE-SEM images of the CNSs and PCNSs depicted a layered morphology consisting of thin, leaf-like nanosheets ranging from hundreds of nanometers to several micrometers in length (Fig. 2a and b). TEM analyses verified the sheets like-arrangement of the CNSs with randomly arranged wrinkled structures and rough surfaces (Fig. 2c). Likewise, the PCNSs maintained a crumbled thin sheet structure (Fig. 2b), but their surfaces were obviously rougher than that of the CNSs (Fig. 2d). HRTEM was used to further study the microstructures of the CNSs and PCNSs. A slight degree of ordering was observed in the CNSs (Fig. 3a and b), which revealed a low graphitization degree. After KOH activation, a porous structure with several to a dozen nanometers was formed in the PCNSs (Fig. 3c), similar to porous graphene activated by KOH, as reported previously,71 indicating that this activation process was able to etch graphitic layers to generate a porous structure.The activation mechanism is normally suggested to include independent hydroxide and redox processes during the reaction. With activation treatment, KOH powder can react with carbon as follows:72
| 6KOH + 2C → 2K + 3H2 + 2K2CO3 | (1) |
When the temperature is higher than 700 °C, the reaction proceeds as follows:
| K2CO3 + C ↔ K2O + 2CO | (2) |
| K2CO3 ↔ K2O + CO2 | (3) |
| 2K + CO2 ↔ K2O + CO | (4) |
When the temperature is higher than 800 °C, the reaction proceeds as follows:
| K2O + C ↔ 2K + CO | (5) |
The etched pores played crucial roles in the adsorption process of the dye, not only as diffusive channels but also as active sites for adsorption capacity enhancement because of the pore edges. Thereby, it is expected that the synthesized PCNSs could be used as an adsorbent in environmental remediation. Moreover, the PCNSs exhibited slightly serrated edges and showed randomly oriented lattice fringes compared with the CNS, which indicated that the stacking of graphene layers in the PCNSs had become a little more disordered (Fig. 3d).
3.2 Textural property, phase structure, surface element composition, and thermal stability
To analyze the textural properties of CNSs and PCNSs, nitrogen adsorption/desorption measurements were carried out at 77 K. It was evident that PCNSs presented the combined type I/IV physisorption isotherm (Fig. 4a). A high adsorption capacity was observed at low relative pressure (P/P0 < 0.1), which indicated the presence of a lot of micropores in the PCNSs. The type-H4 hysteresis loop at a relative pressure P/P0 ranging from 0.4 to 1.0, which resulted from the filling and emptying of mesopores by capillary condensation, demonstrated the formation of a large number of mesopores in the PCNSs. The BET surface area (SBET) and pore volume (V) of the PCNSs were calculated to be 2315.0 m2 g−1, which is close to the theoretical value of graphene (2650 m2 g−1), and 3.319 cm3 g−1, respectively. Compared with CNSs (113.4 m2 g−1 and 0.492 cm3 g−1), the large SBET and V enhancements of the PCNSs were attributed to KOH activation, which is a very efficient method to etch pores and increase the content of defective and edge sites. The pore size distributions were calculated using the Barrett–Joyner–Halenda model from the desorption branches of the isotherms. As shown in Fig. 4b, the PCNSs mainly exhibited a narrow pore size distribution, with an average diameter (DAV) of about 3.8 nm, which was in good agreement with the pore size observed from the HRTEM image.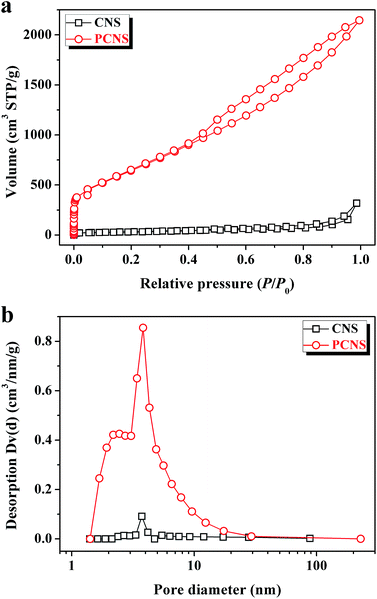 | ||
| Fig. 4 Nitrogen adsorption/desorption isotherms (a) and pore size distributions (b) of CNSs and PCNSs. | ||
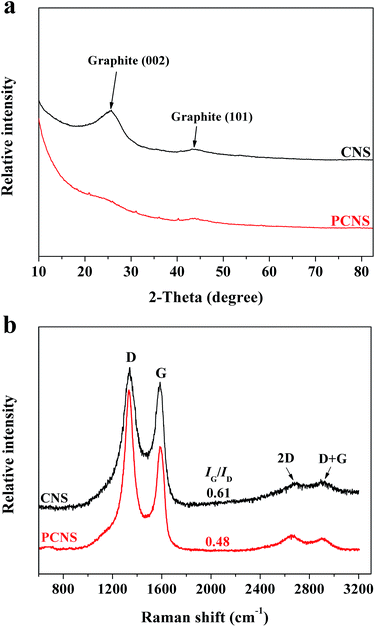
To investigate the phase structures of the CNSs and PCNSs, XRD characterization was employed (Fig. 5a). The appearance of two broad and weak diffraction peaks at 2θ = 26.3° and 43.2°, which were assigned to the typical graphitic (002) and (101) planes,73 respectively, revealed the low graphitization degree of the CNSs. The absence of the characteristic peak of pristine graphite at 2θ = 26.3° reflected the amorphous nature and irregular arrangement of carbon layers in the obtained PCNSs, which was consistent with the HRTEM observation. Raman spectroscopy was further used to gain more insights into the phase structure information of the CNSs and PCNSs (Fig. 5b). The D band at 1350 cm−1 and G band at 1580 cm−1 are related to the disordered and defective structure of carbon material and the ordered carbon structure with a sp2 electronic configuration, respectively. It is well known that the intensity ratio of the G/D peak (IG/ID) is often applied to estimate the degree of perfection of graphene planes.56 After KOH activation, the IG/ID value decreased from 0.61 for the CNSs to 0.48 for the PCNSs, which resulted from the generation of many defects during KOH activation. Besides, the negligible 2D band at about 2660 cm−1 and D + G band at about 2880 cm−1 verified the amorphous nature and multilayer of both the CNSs and PCNSs.74
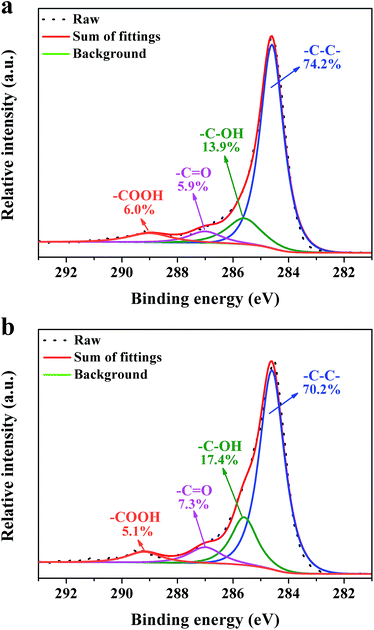
XPS measurements were carried out to get detailed bonding information and quantify the elemental atom ratios in the CNSs and PCNSs. Fig. S2† shows the survey scan spectra with apparent C 1s (284.6 eV) and O 1s (532.3 eV) peaks. The high-resolution C 1s XPS spectra are curve-fitted into four individual peaks: graphitic carbon (284.4–284.6 eV), –C–OH (285.6–285.7 eV), –C![[double bond, length as m-dash]](https://www.rsc.org/images/entities/char_e001.gif) O (286.7–287.0 eV), and –COOH (288.7–289.0 eV),75 as displayed in Fig. 6. Compared with the CNSs, the PCNSs possessed relatively higher oxygen content and more surface functional groups, including –C–OH and –C
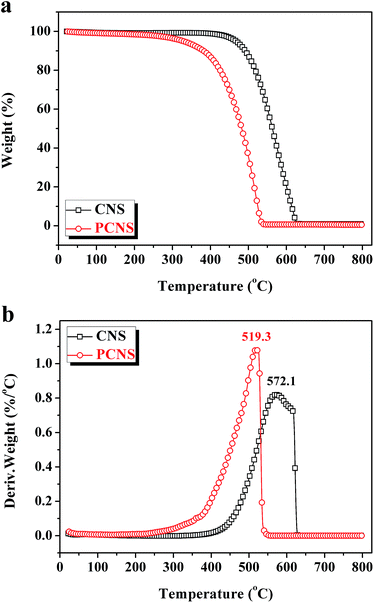
O (286.7–287.0 eV), and –COOH (288.7–289.0 eV),75 as displayed in Fig. 6. Compared with the CNSs, the PCNSs possessed relatively higher oxygen content and more surface functional groups, including –C–OH and –C![[double bond, length as m-dash]](https://www.rsc.org/images/entities/char_e001.gif) O, which facilitate the removal of heavy metallic ions or cationic dyes from wastewater.76 TGA and the derivate TGA (DTG) were used to evaluate the graphitic nature and purity of the CNSs and PCNSs (Fig. 7). The first weak region of weight loss from 100 °C to 400 °C was attributed to the release of chemisorbed water and the pyrolysis of oxygen-containing functional groups. A remarkable weight loss occurred between 400 °C and 700 °C, which was ascribed to the oxidation of the carbon skeleton of the graphene sheets. The lower maximum oxidation temperature of PCNSs (519.3 °C) than that of CNSs (572.1 °C) demonstrated the formation of a lot of defects and/or oxygen-containing functional groups by KOH activation. The residues of the CNSs and PCNSs at 800 °C were less than 0.4%, indicating that the CNSs and PCNSs were of high purity.
O, which facilitate the removal of heavy metallic ions or cationic dyes from wastewater.76 TGA and the derivate TGA (DTG) were used to evaluate the graphitic nature and purity of the CNSs and PCNSs (Fig. 7). The first weak region of weight loss from 100 °C to 400 °C was attributed to the release of chemisorbed water and the pyrolysis of oxygen-containing functional groups. A remarkable weight loss occurred between 400 °C and 700 °C, which was ascribed to the oxidation of the carbon skeleton of the graphene sheets. The lower maximum oxidation temperature of PCNSs (519.3 °C) than that of CNSs (572.1 °C) demonstrated the formation of a lot of defects and/or oxygen-containing functional groups by KOH activation. The residues of the CNSs and PCNSs at 800 °C were less than 0.4%, indicating that the CNSs and PCNSs were of high purity.
3.3 Application in adsorption of MB
In the above mentioned results, real-world mixed waste plastics were catalyzed into PCNSs with a high SBET and large V, as well as abundant surface functional groups, using a facile sustainable approach. It is very attractive for academic and industrial communities to explore their potential applications in environmental remediation, energy storage, and catalysis, etc. In this work, as an example, PCNSs were utilized for the adsorption of MB from wastewater. Our previous studies showed that the removal efficiency of MB by PCNSs in normal slight white light was very close to that in the dark environment or under UV light (Fig. S3†). This demonstrated that the photo-degradation of MB by PCNSs under our experimental conditions could be neglected and hence that the removal of MB resulted from the adsorption.The equilibrium isotherm describes how the adsorbent interacts with the adsorbate, and the correlation of the experimental result to the adsorption model can help to understand the adsorption mechanism. The Langmuir model was employed to represent the relationship between the equilibrium adsorption capacity (qe, mg g−1) of MB on the CNSs (or PCNSs) and its equilibrium solute concentration (Ce, mg L−1), as follows:
| qe = qmKLCe/(1 + KLCe) | (6) |
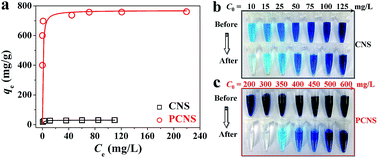
Fig. 8a shows the equilibrium adsorption isotherms of MB on the CNSs and PCNSs. The isotherms belonged to a type I curve, which is characteristic of the Langmuir isotherm. That is to say, the amount of adsorbed MB dramatically increased at a lower final solution concentration, suggesting a high affinity between MB molecules and the PCNS surface. The adsorbed amount then reached a plateau at a higher equilibrium solution concentration, reflecting the saturated adsorption. As shown in Table 1, the R2 value exceeded 0.999, meaning that the Langmuir model fitted well the experimental result. The qm of the PCNSs for MB was as high as 769.2 mg g−1, which was more than 24 times higher than that of the CNSs (30.3 mg g−1). More importantly, compared to other reported adsorbents (Table 2), including graphene,17 activated CS-CNTs,18 Ni/C nanomaterials,19 BN hollow spheres,20 Ni nanospheres,21 porous MnO2 microspheres,22 montmorillonite,23 activated CNTs,24 activated carbon,25 CNSs,69 ordered mesoporous carbon,26 and CNF aerogels,28 it could be clearly seen that the PCNSs showed an excellent adsorption performance of MB. Additionally, optical photographs were taken before and after MB adsorption (Fig. 8b and c). For example, after the adsorption of MB with an initial concentration of 300 mg L−1 on the PCNSs, the polluted water became clear and colorless. This phenomenon further revealed the efficient adsorption and distinct decolouration for tinctorial wastewater using PCNSs. Specifically, about 95% of MB was removed by the PCNSs during the first 10 min of adsorption, while only a small portion of the additional removal occurred during the remainder of the time.
| Parameter | CNS | PCNS |
|---|---|---|
| q m (mg g−1) | 30.3 | 769.2 |
| K L (L mg−1) | 0.72 | 3.25 |
| R 2 | 0.9994 | 0.9999 |
| Adsorbent | Adsorption capacity (mg g−1) | Reference |
|---|---|---|
| CNS | 30.3 | This work |
| Graphene nanosheet | 111.62 | 17 |
| Activated CS-CNT | 172.4 | 18 |
| Ni/C nanomaterial | 175.2 | 19 |
| BN hollow sphere | 191.7 | 20 |
| Ni nanosphere | 250 | 21 |
| Porous MnO2 microsphere | 259.2 | 22 |
| Montmorillonite | 300.3 | 23 |
| Activated CNT | 400 | 24 |
| Activated carbon | 452.2 | 25 |
| CNS | 585 | 69 |
| Ordered mesoporous carbon | 758 | 26 |
| PCNS | 769.2 | This work |
| CNF aerogel | 800 | 28 |
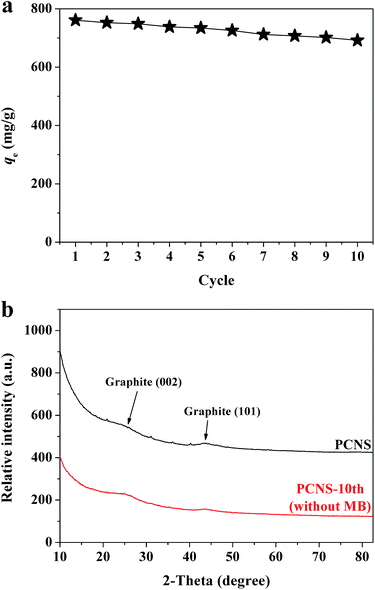
The recyclablity and reusability of adsorbent are very important to its practical applications. In this study, the regeneration of the PCNSs after MB adsorption was conducted by thermal annealing under Ar atmosphere. Fig. 9a shows the adsorption performance of reclaimed PCNSs. The adsorption capacity of the PCNSs after five cycles was 734.4 mg g−1, which was approximately 96% of the original capacity (761.1 mg g−1). After ten cycles, the PCNSs still performed excellently with an adsorption capacity of 692.0 mg g−1 for the removal of MB, which was approximately 91% of the original capacity. These values were still higher than many of those reported adsorbents (Table 2). Besides, after ten cycles, about 90 wt% of the PCNS were recovered.
As is well known, the adsorption reaction may lead to changes in the phase and textural structures of the adsorbent, and hence an understanding of the resulting structural changes of the adsorbent during adsorption could provide valuable information regarding the adsorption mechanism. XRD patterns taken before and after MB adsorption are thus displayed in Fig. 9b, which indicated no any appreciable changes in the patterns, and showing that no other peaks corresponding to impurities were detected. This suggested that the MB molecules adsorbed by the PCNSs did not alter the phase structure of the PCNS, that is to say, the adsorption was physical in nature.
As a result, the decrease in the adsorption capacity after ten cycles may probably be ascribed to the textural change of the PCNS. To confirm this speculation, nitrogen adsorption/desorption measurements were used to characterize the change of pore structures of the PCNSs before and after MB adsorption. As presented in Fig. 10, the nitrogen adsorption/desorption isotherms of the original, used, and recycled PCNSs are similar in shape. The hysteresis in the relative pressure range of 0.4–1.0 was maintained with similar pore size distributions. As shown in Table 3, after the adsorption of MB (the first cycle), the SBET and V of the PCNSs decreased from 2315.0 m2 g−1 to 1078.0 m2 g−1, and from 3.319 cm3 g−1 to 1.792 cm3 g−1, respectively, which can be explained by the mesopores favoring the adsorbate–adsorbate interaction via a mesopore filling mechanism. Besides, one could see that the nitrogen adsorption/desorption isotherm and pore size distribution of the regenerated PCNSs (PCNS-10th) are quite similar to those of the original PCNSs. However, slight decreases of SBET and V of the PCNS-10th were observed, which are probably attributed to the deposition of MB molecules on the PCNS surface during thermal annealing.
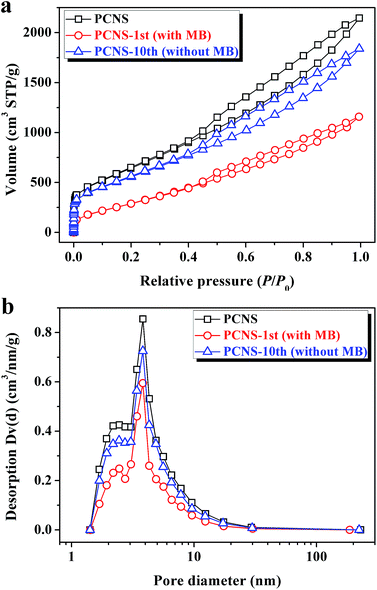 | ||
| Fig. 10 Nitrogen adsorption/desorption isotherms (a) and pore size distributions (b) of PCNSs before and after MB adsorption (the first cycle), and PCNSs after ten cycles. | ||
| Property | PCNS | PCNS-1st (with MB) | PCNS-10th (without MB) |
|---|---|---|---|
| S BET (m2 g−1) | 2315.0 | 1078.0 | 1990.2 |
| V (cm3 g−1) | 3.319 | 1.792 | 2.854 |
| D AV (nm) | 3.83 | 3.82 | 3.82 |
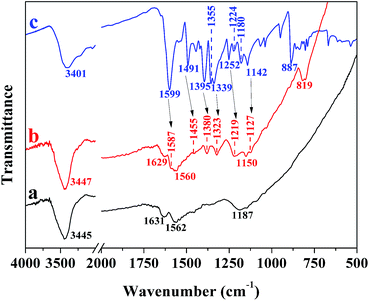
FT-IR spectra of PCNSs before and after the adsorption of MB, and pure MB were analyzed to gain more insights into the adsorption mechanism. The FT-IR spectrum of the PCNSs (Fig. 11a) confirmed the presence of functional groups, including –OH (3445 cm−1), –C![[double bond, length as m-dash]](https://www.rsc.org/images/entities/char_e001.gif) C– (1631 cm−1), –C
C– (1631 cm−1), –C![[double bond, length as m-dash]](https://www.rsc.org/images/entities/char_e001.gif) O (1562 cm−1), and –C–O– (1187 cm−1), which not only leads to the hydrophilic nature of PCNS, but also act as anchoring sites for MB molecules. In the case of MB (Fig. 11c), the peaks at 1599 cm−1 and 1395 cm−1 were assigned to the stretching vibrations of C
O (1562 cm−1), and –C–O– (1187 cm−1), which not only leads to the hydrophilic nature of PCNS, but also act as anchoring sites for MB molecules. In the case of MB (Fig. 11c), the peaks at 1599 cm−1 and 1395 cm−1 were assigned to the stretching vibrations of C![[double bond, length as m-dash]](https://www.rsc.org/images/entities/char_e001.gif) N (and C
N (and C![[double bond, length as m-dash]](https://www.rsc.org/images/entities/char_e001.gif) C) and C–N bonds in the heterocycle of MB, respectively, while the peaks at 1355 cm−1 and 1339 cm−1 were attributed to the stretching vibration of C–N bond connected with benzene ring and N–CH3 bond. The band at about 1491 cm−1 was ascribed to the CH2 deformation vibration, while the band around 1395 cm−1 was due to the CH3 deformation vibration. Furthermore, the bands at about 1252 cm−1 and 1224 cm−1 were due to Ar–N deformation vibration, the bands abound 1180 cm−1 and 1142 cm−1 to the stretching vibrations of C
C) and C–N bonds in the heterocycle of MB, respectively, while the peaks at 1355 cm−1 and 1339 cm−1 were attributed to the stretching vibration of C–N bond connected with benzene ring and N–CH3 bond. The band at about 1491 cm−1 was ascribed to the CH2 deformation vibration, while the band around 1395 cm−1 was due to the CH3 deformation vibration. Furthermore, the bands at about 1252 cm−1 and 1224 cm−1 were due to Ar–N deformation vibration, the bands abound 1180 cm−1 and 1142 cm−1 to the stretching vibrations of C![[double bond, length as m-dash]](https://www.rsc.org/images/entities/char_e001.gif) S and C–S, and the band around 887 cm−1 to the wagging vibration of C–H in the aromatic ring of MB.
S and C–S, and the band around 887 cm−1 to the wagging vibration of C–H in the aromatic ring of MB.
After being adsorbed by the PCNS, obvious shifts were observed to 1587 cm−1 and 1380 cm−1 for the C![[double bond, length as m-dash]](https://www.rsc.org/images/entities/char_e001.gif) N (and C
N (and C![[double bond, length as m-dash]](https://www.rsc.org/images/entities/char_e001.gif) C) and C–N bonds in the heterocycle of MB and to 1455 cm−1 for the CH2 deformation vibration in the benzene ring (Fig. 11b), which corresponded to the attachment of MB on the surface of PCNSs by π–π stacking interactions between the aromatic backbone of MB and the hexagonal skeleton of the PCNS, since MB is ideally a planar molecule. This could be further proved by the appearance of a new band (819 cm−1), which was ascribed to the wagging vibration of C–H in the aromatic ring of MB. Besides, the peaks associated with the C–N bond connected with the benzene ring and N–CH3 bond, the Ar–N deformation vibration, and the stretching vibrations of C
C) and C–N bonds in the heterocycle of MB and to 1455 cm−1 for the CH2 deformation vibration in the benzene ring (Fig. 11b), which corresponded to the attachment of MB on the surface of PCNSs by π–π stacking interactions between the aromatic backbone of MB and the hexagonal skeleton of the PCNS, since MB is ideally a planar molecule. This could be further proved by the appearance of a new band (819 cm−1), which was ascribed to the wagging vibration of C–H in the aromatic ring of MB. Besides, the peaks associated with the C–N bond connected with the benzene ring and N–CH3 bond, the Ar–N deformation vibration, and the stretching vibrations of C![[double bond, length as m-dash]](https://www.rsc.org/images/entities/char_e001.gif) S and C–S were broadened with significant decreases in intensity and shifted to 1323, 1219, 1150, and 1127 cm−1, respectively. This suggested that the nitrogen atom of the C–N group and the sulfur atom of the C–S group could be used as the hydrogen-bonding acceptor, and hence formed intramolecular hydrogen bonding with the hydrogen atom of the hydroxyl group of the PCNS, since MB is a kind of cationic dye which can be adsorbed easily by electrostatic forces on negatively charged surfaces.
S and C–S were broadened with significant decreases in intensity and shifted to 1323, 1219, 1150, and 1127 cm−1, respectively. This suggested that the nitrogen atom of the C–N group and the sulfur atom of the C–S group could be used as the hydrogen-bonding acceptor, and hence formed intramolecular hydrogen bonding with the hydrogen atom of the hydroxyl group of the PCNS, since MB is a kind of cationic dye which can be adsorbed easily by electrostatic forces on negatively charged surfaces.
As a consequence, the excellent performance of the PCNSs in the adsorption of MB resulted from the high specific surface area and large pore volume of the PCNSs, and by multiple adsorption interaction mechanisms, including pore filling, hydrogen bonding, π–π and electrostatic interactions between MB and the PCNSs, as schematically illustrated in Fig. 12.
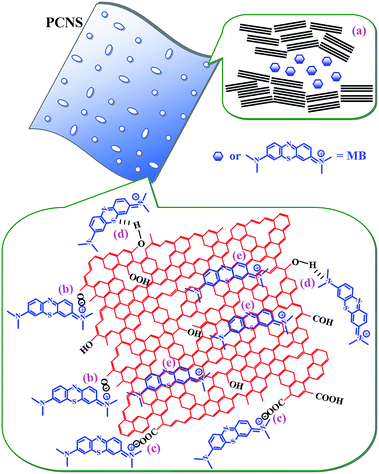 | ||
| Fig. 12 Schematic illustration of the interactions between PCNS and MB: (a) pore filling, (b and c) electrostatic attraction, (d) hydrogen bonding and (e) π–π interactions. | ||
From the above mentioned results, it is clear that our method shows several advantages. First, the carbon feedstock for the synthesis of PCNSs comes from real-world mixed waste plastics, which are rather cheap and easy available. To the best of our knowledge, this is the first report to convert real-world mixed waste plastics into PCNSs. Second, our work contributes to sustainable development. This is because most waste plastics from unsustainable fossil fuels are not biodegradable, which creates environmental pollution (such as “white pollution”). Third, the proposed method is facile and easily operated. Finally, the resultant PCNSs display excellent performance in the adsorption of MB from wastewater, demonstrating their potential application in wastewater treatment.
Besides, since continuous adsorption in fixed-bed columns can be easily scaled up and is simple to operate and also more beneficial than batch adsorption from an industrial point of view, more investigation involving column adsorption studies of PCNSs for real samples will be conducted in future work.
4. Conclusions
We successfully converted real-world mixed waste plastics containing PP, PE, and PS into high value-added PCNSs using a facile approach. The PCNSs had randomly oriented lattice fringes and displayed a layered morphology consisting of thin, leaf-like nanosheets ranging from hundreds of nanometers to several micrometers in length. Besides, the PCNSs showed a high specific surface area (2315.0 m2 g−1) and large pore volume (3.319 cm3 g−1) with high purity and abundant surface functional groups. More importantly, it was demonstrated that the PCNSs exhibited fast adsorption, an unprecedented adsorption capacity of 769.2 mg g−1 (higher than most of reported adsorbents), and excellent recyclability (after ten cycles, the adsorption capacity of 692.0 mg g−1 remained, and 90 wt% of the PCNSs were recovered) for the removal of MB from wastewater. This results from the high specific surface area and large pore volume of the PCNSs, and their multiple adsorption mechanisms, including pore filling, hydrogen bonding, and π–π and electrostatic interactions between MB and the PCNS. That is to say, PCNSs were shown to be promising adsorbents for practical applications. It is worth noting that the gas and liquid products of real-world mixed waste plastics (e.g., hydrogen, propylene and benzene) during the formation of CNSs could be used as important chemical raw materials. It is believed that this work not only opens up a novel way to recycle waste plastics, but also presents a facile sustainable approach to synthesize PCNSs, which will be ideal candidates for many applications, such as enviromental remediation, energy storage, and catalysis, etc. The related investigations are ongoing in our laboratory.Acknowledgements
We would like to thank the reviewers for kind and important suggestions. This work was supported by the National Natural Science Foundation of China (51373171, 21204079, 51233005 and 21374114) and Polish Foundation (no. 2011/03/D/ST5/06119).References
- V. K. Gupta, R. Jain, A. Mittal, T. A. Saleh, A. Nayak, S. Agarwal and S. Sikarwar, Mater. Sci. Eng., C, 2012, 32, 12–17 CrossRef CAS PubMed.
- T. A. Saleh and V. K. Gupta, Environ. Sci. Pollut. Res., 2012, 19, 1224–1228 CrossRef CAS PubMed.
- V. K. Gupta, S. K. Srivastava, D. Mohan and S. Sharma, Waste Manage., 1997, 17(8), 517–522 CrossRef CAS.
- V. K. Gupta, S. Agarwal and T. A. Saleh, J. Hazard. Mater., 2011, 185, 17–23 CrossRef CAS PubMed.
- V. K. Gupta, I. Ali, T. A. Saleh, A. Nayak and S. Agarwal, RSC Adv., 2012, 2, 6380–6388 RSC.
- V. K. Gupta, R. Jain, A. Nayak, S. Agarwal and M. Shrivastava, Mater. Sci. Eng., C, 2011, 31, 1062–1067 CrossRef CAS PubMed.
- V. K. Gupta and A. Nayak, Chem. Eng. J., 2012, 180, 81–90 CrossRef CAS PubMed.
- T. A. Saleh and V. K. Gupta, J. Colloid Interface Sci., 2012, 371, 101–106 CrossRef CAS PubMed.
- H. Khani, M. K. Rofouei, P. Arab, V. K. Gupta and Z. Vafaei, J. Hazard. Mater., 2010, 183, 402–409 CrossRef CAS PubMed.
- S. Karthikeyan, V. K. Gupta, R. Boopathy, A. Titus and G. Sekaran, J. Mol. Liq., 2012, 173, 153–163 CrossRef CAS PubMed.
- A. Mittal, J. Mittal, A. Malviya, D. Kaur and V. K. Gupta, J. Colloid Interface Sci., 2010, 342, 518–527 CrossRef CAS PubMed.
- A. Mittal, D. Kaur, A. Malviya, J. Mittal and V. K. Gupta, J. Colloid Interface Sci., 2009, 337, 345–354 CrossRef CAS PubMed.
- A. Mittal, J. Mittal, A. Malviya and V. K. Gupta, J. Colloid Interface Sci., 2009, 340, 16–26 CrossRef CAS PubMed.
- A. Mittal, J. Mittal, A. Malviya and V. K. Gupta, J. Colloid Interface Sci., 2010, 344, 497–507 CrossRef CAS PubMed.
- A. K. Jain, V. K. Gupta, A. Bhatnagar and Suhas, Sep. Sci. Technol., 2003, 38(2), 463–481 CrossRef CAS PubMed.
- M. M. Khin, A. S. Nair, V. J. Babu, R. Murugan and S. Ramakrishna, Energy Environ. Sci., 2012, 5, 8075–8109 CAS.
- Z. J. Fan, W. Kai, J. Yan, T. Wei, L. J. Zhi, J. Feng, Y. M. Ren, L. P. Song and F. Wei, ACS Nano, 2011, 5(1), 191–198 CrossRef CAS PubMed.
- J. Gong, J. D. Feng, J. Liu, Z. W. Jiang, X. C. Chen, E. Mijowska, X. Wen and T. Tang, Chem. Eng. J., 2014, 248, 27–40 CrossRef CAS PubMed.
- J. Gong, K. Yao, J. Liu, X. Wen, X. C. Chen, Z. W. Jiang, E. Mijowska and T. Tang, Chem. Eng. J., 2013, 215–216, 339–347 CrossRef CAS PubMed.
- G. Lian, X. Zhang, S. J. Zhang, D. Liu, D. L. Cui and Q. L. Wang, Energy Environ. Sci., 2012, 5, 7072–7080 CAS.
- A. Ghosal, J. Shah, R. K. Kotnala and S. Ahmad, J. Mater. Chem. A, 2013, 1, 12868–12878 CAS.
- R. Chen, J. Yu and W. Xiao, J. Mater. Chem. A, 2013, 1, 11682–11690 CAS.
- C. A. P. Almeida, N. A. Debacher, A. J. Downs, L. Cottet and C. A. D. Mello, J. Colloid Interface Sci., 2009, 332, 46–53 CrossRef CAS PubMed.
- J. Ma, F. Yu, L. Zhou, L. Jin, M. X. Yang, J. S. Luan, Y. H. Tang, H. B. Fan, Z. W. Yuan and J. H. Chen, ACS Appl. Mater. Interfaces, 2012, 4, 5749–5760 CAS.
- B. H. Hameed, A. T. M. Din and A. L. Ahmad, J. Hazard. Mater., 2007, 141, 819–825 CrossRef CAS PubMed.
- X. Zhuang, Y. Wan, C. M. Feng, Y. Shen and D. Y. Zhao, Chem. Mater., 2009, 21, 706–716 CrossRef CAS.
- W. Teng, Z. X. Wu, J. W. Fan, H. Chen, D. Feng, Y. Y. Lv, J. X. Wang, A. M. Asirid and D. Y. Zhao, Energy Environ. Sci., 2013, 6, 2765–2776 CAS.
- H. W. Liang, Q. F. Guan, L. F. Chen, Z. Zhu, W. J. Zhang and S. H. Yu, Angew. Chem., Int. Ed., 2012, 124, 5191–5195 CrossRef.
- H. W. Liang, X. Cao, W. J. Zhang, H. T. Lin, F. Zhou, L. F. Chen and S. H. Yu, Adv. Funct. Mater., 2011, 21, 3851–3858 CrossRef CAS.
- S. Y. Sawant, R. S. Somani, S. S. Sharma and H. C. Bajaj, Carbon, 2014, 68, 2100–2200 CrossRef PubMed.
- Q. Wen, S. Y. Wang, J. Yan, L. J. Cong, Y. Chen and H. Y. Xi, Bioelectrochemistry, 2014, 95, 23–28 CrossRef CAS PubMed.
- J. S. Lee, H. I. Joh, T. W. Kim and S. Lee, Org. Electron., 2014, 15, 132–138 CrossRef CAS PubMed.
- Y. C. Wang and X. E. Jiang, ACS Appl. Mater. Interfaces, 2013, 5, 11597–11602 CAS.
- PlasticEurope, EuPC, EuPR and EPRO, Plastics–the Facts 2013, An analysis of European latest plastics production, demand and waste data, Brussels, 2013 Search PubMed.
- R. Luque, L. Herrero-Davila, J. M. Campelo, J. H. Clark, J. M. Hidalgo, D. Luna, J. M. Marinas and A. A. Romero, Energy Environ. Sci., 2008, 1, 542–564 CAS.
- M. M. Titirici and M. Antonietti, Chem. Soc. Rev., 2010, 39, 103–116 RSC.
- B. Hu, K. Wang, L. H. Wu, S. H. Yu, M. Antonietti and M. M. Titirici, Adv. Mater., 2010, 22, 813–828 CrossRef CAS PubMed.
- J. A. Melero, J. Iglesias and A. Garcia, Energy Environ. Sci., 2012, 5, 7393–7420 CAS.
- M. M. Titirici, R. J. White, C. Falco and M. Sevilla, Energy Environ. Sci., 2012, 5, 6796–6822 Search PubMed.
- M. Biswal, A. Banerjee, M. Deo and S. Ogale, Energy Environ. Sci., 2013, 6, 1249–1259 CAS.
- C. S. K. Lin, L. A. Pfaltzgraff, L. Herrero-Davila, E. B. Mubofu, S. Abderrahim, J. H. Clark, A. A. Koutinas, N. Kopsahelis, K. Stamatelatou, F. Dickson, S. Thankappan, Z. Mohamed, R. Brocklesby and R. Luque, Energy Environ. Sci., 2013, 6, 426–464 CAS.
- O. Eriksson and G. Finnveden, Energy Environ. Sci., 2009, 2, 907–914 CAS.
- B. Baytekin, H. T. Baytekin and B. A. Grzybowski, Energy Environ. Sci., 2013, 6, 3467–3482 CAS.
- P. T. Williams and E. Slaney, Resour., Conserv. Recycl., 2007, 51, 754–769 CrossRef PubMed.
- D. P. Serrano, J. Aguado and J. M. Escola, ACS Catal., 2012, 2, 1924–1941 CrossRef CAS.
- C. F. Wu, M. A. Nahil, N. Miskolczi, J. Huang and P. T. Williams, Environ. Sci. Technol., 2014, 48, 819–826 CrossRef CAS PubMed.
- J. C. Acomb, C. F. Wu and P. T. Williams, Appl. Catal., B, 2014, 147, 571–584 CrossRef CAS PubMed.
- C. W. Zhuo, B. Hall, H. Richter and Y. Levendis, Carbon, 2010, 48, 4024–4034 CrossRef CAS PubMed.
- V. G. Pol and M. M. Thackeray, Energy Environ. Sci., 2011, 4, 1904–1912 CAS.
- V. G. Pol, Environ. Sci. Technol., 2010, 44, 4753–4759 CrossRef CAS PubMed.
- L. Z. Wei, N. Yan and Q. W. Chen, Environ. Sci. Technol., 2011, 45(2), 534–539 CrossRef CAS PubMed.
- G. D. Ruan, Z. Z. Sun, Z. W. Peng and J. M. Tour, ACS Nano, 2011, 5(9), 7601–7607 CrossRef CAS PubMed.
- T. Tang, X. C. Chen, X. Y. Meng, H. Chen and Y. P. Ding, Angew. Chem., Int. Ed., 2005, 44, 1517–1520 CrossRef CAS PubMed.
- Z. W. Jiang, R. J. Song, W. G. Bi, J. Lu and T. Tang, Carbon, 2007, 45, 449–458 CrossRef CAS PubMed.
- R. J. Song, Z. W. Jiang, W. G. Bi, W. X. Cheng, J. Lu, B. T. Huang and T. Tang, Chem.–Eur. J., 2007, 13, 3234–3240 CrossRef CAS PubMed.
- J. Gong, J. Liu, L. Ma, X. Wen, X. C. Chen, D. Wan, H. O. Yu, Z. W. Jiang, E. Borowiak-Palen and T. Tang, Appl. Catal., B, 2012, 117–118, 185–193 CrossRef CAS PubMed.
- J. Gong, J. Liu, D. Wan, X. C. Chen, X. Wen, E. Mijowska, Z. W. Jiang, Y. H. Wang and T. Tang, Appl. Catal., A, 2012, 449, 112–120 CrossRef CAS PubMed.
- J. Gong, J. Liu, Z. W. Jiang, J. D. Feng, X. C. Chen, L. Wang, E. Mijowska, X. Wen and T. Tang, Appl. Catal., B, 2014, 147, 592–601 CrossRef CAS PubMed.
- J. Gong, J. Liu, Z. W. Jiang, X. C. Chen, X. Wen, E. Mijowska and T. Tang, Appl. Catal., B, 2014, 152–153, 289–299 CrossRef CAS PubMed.
- C. F. Wu and P. T. Williams, Fuel, 2010, 89, 3022–3032 CrossRef CAS PubMed.
- Z. J. Fan, Y. Liu, J. Yan, G. Q. Ning, Q. Wang, T. Wei, L. J. Zhi and F. Wei, Adv. Energy Mater., 2012, 2, 419–424 CrossRef CAS.
- X. Zhao, H. Tian, M. Y. Zhu, K. Tian, J. J. Wang, F. Y. Kang and R. A. Outlaw, J. Power Sources, 2009, 194, 1208–1212 CrossRef CAS PubMed.
- S. Y. Son, Y. J. Noh, C. Bok, S. Lee, B. G. Kim, S. I. Na and H. I. Joh, Nanoscale, 2014, 6, 678–682 RSC.
- Y. Fang, Y. Y. Lv, R. C. Che, H. Y. Wu, X. H. Zhang, D. Gu, G. F. Zheng and D. Y. Zhao, J. Am. Chem. Soc., 2013, 135, 1524–1530 CrossRef CAS PubMed.
- J. T. Zhang, Z. Y. Jin, W. C. Li, W. Dong and A. H. Lu, J. Mater. Chem. A, 2013, 1, 13139–13145 CAS.
- G. P. Hao, Z. Y. Jin, Q. Sun, X. Q. Zhang, J. T. Zhang and A. H. Lu, Energy Environ. Sci., 2013, 6, 3740–3747 CAS.
- Z. Y. Jin, A. H. Lu, Y. Y. Xu, J. T. Zhang and W. C. Li, Adv. Mater., 2014, 26(22), 3700–3705 CrossRef CAS PubMed.
- D. J. Cott, M. Verheijen, O. Richard, I. Radu, S. D. Gendt, S. van Elshocht and P. M. Vereecken, Carbon, 2013, 58, 59–65 CrossRef CAS PubMed.
- W. T. Wang, S. Chakrabarti, Z. G. Chen, Z. F. Yan, M. O. Tade, J. Zoudf and Q. Li, J. Mater. Chem. A, 2014, 2, 2390–2396 CAS.
- J. Gong, J. Liu, X. Wen, Z. W. Jiang, X. C. Chen, E. Mijowska and T. Tang, Ind. Eng. Chem. Res., 2014, 53, 4173–4181 CrossRef CAS.
- Y. Zhu, S. Murali, M. D. Stoller, K. J. Ganesh, W. Cai, P. J. Ferreira, A. Pirkle, R. M. Wallace, K. A. Cychosz, M. Thommes, D. Su, E. A. Stach and R. S. Ruoff, Science, 2011, 332, 1537–1541 CrossRef CAS PubMed.
- J. C. Wang and S. Kaskel, J. Mater. Chem., 2012, 22, 23710–23725 RSC.
- Y. Dong, H. M. Lin, Q. M. Jin, L. Li, D. Wang, D. Zhou and F. Y. Qu, J. Mater. Chem. A, 2013, 1, 7391–7398 CAS.
- M. H. Rümmeli, A. Bachmatiuk, A. Scott, F. Börrnert, J. H. Warner, V. Hoffman, J. H. Lin, G. Cuniberti and B. Büchner, ACS Nano, 2010, 4(7), 4206–4210 CrossRef PubMed.
- J. Gong, J. Liu, X. C. Chen, Z. W. Jiang, X. Wen, E. Mijowska and T. Tang, J. Mater. Chem. A, 2014, 2, 7461–7470 CAS.
- R. Demir-Cakan, N. Baccile, M. Antonietti and M. M. Titirici, Chem. Mater., 2009, 21, 484–490 CrossRef CAS.
Footnote |
| † Electronic supplementary information (ESI) available: Schematic diagram of the carbonization of the “real-world” mixed waste plastics/OMMT to prepare CNS/MMT composite; XPS spectra of CNS and PCNS; the removal efficiency of MB by PCNS in the different environment. See DOI: 10.1039/c4ta05118a |
| This journal is © The Royal Society of Chemistry 2015 |

