Drop impact on a flexible fiber†
Emilie
Dressaire
*a,
Alban
Sauret
b,
François
Boulogne
c and
Howard A.
Stone
c
aDepartment of Mechanical and Aerospace Engineering, New York University Polytechnic School of Engineering, Brooklyn, NY 11201, USA. E-mail: dressaire@nyu.edu
bSurface du Verre et Interfaces, UMR 125, 93303 Aubervilliers, France
cDepartment of Mechanical and Aerospace Engineering, Princeton University, Princeton, NJ 08544, USA
First published on 6th October 2015
Abstract
When droplets impact fibrous media, the liquid can be captured by the fibers or contact then break away. Previous studies have shown that the efficiency of drop capture by a rigid fiber depends on the impact velocity and a threshold velocity was defined below which the drop is captured. However, it is necessary to consider the coupling of elastic and capillary effects to achieve an improved understanding of the capture process for soft substrates. Here, we study experimentally the dynamics of a single drop impacting on a thin flexible fiber. Our results demonstrate that the threshold capture velocity depends on the flexibility of fibers in a non-monotonic way. We conclude that tuning the mechanical properties of fibers can optimize the efficiency of droplet capture.
1 Introduction
Drop impacts on a solid substrate result in short-time dynamics that involve spreading, splashing, receding and/or bouncing.1–5 Understanding and controlling the post-impact dynamics, including the interaction with the substrate,6,7 the capture of the drop and its splashing, i.e. the detachment of small satellite droplets, is critical to the efficiency of various engineering processes. For industrial spray coating, ink-jet printing and pesticide delivery, drop capture is necessary and splashing is to be avoided,8 whereas for fuel combustion, the ejection of small droplets is essential.9Previous studies of drop impact have highlighted the importance of the substrate on the dynamics of the impact and capture of the drops.10–12 The surface characteristics of the substrate including its roughness and chemistry are known to modify the splashing behavior.13,14 Also, the spreading of the liquid can be enhanced through forced imbibition of the surface roughness.15–17
The mechanical properties of the substrate and its ability to move following the impact18,19 influence the post-impact dynamics: for instance soft substrates such as clamped elastic sheets can be used to suppress splashing.20 In addition, the impact of a drop on a beam clamped at one end has been investigated21,22 as the role of substrate compliance is relevant to agricultural and industrial applications such as the treatment of leaves with pesticides or herbicides,23,24 or the spray cooling and coating of flexible structures.
Finally, the geometrical features of the substrate can strongly influence the behavior of the drop during and after impact. Indeed, for fiber-like substrates whose typical size are smaller than the diameter of the impacting drop, then drops can either be captured or pass through the substrate. Hung and Yao25 studied the impact dynamics on horizontal rigid fibers and later Lorenceau et al.26 showed that the ability of a fiber to capture a drop depends on the drop radius and the impact velocity: above critical values of these two parameters, the drop is released upon impact. The threshold velocity above which the drop is no longer captured has also been shown to depend on the inclination of the fiber27 and the position of the impact with respect to the fiber.28 When a drop is captured, its spreading or absence thereof leads to different equilibrium morphologies that have been characterized extensively by studies on individual or pairs of fibers.29–37 In this wetting scenario, the elastic deformation of the fibers leads to spreading dynamics that differ from the rigid case.38,39
The role of flexibility in drop capture by fiber-like structures is critical because of their ubiquitous presence in natural and industrial systems such as the stems of plants, needles and narrow leaves, fiber filters and glass wool. To the best of our knowledge, no study has thus far characterized the dynamics of drop impact and capture on a flexible thin fiber. We report a comprehensive experimental study on the effects of flexibility on the capture threshold using a fiber clamped at one end. We find that the threshold velocity for capture is strongly affected by the compliance of the fiber: as the length of the fiber increases, the threshold velocity for capture increases and then reaches a maximum, suggesting an optimum flexibility for drop capture. We present a model for the threshold velocity as a function of the flexibility of the fiber, which allows us to rationalize our experimental results by comparing the typical time scales for the drop to pass through the fiber and for the fiber to bend.
2 Experimental setup and observations
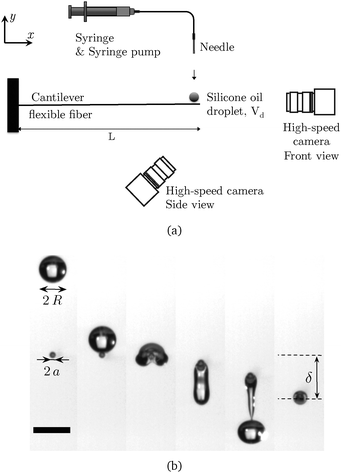
To study the impact of a liquid drop on a flexible fiber of length L, we clamp horizontally a borosilicate glass capillary (VitroCom) at one extremity only, so that it is free to bend along its length (see Fig. 1(a)). The fiber has an outer diameter of 400 μm, a length L ∈ [4; 300] mm, a linear density λm = 1.2 mg cm−1 and we measure its bending stiffness B = EI = 4.34 × 10⁻⁵ N m2. To prevent the liquid from filling the capillary, the tip is plugged with epoxy resin over a length of less than 1 mm. The small size of this plug ensures that the mechanical properties of the fiber are not significantly modified.For the experiments presented in this paper, we use different silicone oils whose respective kinematic viscosity, density and surface tension are (i) ν = 10−6 m2 s−1, ρ = 820 kg m−3, γ = 17.5 mN m−1, (ii) ν = 5 × 10⁻⁶ m2 s−1, ρ = 920 kg m−3, γ = 19.7 mN m−1 and (iii) ν = 3.5 × 10⁻⁶ m2 s−1, ρ = 910 kg m−3, γ = 19 mN m−1. Droplets of silicone oil are released from different heights to tune the velocity of impact on the fiber, Vd = 100–800 mm s−1. Drops of different radii, from R = 0.41 ± 0.02 mm to R = 1.05 ± 0.02 mm, are generated using blunt needles (20G, 27G and 30G) and glass capillaries tapered with a pipette puller. These needles are connected to a syringe pump to slowly form a pendant drop, which subsequently falls under its own weight. The position of impact on the fiber is controlled by clamping the fiber on a translation stage with a micrometer screw (PT1, Thorlabs), and monitored with a high-speed camera (Photron SA3) that records the front view of the impact to determine if the drop is centered (Fig. 1). If the impact of the drop is off-center, the threshold velocity decreases and therefore controlling the position of the impact is crucial in these experiments.28 This method also ensures that the motion of the fiber is in the vertical plane (x, y). In addition, a second high-speed camera perpendicular to the axis of the fiber records the impact of the drops and the deflection of the fiber. We then use a custom-written image-analysis code to determine the impact velocity Vd and the deflection of the fiber over time. To study the influence of the fiber length, we perform experiments with drops of silicone oil (ν = 10−6 m2 s−1 and ν = 5 × 10⁻⁶ m2 s−1) of radius R = 0.76 mm. We also vary systematically the radius of drops of silicone oil (ν = 3.5 × 10⁻⁶ m2 s−1) for a given fiber length, L = 140 mm (see Appendix).
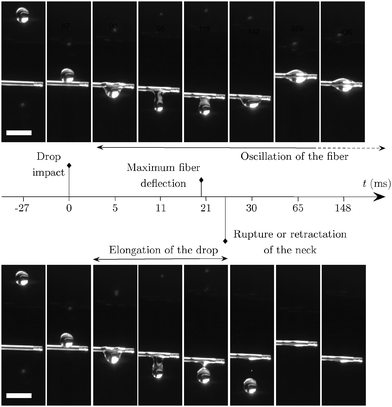
The impact of a drop on a flexible fiber triggers a series of events that depends on the impact velocity Vd. The two regimes observed experimentally are reported in Fig. 2 where they correspond to two slightly different values of the impact velocity: Vd = 370 mm s−1 and Vd = 390 mm s−1. Upon impact, the fiber deflects downward owing to its flexibility. The fiber tip and the drop travel downward together, but at different velocities. When the distance between the fiber tip and the center of mass of the drop reaches a maximum, the bridging neck of liquid can either retract in the capture regime (Fig. 2, upper series of images) or break in the release regime (Fig. 2, lower series of images). In both regimes, the fiber continues oscillating before reaching an equilibrium position after a time scale much longer than the time scale of the drop–fiber interaction.
When the drop impinges on the fiber at a typical speed of 100 to 800 mm s−1, gravity and inertia cause the drop to leave the fiber, whereas viscous and capillary forces lead to the capture of the drop. Different dimensionless parameters compare these different effects. The Weber number characterizes the relative influence of inertial and interfacial effects, We = 2ρVd2R/γ ≃ 2–40. The importance of viscous and interfacial effects is described by the capillary number Ca = ηVd/γ ∼ 0.01–0.2. For the low viscosity liquids used in this study, the capillary force is mainly responsible for the capture of the drop on the fiber. Finally, the Reynolds number based on the drop diameter, Re = We/Ca = 2VdR/ν ∼ 200–1600, which shows that inertial effects are much larger than viscous effects. Therefore, the capture dynamics will usually result from a balance between inertia and capillarity.
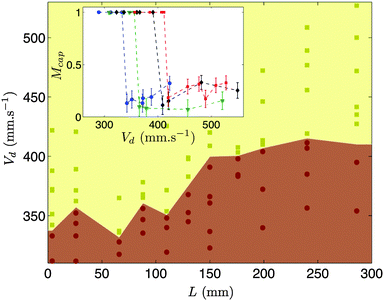
To study the drop capture and drop release regimes, we systematically vary the velocity of the drop and the fiber length thus modifying the fiber flexibility. We measure the mass of liquid captured by the fiber (based on an average of results for 10 to 20 drops) and rescale the captured mass with the mass of the impacting drop: Mcap = mcap/md (inset of Fig. 3). For a given length, we observe that as the impact velocity of the drop increases, the transition from Mcap = 1 (drop capture) to Mcap ∼ 0.1–0.3 (drop release) defines the threshold velocity Vd*. In addition, the proportion of liquid remaining on the fiber when the drop is not entirely captured is of the order of 10–30%. As illustrated in Fig. 3, increasing the length of the fiber, hence its flexibility, affects the threshold velocity though the response appears non-monotonic. To understand these trends, we first model the response of the elastic fiber to the impact before considering the drop/fiber interaction.
3 Fiber dynamics
Upon drop impact, the fiber starts oscillating and its tip describes a damped harmonic oscillation as illustrated in Fig. 4(a). Since some liquid (between 10% and 100%) remains on the fiber, the tip oscillates around an equilibrium position that corresponds to a static downward deflection c. The magnitude of the deflection c is larger when the drop is captured (see Fig. 4(a)) since the quantity of liquid that remains attached is greater.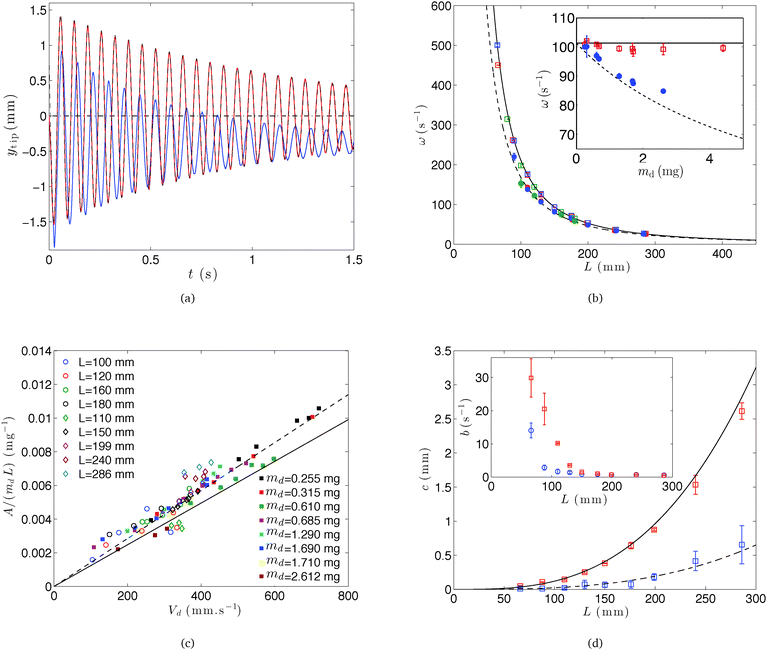 | ||
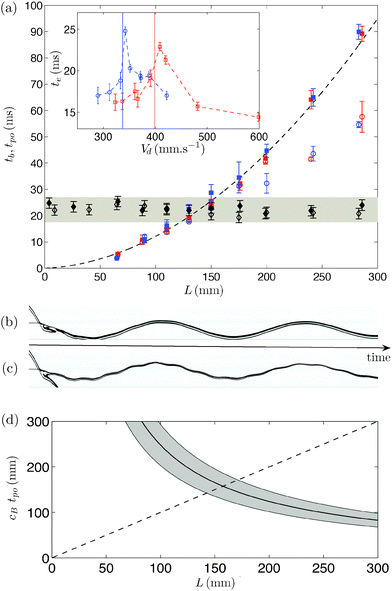
| Fig. 4 (a) Displacement of the tip of a 150 mm-long fiber versus time when the drop is captured (in blue) or released (in red). The black dashed curve is the fit obtained using eqn (2) and the horizontal dashed-dotted line indicates the initial position of the fiber. (b) Vibration frequency determined over all the oscillations versus the length of the fiber when a drop is captured (filled symbol) or released (hollow symbol) for 5 × 10⁻⁶ m2 s−1 (red), 10−6 m2 s−1 (blue) and 3.5 × 10⁻⁶ m2 s−1 (green) silicone oil. Inset: Evolution of the vibration frequency for increasing drop masses (red: drop released; blue: drop captured), ν = 3.5 × 10⁻⁶ m2 s−1 and L = 140 mm. On both figures, the theoretical first-mode frequency is also shown (continuous line: drop released; dashed line: drop captured). (c) Evolution of the rescaled amplitude A/(mdL) of the fiber deflection at impact as a function of the impact velocity Vd when the drop is captured. 3.5 × 10⁻⁶ m2 s−1 silicone oil (varying radius of the droplet and L = 100, 120, 160, 180 mm) and 5 × 10⁻⁶ m2 s−1 silicone oil (L = 110, 150, 199, 240, 286 mm, constant radius R = 0.76 mm of the droplet) are used. The continuous line is the relation (6) and the dotted line is the best fit. (d) Evolution of the static deflection of the fiber tip c after the oscillations versus the length of the fiber L; the black and dashed lines are the theoretical expression (7) with mcap = md and mcap = 0.2md, respectively. Inset: Damping coefficient b as a function of the length of the fiber. The red squares indicate drop capture and the blue circle the drop release. Experiments are performed with R = 0.76 mm and ν = 5 × 10⁻⁶ m2 s−1. | ||
3.1 Vibration frequency
To describe the free oscillations of the flexible fiber following the impact of the drop at the tip of the fiber, we use the Euler–Bernoulli beam equation:40 | (1) |
| ytip(t) = Ae−btsin(ωt + ϕ) + c, | (2) |
 | (3) |
 | (4) |
3.2 Fiber deflection
To determine the amplitude A of the oscillations of the fiber tip, we consider the momentum transfer from the impacting drop to the fiber. Before the impact, a drop of mass md travels with a velocity Vd and the fiber of mass λmL is at rest. After impact, the fiber tip and the drop travel a distance A in a time equal to one quarter of a period, π/(2ω). Therefore, the momentum balance between the drop and the beam is | (5) |
 | (6) |
Finally, when a mass of liquid mcap lies at the fiber tip, the fiber deflects downward under the liquid weight applied at its tip. The amplitude of the deflection c can be obtained from a static torque balance on the cantilever beam:44
 | (7) |
Finally we estimate the damping coefficient b of the oscillations for both regimes, drop capture and release, in the inset of Fig. 4(d). The damping coefficient decreases with increasing fiber length. However, because the time scale of the drop/fiber interaction, typically a few tens of milliseconds, is negligible compared to 1/b, which is typically of the order of one second, this parameter is not relevant to evaluate the influence of the fiber deflection on drop capture and will be neglected in the rest of this study.
In summary, using the equations derived above, we are able to describe the motion of the fiber tip after the impact of the drop and can characterize its influence on the capture threshold. We next consider the interplay between the impact of the drop, its elongation and the motion of the fiber tip.
4 Drop capture or release
4.1 Bending time versus elongation time
After the impact, two phenomena occur simultaneously while the drop and the fiber travel together, as illustrated in the time line in Fig. 2: the drop crosses the fiber while the fiber bends as described above. If the characteristic time scale, tb, for the fiber tip to reach its lowest position is much larger than the characteristic time scale for the drop to cross the fiber, only limited displacement of the fiber tip occurs during the interaction. More significantly, when the crossing time and the bending time are comparable, the displacement of the fiber tip is not negligible and affects the drop dynamics.We define the elongation time of the drop te as the time between the instant when the drop first touches the fiber and the instant at which the narrow liquid bridge that connects the drop to the fiber stops stretching. At this point, the liquid neck can either break (in the release regime) or widen as the drop recoils toward the fiber (capture regime). We report the values of te measured for two viscosities, ν = 10−6 m2 s−1 and ν = 5 × 10⁻⁶ m2 s−1, and different fiber lengths (see Fig. 5(a)). For a given length, we observe that the elongation time first increases until the threshold between the capture and release regimes. In the drop release regime, the elongation time decreases as the velocity at the impact increases. In what follow, we refer to the maximum value of te, corresponding to the transition, as the pinch-off time, noted tpo as can be observed in the inset of Fig. 5(a). We find that the pinch-off time lies in the range tpo = 22 ± 4 ms for the drop size used in this set of experiments, R = 0.76 mm. Note that the pinch-off time depends slightly on the drop size as illustrated in Appendix A. However, for our systematic experiments varying the fiber length and using two different viscosities, the drop size remains constant and the pinch-off time is about 22 ms.
Then, to compare quantitatively the time scale associated with the motion of the fiber tip and with the elongation of the drop, we measure the bending time of the fiber tb for varying lengths when the drop is captured or released and report results for two different viscosities, ν = 10−6 m2 s−1 and ν = 5 × 10⁻⁶ m2 s−1 (Fig. 5(a)). The bending time corresponds approximately to the time required for the fiber to move from its initial position to its maximum deflection. Considering the experimental fit defined by the eqn (2), ytip(t) = Ae−btsin(ωt + ϕ) + c, the bending time is tb = π/(2ω).
Experimentally, we observe that tb is indeed proportional to π/(2ω) with a fitting prefactor α ≃ 1.3 (Fig. 5(a)). This small difference could be due to two effects. First, the fiber needs to travel over a distance δ = A + c and the assumption tb = π/(2ω) is based only on the travel over a distance A. Second, the drop undergoes large deformations during the impact which affects the impact dynamics. We also observe that for long fibers (typically L > 150 mm), the measured bending time becomes different in the two regimes (drop capture represented with solid symbols and drop release represented with hollow symbols in Fig. 5(a)). The spatio-temporal diagrams for drop capture (Fig. 5(b)) and drop release (Fig. 5(c)) show that the fiber oscillation exhibits two frequencies when the drop is released: the first and secondary modes of the fiber. Therefore the measured maximum of deflection δ = A + c can be modified.
To understand the presence of the secondary oscillation, we need to consider that the impact of the drop generates a bending wave that travels along the axis of the fiber at a speed45
 | (8) |
4.2 Effective amplitude of deflection
As emphasized previously, the drop travels with the fiber during a time tpo at which time the drop gets released or recoils. Therefore, the fiber tip travels over an apparent deflection Aeff during the drop/fiber interaction time tpo.To evaluate the apparent deflection Aeff, we identify three cases:
(i) when tpo > tb, the fiber has enough time to reach its maximum deflection and then starts to oscillate. At the time of the pinch-off, the position of the fiber is
Aeff = A![[thin space (1/6-em)]](https://www.rsc.org/images/entities/char_2009.gif) sin(ωtb) + c, for tpo > tb. sin(ωtb) + c, for tpo > tb. | (9) |
(iii) Finally, for longer fibers, the fiber tip travels over a distance
 | (10) |
For the pinch-off time measured experimentally, we report in Fig. 6 the expression (10) for L > 135 mm and the expression (9) when L < 135 mm for both drop capture and release. For small fibers, the dynamics are quite complex since the fiber can oscillate several times before the pinch-off occurs. The maximum value of Aeff is reached around L ≃ 135 mm and corresponds to the maximum deflection A + c reached by the fiber during the drop/fiber interaction time tpo. Then, as the length of the fiber is further increased the effective amplitude of displacement slightly decreases because the time scale associated with bending of the fiber increases.
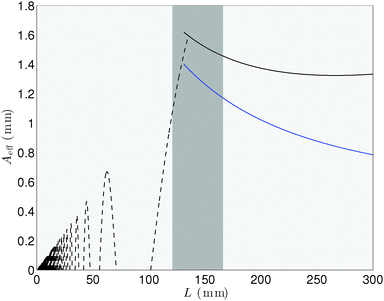 | ||
| Fig. 6 Qualitative evolution of the effective deflection amplitude Aeff of the fiber tip as a function of the length of the fiber plotted for a drop of radius R = 0.76 mm and a velocity Vd = 450 mm s−1. The dotted line represents the position of the fiber at tb when tb < tpo, i.e., case (i), and is given by eqn (9). For L > 135 mm, the cases (ii) tb ≃ tpo and (iii) tb > tpo are plotted using eqn (10) in solid lines. The black and blue solid lines indicate the drop capture and release regimes, respectively. | ||
4.3 Threshold velocity
We can now compare the results of this discussion with the experimental measurement of the threshold velocity for two different viscosities (Fig. 7). Qualitatively, we observe that the threshold velocity for capture has the same behavior for the two fluids. The threshold velocity Vd* reaches a maximum for L ≃ 140 mm and then remains roughly constant. The optimal fiber length in our experiments is therefore consistent with the analytical explanation.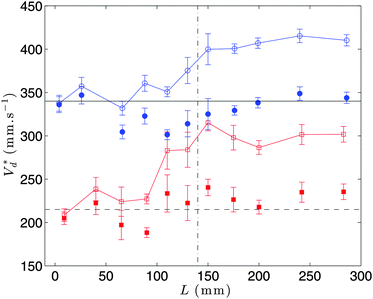 | ||
| Fig. 7 Evolution of the threshold velocity Vd* for capture as a function of the fiber length L for R = 0.76 mm and ν = 10−6 m2 s−1 (red hollow squares) and ν = 5 × 10⁻⁶ m2 s−1 (blue hollow circles). The threshold velocities are rescaled by the relative speed of the fiber given by eqn (11) (filled symbol). The horizontal lines indicate the threshold velocities for rigid fibers and the vertical dashed-dotted line corresponds to L = 140 mm. | ||
When tpo < tb, i.e. for L > 140 mm, it is useful to consider the moving frame of the fiber tip. This frame is accelerating after the drop impact with an acceleration −Aω2![[thin space (1/6-em)]](https://www.rsc.org/images/entities/char_2009.gif) sin(ωt) leading to a fictitious force. In our experiments, the fictitious force is smaller than inertial effects and negligible for the longer fibers considered here. Assuming that the drop dynamics in the reference frame of the fiber is the same whether the frame is fixed (rigid fiber) or moving (flexible fiber), we can rewrite the threshold velocity as:
sin(ωt) leading to a fictitious force. In our experiments, the fictitious force is smaller than inertial effects and negligible for the longer fibers considered here. Assuming that the drop dynamics in the reference frame of the fiber is the same whether the frame is fixed (rigid fiber) or moving (flexible fiber), we can rewrite the threshold velocity as:
 | (11) |
5 Conclusion
In this study, we have considered the impact of a drop on a flexible fiber clamped at one end. The dynamics of the fiber have been characterized: its vibration frequency, its static displacement and the amplitude of oscillation are predicted by using the beam equation. The drop behavior depends on the impact velocity and two regimes are identified, a capture regime at low impact velocity Vd and a release regime above a threshold velocity for capture Vd*. The interplay between the drop and the fiber involves two time scales: the time for the drop to pinch-off or recoil and the time for the fiber to bend. The effect of flexibility is maximum when these two time scales are of the same order. If the fiber is too rigid, the amplitude of deflection remains small and the fiber can be considered as nearly rigid. The other rigid-like case occurs when the fiber is too long and its bending time becomes really large compared to the drop elongation time. In this situation, the drop crosses the fiber while the fiber only bends slightly. Finally, we have shown that the influence of the fiber flexibility on the threshold velocity can be quantified with a relative velocity that depends on the fiber deflection, the elongation time of the drop and the threshold velocity on rigid fibers. Although we have illustrated the influence of the fiber flexibility on the threshold velocity and highlighted the importance of the elongation and bending time scales, in more complex situations, the impact can be inclined with respect to the fiber27 or can be non-centered.28 These would lead to more complex fiber and drop dynamics that remain to be investigated.Appendix A: influence of the size of the drop
We consider the evolution of the velocity threshold with the drop size. We perform systematic experiments using different needles to obtain a range of droplet radii R ∈ [0.43; 1.04] mm. To estimate the influence of the flexibility, we perform these experiments in the situation where we previously found that tpo ∼ tb for a drop of radius R ≃ 0.76 mm, which corresponds to a fiber length L ≃ 140 mm and tpo ∼ tb ∼ 22 ms. The results of our investigations are reported in Fig. 8. We observe that the threshold velocity for capture increases when the size of the drop decreases, which is consistent with the work of Lorenceau et al. on rigid fibers.26 In particular, Lorenceau et al. showed that the velocity threshold is given by: | (12) |
 | (13) |
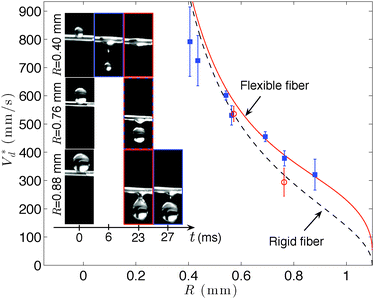 | ||
| Fig. 8 Evolution of the velocity threshold Vd* for capture as a function of the droplet radius R using ν = 3.5 × 10⁻⁶ m2 s−1 silicone oil and a fiber of length L = 140 mm (blue square). The red circles indicate the data obtained with a rigid fiber. The black dashed line is the threshold for a rigid fiber obtained using eqn (12)26 and the red continuous line is the threshold for a flexible fiber obtained using eqn (11). The inset shows the time line for three fiber radii highlighting the pinch-off time tpo and the time tb at which the maximum deflection is reached. | ||
We conclude that for large drops, fiber flexibility leads to a significant increase in the threshold velocity for capture whereas for small drops the effect of the flexibility becomes negligible (Fig. 8). This qualitative observation is in agreement with the fact that, for small droplets the amplitude of displacement of the fiber becomes smaller whereas the vibration frequency and the bending time of the fiber do not depend on the drop mass.
Acknowledgements
ED is supported by set-up funds by the NYU Polytechnic School of Engineering. FB acknowledges that the research leading to these results partially received funding from the People Programme (Marie Curie Actions) of the European Union's Seventh Framework Programme (FP7/2007–2013) under REA grant agreement 623541. We thank A. Gelperin for sharing his pipette puller for our experiments, C. Clanet, E. Lorenceau and E. Villermaux for helpful discussions.References
- C. Clanet, C. Béguin, D. Richard and D. Quéré, J. Fluid Mech., 2004, 517, 199–208 CrossRef.
- A. L. Yarin, Annu. Rev. Fluid Mech., 2006, 38, 159–192 CrossRef.
- R. D. Deegan, P. Brunet and J. Eggers, Nonlinearity, 2008, 21, C1 CrossRef.
- J. Eggers, M. A. Fontelos, C. Josserand and S. Zaleski, Phys. Fluids, 2010, 22, 062101 CrossRef.
- J. C. Bird, R. De Ruiter, L. Courbin and H. A. Stone, Nature, 2010, 465, 759–762 CrossRef CAS PubMed.
- J. C. Bird, R. Dhiman, H. M. Kwon and K. K. Varanasi, Nature, 2013, 503, 385–388 CrossRef CAS PubMed.
- H. Lhuissier, C. Sun, A. Prosperetti and D. Lohse, Phys. Rev. Lett., 2013, 110, 264503 CrossRef CAS PubMed.
- V. Bergeron, D. Bonn, J. Martin and L. Vovelle, Nature, 2000, 405, 772–775 CrossRef CAS PubMed.
- J. Eggers and E. Villermaux, Rep. Prog. Phys., 2008, 71, 036601 CrossRef.
- L. Xu, W. W. Zhang and S. R. Nagel, Phys. Rev. Lett., 2005, 94, 184505 CrossRef PubMed.
- U. Mock, T. Michel, C. Tropea, I. Roisman and J. Rühe, J. Phys.: Condens. Matter, 2005, 17, S595 CrossRef CAS.
- L. Xu, L. Barcos and S. R. Nagel, Phys. Rev. E: Stat., Nonlinear, Soft Matter Phys., 2007, 76, 066311 CrossRef PubMed.
- C. D. Stow and M. G. Hadfield, Proc. R. Soc. London, Ser. A, 1981, 373, 419–441 CrossRef.
- P. Tsai, R. C. A. van der Veen, M. van de Raa and D. Lohse, Langmuir, 2010, 26, 16090–16095 CrossRef CAS PubMed.
- K. Range and F. Feuillebois, J. Colloid Interface Sci., 1998, 203, 16–30 CrossRef CAS.
- E. Lorenceau and D. Quéré, J. Colloid Interface Sci., 2003, 263, 244–249 CrossRef CAS PubMed.
- A. Delbos, E. Lorenceau and O. Pitois, J. Colloid Interface Sci., 2010, 341, 171–177 CrossRef CAS PubMed.
- A. K. Dickerson, P. G. Shankles, N. M. Madhavan and D. L. Hu, Proc. Natl. Acad. Sci. U. S. A., 2012, 109, 9822–9827 CrossRef CAS PubMed.
- A. K. Dickerson, P. G. Shankles and D. L. Hu, Phys. Fluids, 2014, 26, 027104 Search PubMed.
- R. E. Pepper, L. Courbin and H. A. Stone, Phys. Fluids, 2008, 20, 082103 CrossRef.
- D. Soto, A. Borel de la Rivière, X. Boutillon, C. Clanet and D. Quéré, Soft Matter, 2014, 10, 4929–4934 RSC.
- S. Gart, J. E. Mates, C. M. Megaridis and S. Jung, Phys. Rev. Appl., 2015, 3, 044019 CrossRef.
- G. B. Williamson, A. Romero, J. K. Armstrong, T. J. Gush, A. J. Hruska, P. E. Klass and J. T. Thompson, Biotropica, 1983, 15, 232–234 CrossRef.
- J. P. Lightbody, Biotropica, 1985, 17, 339–342 CrossRef.
- L. S. Hung and S. C. Yao, Int. J. Multiphase Flow, 1999, 25, 1545–1559 CrossRef CAS.
- E. Lorenceau, C. Clanet and D. Quéré, J. Colloid Interface Sci., 2004, 279, 192–197 CrossRef CAS PubMed.
- K. Piroird, C. Clanet, E. Lorenceau and D. Quéré, J. Colloid Interface Sci., 2010, 334, 70–74 CrossRef.
- E. Lorenceau, C. Clanet, D. Quéré and M. Vignes-Adler, Eur. Phys. J.: Spec. Top., 2010, 166, 3–6 CrossRef.
- Z. Huang, X. Liao, Y. Kang, G. Yin and Y. Yao, J. Colloid Interface Sci., 2009, 330, 399–403 CrossRef CAS PubMed.
- T. Gilet, D. Terwagne and N. Vandewalle, Appl. Phys. Lett., 2009, 95, 014106 Search PubMed.
- T. Gilet, D. Terwagne and N. Vandewalle, Eur. Phys. J. E: Soft Matter Biol. Phys., 2010, 31, 253–262 CrossRef CAS PubMed.
- S. Protiere, C. Duprat and H. A. Stone, Soft Matter, 2013, 9, 271–276 RSC.
- C. Song and Y. Zheng, J. Colloid Interface Sci., 2013, 427, 2–14 CrossRef PubMed.
- A. Sauret, A. D. Bick, C. Duprat and H. A. Stone, Europhys. Lett., 2014, 105, 56006 CrossRef.
- A. Sauret, F. Boulogne, D. Cébron, E. Dressaire and H. A. Stone, Soft Matter, 2015, 11, 4034–4040 RSC.
- F. Weyer, M. Lismont, L. Dreesen and N. Vandewalle, Soft Matter, 2015, 11, 7086–7091 RSC.
- A. Sauret, F. Boulogne, B. Soh, E. Dressaire and H. A. Stone, Eur. Phys. J. E: Soft Matter Biol. Phys., 2015, 38, 1–9 CrossRef CAS PubMed.
- J. Bico, B. Roman, L. Moulin and A. Boudaoud, Nature, 2004, 432, 690 CrossRef CAS PubMed.
- C. Duprat, S. Protiere, A. Y. Beebe and H. A. Stone, Nature, 2012, 482, 510–513 CrossRef CAS PubMed.
- S. Timoshenko and S. Woinowsky-Krieger, Theory of Plates and Shells, McGraw-hill, New York, 1959 Search PubMed.
- W. Weaver Jr, S. P. Timoshenko and D. H. Young, Vibration Problems in Engineering, John Wiley & Sons, 1990 Search PubMed.
- S. S. Rao and F. F. Yap, Mechanical Vibrations, Addison-Wesley, 1995, vol. 4 Search PubMed.
- E. Macho-Stadler, M. J. Elejalde-García and R. Llanos-Vázquez, Eur. J. Phys., 2015, 36, 055007 CrossRef.
- J. Gere and S. Timoshenko, Mechanics of Materials, PWS-Kent, 1984 Search PubMed.
- A. E. H. Love, A Treatise on the Mathematical Theory of Elasticity, Dover Publications, New York, NY, 4th edn, 1944 Search PubMed.
- J. Comtet, B. Keshavarz and J. W. M. Bush, Soft Matter, 2015 10.1039/C5SM02037A.
Footnote |
| † During the course of the review process, a paper describing similar results was published by Comtet et al.46 The two studies were conducted independently and without knowledge of one another. |
| This journal is © The Royal Society of Chemistry 2016 |

