
 Open Access Article
 This Open Access Article is licensed under a
 Creative Commons Attribution 3.0 Unported Licence
Polymer fullerene solution phase behaviour and film formation pathways†
Rajeev
Dattani
and
João T.
Cabral
*
Department of Chemical Engineering, Centre for Plastic Electronics, Imperial College London, London, SW7 2AZ, UK. E-mail: j.cabral@imperial.ac.uk
First published on 24th February 2015
Abstract
We report the phase behaviour of polymer/fullerene/solvent ternary mixtures and its consequence for the morphology of the resulting composite thin films. We focus particularly on solutions of polystyrene (PS), C60 fullerene and toluene, which are examined by static and dynamic light scattering, and films obtained from various solution ages and thermal annealing conditions, using atomic force and light microscopy. Unexpectedly, the solution phase behaviour below the polymer overlap concentration, c*, is found to be described by a simple excluded volume argument (occupied by the polymer chains) and the neat C60/solvent miscibility. Scaling consistent with full exclusion is found when the miscibility of the fullerene in the solvent is much lower than that of the polymer, giving way to partial exclusion with more soluble fullerenes (phenyl-C61-butyric acid methyl ester, PCBM) and a less asymmetric solvent (chlorobenzene), employed in photovoltaic devices. Spun cast and drop cast films were prepared from PS/C60/toluene solutions across the phase diagram to yield an identical PS/C60 composition and film thickness, resulting in qualitatively different morphologies in agreement with our measured solution phase boundaries. Our findings are relevant to the solution processing of polymer/fullerene composites (including organic photovoltaic devices), which generally require effective solubilisation of fullerene derivatives and polymer pairs in this concentration range, and the design of well-defined thin film morphologies.
1 Introduction
Polymer composites comprising colloids or nanoparticles (NPs) are often solution processed into films, finding practical applications that range from common paints and coatings1 to nanostructured organic electronics.2 Polymer/fullerene/solvent mixtures are particularly significant for organic solar cells3 and have attracted much attention as controlling the thin film morphology is required to obtain high performance devices. Processing variables include film thickness, solvent or mixture of solvents, thermal and solvent annealing time/temperature, fullerene loading, polymer regioregularity and molecular weight, and are often used to empirically guide film optimisation. However, device performances of an extensively studied polymer/fullerene pair, poly(3-hexylthiophene-2,5-diyl) (P3HT) and phenyl-C61-butyric acid methyl ester (PCBM), reveal a huge disparity in the efficiency of nominally identical films.4 While there can be various causes for such irreproducibility, two aspects of polymer/fullerene processing appear to have been largely overlooked: the phase behaviour and drying pathways of the ternary precursor solutions.Careful studies of binary polymer/NP mixtures, typically with functionalised silica or gold NPs,6–10 have resulted in much controversy in terms of changes in polymer chain dimensions and (related) dispersion quality of the nanocomposites, which are generally cast from solution. Understanding solution miscibility, polymer conformation and NP association, and their evolution along film formation pathways is evidently required to fully exploit the potential of nanostructured composites in general.
Polymer and colloid solutions are often discussed11 in terms of the relative dimensions of their constituents (viz. polymer radius of gyration Rpolyg and colloid RC), defining the so-called protein (RC ≪ Rpolyg) and colloid (RC ≫ Rpolyg) limits. Small NPs (or indeed fullerenes) may be expected to form solutions in the protein limit and cause Rpolyg to change, depending on the polymer–NP interactions in solution and their relative concentrations. Conversely, the addition of a polymer can cause crystallisation of the NP, as it is found in protein solutions and from which the term ‘protein limit’ is derived.12 Solutions in the colloid limit can be expected for large colloids and also for clusters, for instance of poorly dispersed NPs. Dispersed fullerenes have RC ≈ 0.5 nm which, for most polymer masses MW (including those considered in this work), should result in solutions in the protein limit. Theoretically, multiple interactions between each polymer coil and colloidal particles must thus be considered, and polymers are generally treated as chains of connected spheres, each of the size of a colloidal particle. Both homogeneous13,14 and phase separated15–17 solutions have been predicted theoretically. Experimentally, phase separation and crystallisation have been observed in a number of systems.5,18–21 In all cases, the polymer was a linear polystyrene chain and the small colloid was either octa-n-propylsilsesquioxane (RC = 0.7 nm), crosslinked poly (ethyl methacrylate) (RC = 8–42 nm), hydroxyl functionalized silica nanoparticles (RC = 11 nm) or C60 fullerene (RC = 0.35 nm). For some systems, significant coil contraction (≈50%) was found in the presence of high enough (≳8 wt%) colloid concentration.18–21
In this work, we examine polymer/fullerene/solvent mixtures by comprehensively characterising the ternary solution phase behaviour and the resulting (binary) polymer/fullerene film morphologies. We select polystyrene (PS) as the polymer matrix, fullerene C60, and toluene as a model system; while PS is fully miscible in toluene across the entire composition range, the reported miscibility of C60 in toluene is only 0.32 wt%.22 The miscibility of C60 in PS is estimated to be 1 wt% or lower,23 although higher ‘dispersibility’ limits are found for rapidly precipitated23,24 or spin cast composite films.25,26 This PS/C60/toluene system exhibits therefore highly asymmetric solvent interactions, in which the solubility of the PS is much greater than that of C60 in toluene. For comparison, in order to decrease asymmetry in solubility, we also evaluate solutions comprising a more miscible fullerene, phenyl-C61-butyric acid methyl ester (PCBM), in toluene, and a solvent exhibiting considerably higher PCBM solubility, chlorobenzene.
Previous studies on annealed binary PS/C60 thin films have shown a rich morphological behaviour, ranging from (meta)stable to rapidly dewetting films, from homogeneous and uniform to phase separated (sparsely nucleated to spinodally correlated) morphologies, and various coupling effects between these.25–31 Under certain conditions, an enriched C60 layer was reported at the substrate interface,25,27,28 albeit not generally.30 Morphological control parameters were found to include the polymer mass MW,26 fullerene content,29 substrate surface energy,25,30,31 film thickness, temperature, and even light exposure (due to fullerene photo-chemistry in both films30 and solutions32).
We now seek to measure the solution phase behaviour and quantify its impact on the film morphology, in both the as-cast and thermally annealed films. Our hypothesis is that films of identical composition and thickness can exhibit considerable morphological differences arising from both their initial solution state and film formation pathway. We therefore evaluate RC and Rpolyg in solution by static (SLS) and dynamic light scattering (DLS) to gauge miscibility, and film morphology by optical (OM) and atomic force microscopy (AFM) to correlate, for the first time, the solution and film properties of these academically and technologically important polymer–fullerene mixtures.
2 Experimental
Fullerene C60 (99%+ purity) was purchased from MER Corp, polystyrene of molecular mass (MW) 65 kg mol−1 and a polydispersity index 1.1 from Polymer Laboratories Ltd (referred to as 65k), and toluene (99.5% purity) from VWR. The necessary masses of C60 and PS were weighed into the same vial and the required mass of toluene was added. The resulting PS/C60/toluene solutions were stored in the dark (as light exposure is known to cause fullerene aggregation32) and stirred for 48 hours. All solution concentrations can be found in Table S1.† Details of additional systems investigated, namely PS MW from 18 to 775 kg mol−1, as well as PCBM fullerene and chlorobenzene solutions are provided in the ESI.†For static light scattering (SLS) a SOFICA instrument (Societé Francaise d'Instruments de Contröle et d'Analyses, Le Mesnil Saint-Denis, S. et 0., France), modified by SLS Systemtechnik (G. Baur, Denzlingen, Germany) was employed. The SLS is equipped with a 5 mW HeNe laser source (λ = 633 nm) and a goniometer covering 27 ≤ θ ≤ 105°, and yielding a wavenumber range from 7.1 ≤ q ≤ 23.7 × 10⁻³ nm−1, calculated using  , where n is the refractive index of the solvent. Experiments were carried out on 2 mL of solution in cylindrical quartz cells with 1 cm diameter (Hellma, Müllheim, Germany) and a stopper to prevent evaporation. The light exposure during the SLS measurement was kept below 3–5 minutes to minimise photo-oxidation of fullerenes. The photomultiplier was calibrated with a toluene (puriss. p.a. ≥ 99.7%, Sigma Aldrich) standard. SLS data were treated with the standard Guinier approximation to obtain RC:
 | (1) |
Dynamic light scattering (DLS) experiments were carried out with a Malvern Nano-S (Malvern Instruments Ltd, UK) with a fixed detector at 173°, corresponding to q = 2.96 × 10⁻² nm−1. All experiments were performed in sealed, rectangular quartz cuvettes (Hellma, Müllheim, Germany). To account for the multiple decays correlation functions were fit using a sum of exponential decays:
 | (2) |
 , where kB, T and η are Boltzmann's constant, temperature (K) and the viscosity of the solvent, respectively, the hydrodynamic radius of the ith mode, Rh,i, can be found.
Thin films were fabricated from the appropriate solution via spin coating onto 1 cm2 〈100〉 silicon substrates (Compart Tech) which were surface treated with a Ultraviolet UV Ozone Cleaner (Novascan) for 15 minutes. The spin coating frequency (rpm) was varied as necessary in order to achieve the same film thickness from solutions of different PS concentrations (thickness calibration is shown in Fig. S2†). Prior to annealing, film thicknesses were measured with a UV-visible interferometer (Filmetrics, F20-UV) calibrated with a SiO2 wafer standard. All films obtained via spin casting reported here are 130 ± 3 nm thick. Drop cast samples were prepared by casting 50–100 μL of solution (the higher PS concentration solutions were cast with a lower volume to maintain an identical film thickness) onto 1 cm2 Si substrates at 60 °C and dried for 30 minutes resulting in a thickness of ≈20 μm.
Polymer/fullerene composite films were first imaged with an Olympus BX41M-LED reflectance microscope equipped with an AVT GigE GX1050C camera. Image analysis was carried out using ImageJ (v1.46r). Brightness and condenser/focussing settings were varied for maximum contrast between polymer-rich and fullerene-rich regions, intensity thresholded and a fast Fourier transform and/or particle analysis was carried out. Atomic force microscopy (AFM) (Innova, Bruker) is employed in tapping mode to quantify nanoscale structures and topography in thin polymer composite films. Image files were processed using Gwyddion (v2.31): the raw AFM data were imported, levelled by mean plane subtraction, a polynomial background was removed and lines were corrected by matching the height median; the minimum height for all images was set to zero.
3 Results and discussion
Previously, using DLS, SLS and small angle neutron scattering (SANS), we have demonstrated that PS chain dimensions remain unperturbed across the dilute to semi-dilute regimes (0 to 9.5 wt% PS) with C60 concentrations ranging from 0 to 0.96 wt% and a molecular weight ranging from 20 to 1000 kg mol−1 (ref. 5). Specifically, we have quantified the hydrodynamic radius Rpolyh obtained from DLS and the radius of gyration Rpolyg obtained by SLS and SANS in the dilute regime, as well as the correlation length ξ obtained by SANS in semi-dilute solutions. The experimental results for this system are consistent with our previous findings. Fig. 1a shows DLS correlation functions obtained at a constant polymer concentration and increasing C60 loading. The first decay in g(1)(q,t) corresponds to the polymer coil whose dimensions are shown to remain unchanged across the composition range in Fig. 1b. However, an additional decay appears with increasing C60 loadings shown in Fig. 1a which we have found to correspond to fullerene clusters.5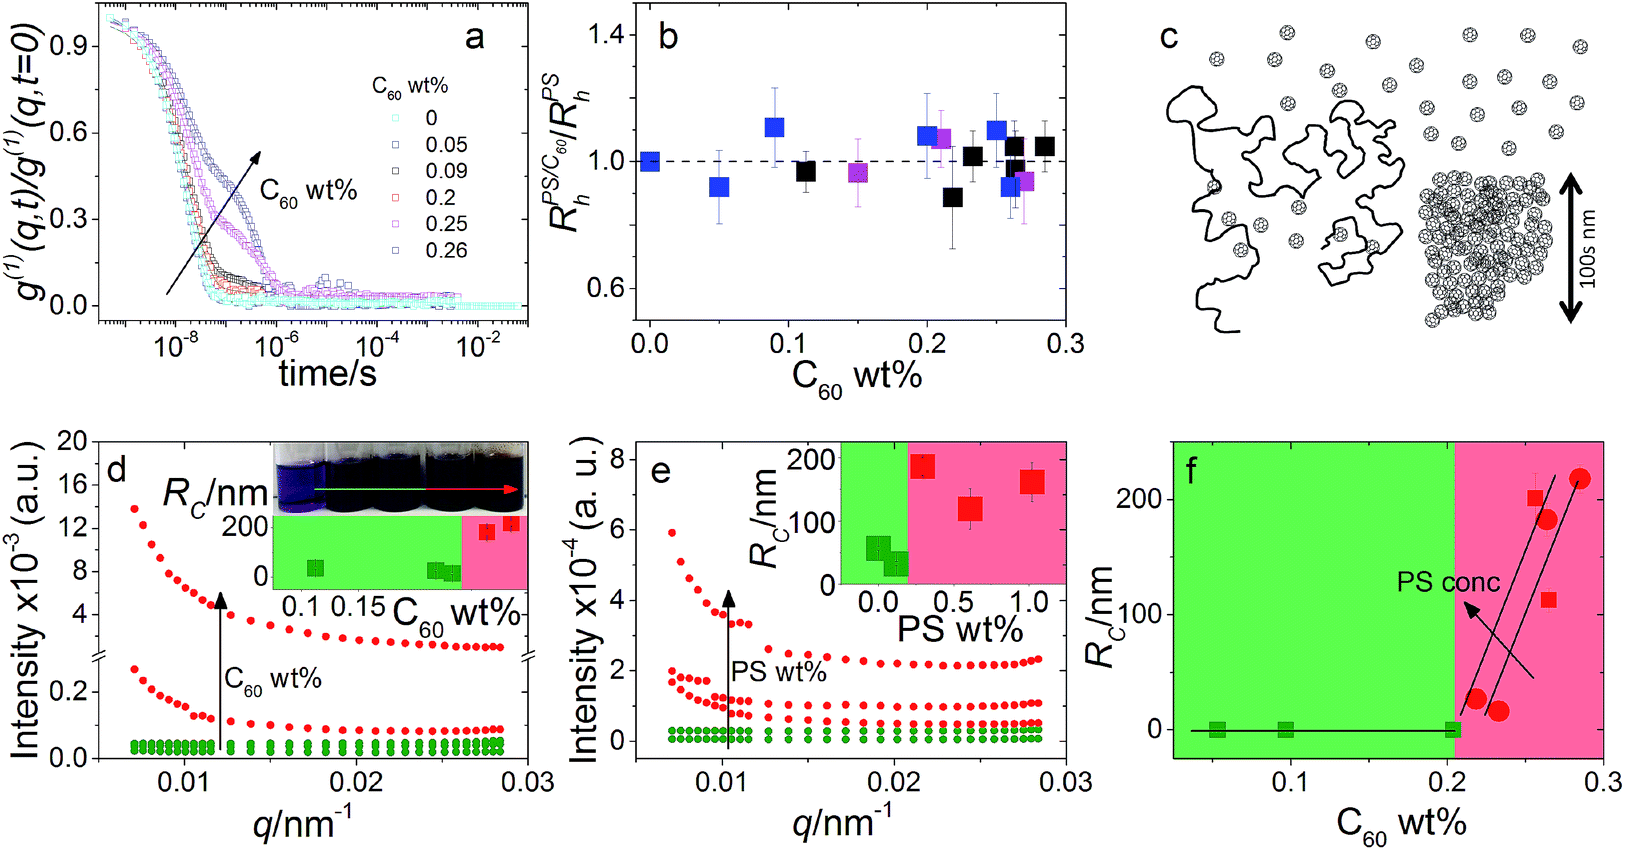 | ||
Fig. 1 (a) DLS correlation functions at 1.00 ± 0.07 wt% PS with C60 from 0 to 0.26 wt%. (b) Normalised  for 0.30 ± 0.01 ( for 0.30 ± 0.01 ( ), 0.6 ± 0.1 ( ), 0.6 ± 0.1 ( ) and 1.00 ± 0.07 wt% PS ( ) and 1.00 ± 0.07 wt% PS ( ). We observe no change in ). We observe no change in  with addition of C60, consistent with our previous findings.5 (c) Schematic depicting dispersed fullerenes and clusters on the order of 100’s nm with unperturbed PS chains. (d and e) SLS of ternary solutions, (d) increasing the C60 concentration from 0.11 to 0.28 wt% and fixed 0.30 ± 0.01 wt% PS and (e) increasing the PS concentration from 0 to 1 wt% and fixed 0.25 ± 0.01 wt% C60. (f) Fullerene RC is dependent on the C60 and PS concentration, shown with 0.30 ± 0.01 ( with addition of C60, consistent with our previous findings.5 (c) Schematic depicting dispersed fullerenes and clusters on the order of 100’s nm with unperturbed PS chains. (d and e) SLS of ternary solutions, (d) increasing the C60 concentration from 0.11 to 0.28 wt% and fixed 0.30 ± 0.01 wt% PS and (e) increasing the PS concentration from 0 to 1 wt% and fixed 0.25 ± 0.01 wt% C60. (f) Fullerene RC is dependent on the C60 and PS concentration, shown with 0.30 ± 0.01 ( ) and 1.00 ± 0.07 wt% PS ( ) and 1.00 ± 0.07 wt% PS ( and and  ). Inset in (d) is an image of solution vials with increasing C60 loading and aggregates can be seen in the highlighted area. Inset in both (d) and (e) are estimates of C60 cluster sizes by a Guinier approximation. ). Inset in (d) is an image of solution vials with increasing C60 loading and aggregates can be seen in the highlighted area. Inset in both (d) and (e) are estimates of C60 cluster sizes by a Guinier approximation. | ||
SLS was used to probe C60 cluster formation by polymer addition in solution and thus gauge solution miscibility. We first measured the exact fullerene solubility limit for our C60 grade in toluene by stirring solutions of various concentrations for 48 h, in the absence of light, at room temperature. We find a miscibility limit of 0.27 wt% C60 in toluene, below the 0.32 wt% reported previously.22 This difference may be not only due to the purity of the fullerene of solvents employed, but also possibly by the measurement method and aggregation kinetics. We note that in ref. 22 the solubility was measured by dilution and filtration of a saturated C60 solution, while we have prepared fresh solutions at each composition which we have found to be more reproducible.
Typical SLS datasets are shown in Fig. 1d and e from which the fullerene cluster size dependence on the C60 (Fig. 1d) and PS (Fig. 1e) concentration is estimated. We find that increasing either eventually leads to C60 clustering beyond a composition-specific threshold; for instance, increasing PS loading causes C60 cluster formation at lower C60 concentrations, as shown in Fig. 1f. At sufficiently long times and/or concentrations, macroscopic C60 become visible to the naked eye. A schematic illustrating these findings is shown in Fig. 1c.
We next map the phase diagram by measuring a wide range of (C60, PS) concentrations in the dilute and semi-dilute regime of 65k PS, shown in Fig. 2. The green and red points and shaded areas define the miscible and two-phase regimes. We find that the addition of PS decreases C60 miscibility in a linear fashion, until a PS concentration (<c*) beyond which it becomes largely insensitive to further polymer addition. The initial linear decrease with polymer concentration suggests an expulsion of the fullerenes from the volume occupied by the PS chains, effectively increasing the fullerene concentration in a reduced available volume.
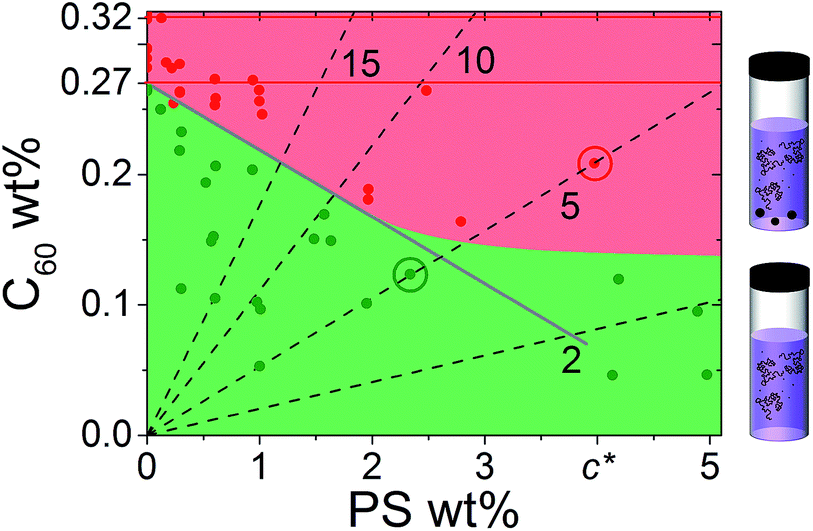 | ||
Fig. 2 Phase diagram of PS/C60/toluene solutions showing C60 aggregation at 0–5 wt% PS. Homogeneous ( ) and precipitated ( ) and precipitated ( ) solutions are shown. The calculated solubility limit (—) (described in the text) agrees well with the observed homogeneous and precipitated phases, shown in green and red, respectively. Red lines indicate neat C60/toluene miscibility, previously reported (0.32 wt%)22 and found in this study (0.27 wt%). Dashed lines indicate the constant PS/C60 ratio in the film, with the C60 mass% noted. The circled data points, along the PS–5wt% C60 line, indicate solutions employed in the thin and bulk films investigated below. ) solutions are shown. The calculated solubility limit (—) (described in the text) agrees well with the observed homogeneous and precipitated phases, shown in green and red, respectively. Red lines indicate neat C60/toluene miscibility, previously reported (0.32 wt%)22 and found in this study (0.27 wt%). Dashed lines indicate the constant PS/C60 ratio in the film, with the C60 mass% noted. The circled data points, along the PS–5wt% C60 line, indicate solutions employed in the thin and bulk films investigated below. | ||
Given the (finite) miscibility of fullerenes in polystyrene, one could expect that the addition of a sufficiently small polymer fraction would not appreciably alter C60 miscibility in the ternary solution. This is not observed experimentally and, instead, the C60 miscibility drops from the outset of PS addition. In order to rationalise these findings we consider the simplest possible scenario: the C60 miscible fraction in solution is set by the volume remaining, Vfree, after subtracting the volume occupied by the polymer chains, Vocc, from the total solution volume, Vtotal, yielding
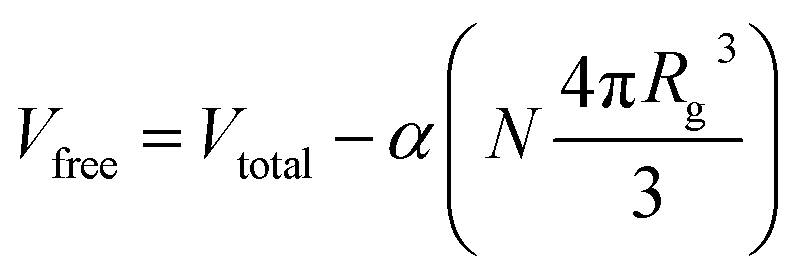 | (3) |
 the concentration of molecularly dispersed C60 appears to level off to the value between 0.12 and 0.15 wt%. This result agrees with previous estimates of the finite miscibility of C60 in polystyrene23,24 which we have estimated to be <1 wt% C60.23 As expected, at sufficiently high polymer concentration, when chain overlap begins, fullerene miscibility no longer correlates with the simple volume estimate extrapolated from dilute chain dimensions. The asymptotic fullerene miscibility value should now be governed by the binary thermodynamic interaction with the host polymer matrix.
Given the strong power-law dependence of the volume occupied by single chains (and c*) on polymer mass MW, we have carried out selected experiments by varying PS MW (presented in Fig. S1†). As expected from eqn (3), increasing MW decreases c* and the miscibility of C60 decreases at a faster rate by addition of PS, as chains overlap ‘earlier’ (i.e. at a lower concentration). The slope α remained consistent with the value found above. We are thus surprised that this simple scaling model yields remarkable agreement with our data.
We can thus summarise our findings for PS/C60/toluene ternary solutions as follows: (i) increasing PS wt% increases the C60 aggregate size (at constant solution age); (ii) the onset of C60 aggregation depends on the PS concentration with higher PS loadings inducing C60 aggregation at lower C60 concentrations; (iii) at a fixed mass, increasing the MW of PS chains decreases the miscibility limit of C60; (iv) a simple volume argument below c* describes the trend observed for the miscibility of C60 by polymer addition of various MW.
We next consider the effect of ternary solution behaviour on the resulting PS/C60 film morphology, both for thin and bulk films, both as-cast and thermally annealed. Increasing the polymer content generally increases the film thickness obtained by spin coating, carefully coupling the rpm and PS concentration allows films of identical thickness to be prepared from solutions with a range of solid contents. Our calibration curve for PS/C60/toluene is shown in Fig. S2.† Maintaining the PS to C60 ratio constant, indicated by the dashed lines in Fig. 2, nominally identical films can be prepared. Illustrative 5% C60/PS films, on both sides of the miscibility boundary, are indicated by red and green circles in Fig. 2. We investigate the effects of solution age, thermal annealing and drying time.
3.1 Solution age
Over time, C60 within solutions in the precipitated regime (red) is found to aggregate. Fig. 3 compares the morphology of films which are nominally identical: 5% C60/PS and 130 nm thick. Films cast from the immiscible (red) region yield C60 clusters whose number (density) increases with solution age (up to 5 days shown here). By contrast, films cast from the miscible (green) region yield uniform films regardless of solution age. This behaviour was confirmed along other fixed relative C60/PS composition lines (e.g. Fig. S3†).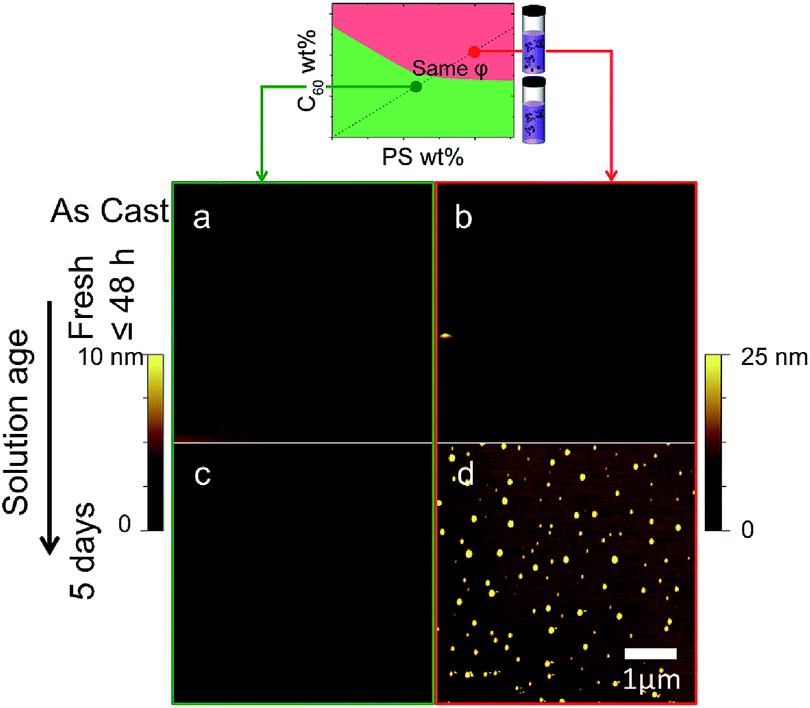 | ||
| Fig. 3 Effect of solution age on spun cast thin films, across the miscibility boundary. AFM topography images of 5% C60/PS 130 nm as-cast thin films prepared from (a and b) a freshly made solution and (c and d) a solution aged for 5 days. | ||
3.2 Thermal annealing
Annealing of thin films prepared from the two solution states, across the phase boundaries, yielded strikingly different morphologies shown in Fig. 4. Since the miscibility of C60 in PS is relatively low (<1% mass23), one expects films cast for solutions with a higher C60 content to yield phase segregated morphologies29 upon thermal annealing above the glass transition temperature Tg of the mixtures (between 104 and 108 °C23). As seen previously (Fig 3a and b), as-cast films prepared from homogenous solutions (green) are uniform, whereas those from precipitated solutions (red) exhibit micron-sized aggregates. Upon annealing, a characteristic ‘spinodal clustering’26,29 morphology can be observed in the film prepared from the homogeneous solution (Fig. 4c), whereas the annealed morphology of films prepared from the precipitated solution is markedly different, exhibiting more and, on average, smaller C60 clusters. The seed clusters from solution appear thus to alter the fullerene cluster formation in films, which seems dominated by fast nucleation (in addition to growth of seed clusters). Representative Fast Fourier Transforms (FFTs) show that the dominant length scale of films cast from homogeneous solutions (seen by a shoulder in the structure factor, green) is lost due to the polydispersed morphology of films cast from metastable solutions (in red).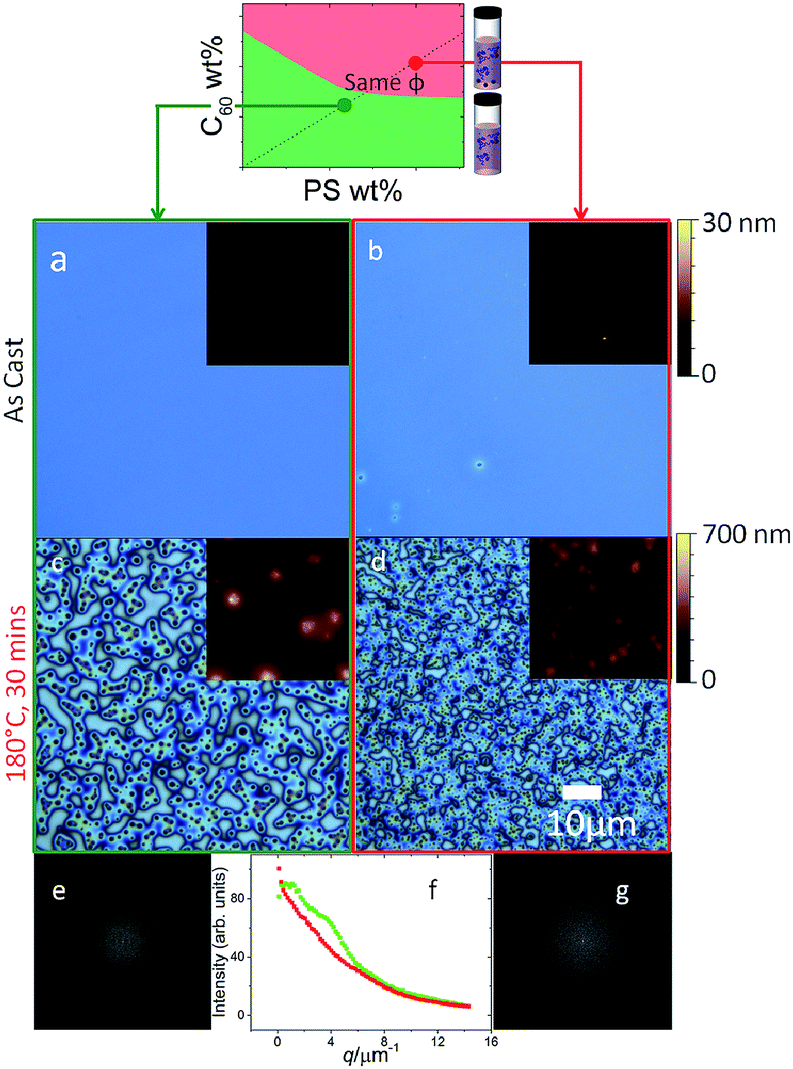 | ||
| Fig. 4 Effect of thermal annealing (180 °C, 30 min) on the morphology of spun cast 5% C60/PS 130 nm thin films prepared from solutions in the (a and c) homogeneous and (b and d) precipitated regimes. FFTs of (c) and (d) are shown in (e) and (g), respectively, whose radial profiles are compared in (f). Insets in (a–d) show AFM scans of the corresponding films, with an image width of 10 μm; the height scale bars are 30 nm in (a and b) and 700 nm in (c and d). | ||
3.3 Drying timescales and film thickness
We next consider the effect of the film casting method on the resulting film morphology. Given that the drying timescale of spin coating is relatively short (a few seconds), the ‘as-cast’ films obtained are found to quench morphologies closely matching the expectations from the solution state. As such, films spun cast from the miscible region of the solution phase diagram appear homogenous, even though their composition exceeds the miscibility limit of C60 in PS melts, since below Tg. By contrast, films drop cast from solution may take up to 30 min to dry (above room temperature) and will thus explore the same drying pathway, across the miscibility limit, at a much slower rate. Drop casting from heterogeneous (red) solutions, should thus differ from spin casting, by allowing a slow crossing of the phase boundaries in addition to the growth of seed C60 clusters. The common drying pathway is shown in Fig. 5 and maintains a constant PS to C60 ratio throughout, and thus yields identical film compositions (and thickness through judicious choice of casting parameters).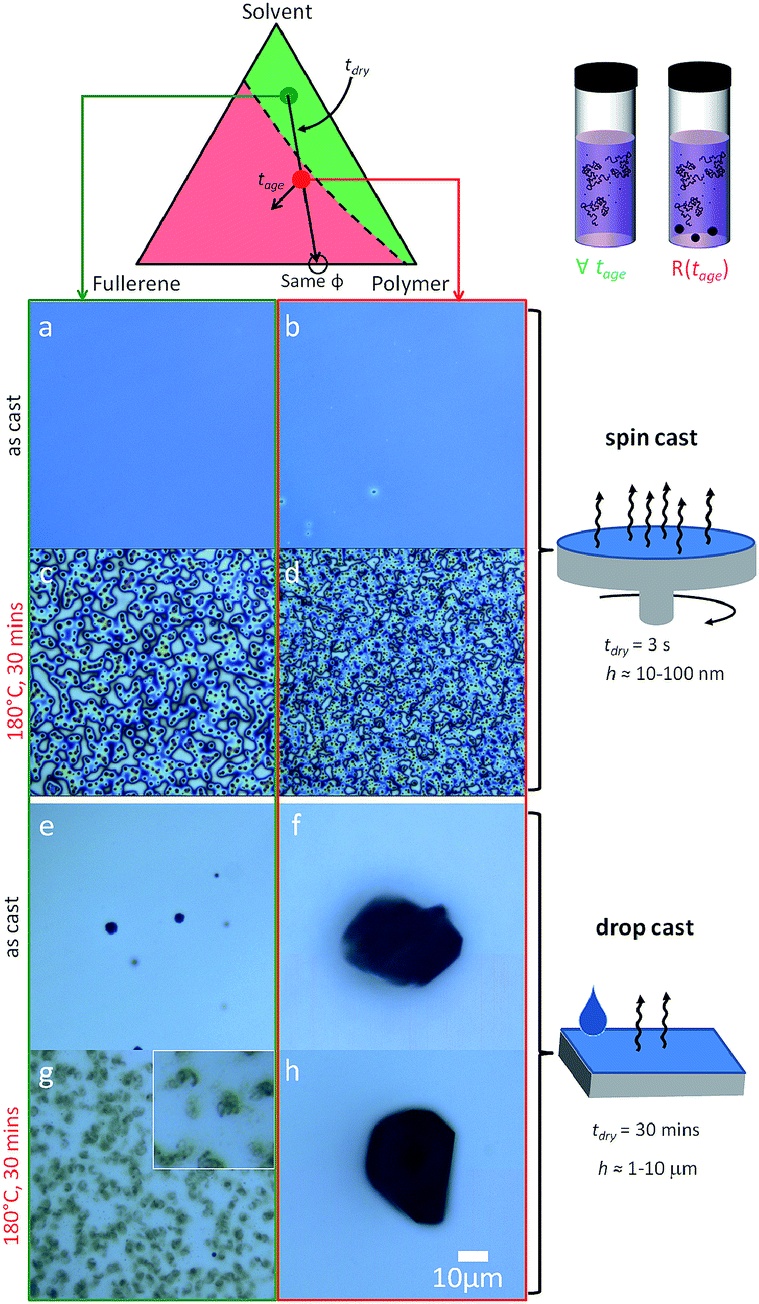 | ||
| Fig. 5 Effect of drying time along the same film formation pathway. (a–d) 5 wt% C60/PS 130 nm thin films fabricated via spin casting yield either an ordered (c) or disordered (d) morphology upon annealing. (e–h) 5 wt% C60/PS ≈ 20 μm thick drop cast films result in (e) sparse fullerene clusters nucleated during drying from homogeneous solutions (green), or (f) large precipitates seeded within the precipitated solution (red) that grow during slow drying. Upon thermal annealing, (g) clusters with a ramified internal structure form from homogeneous solutions and (h) large clusters, similar to those of as-cast films from the precipitated solution. Image width of inset in (g) is 10 μm. Image analysis is shown in Fig. S4.† | ||
The slower drop casting yields dramatically different composite morphologies, shown in Fig. 5e–h. Films cast from the homogeneous (green) solutions yield few ∼1 μm clusters, as seen by optical microscopy in Fig. 5e, that nucleated during drying through the heterogeneous pathway. Upon thermal annealing above Tg, diffuse C60 clusters of several μm forms (Fig. 5g), with a structure reminiscent of bundles with a ramified internal structure. Large (∼100 μm) fractal fullerite C60 structures from toluene can be obtained under specific slow evaporation conditions,37 suggesting that the slow evaporation and a higher viscosity of PS/toluene drop cast solutions yield these ‘tumbleweed’ structures. Directional assembly of C60 in solution with rod-like (and other) features,38,39 and for polymer/colloid mixtures40 have been observed previously. By contrast, films drop cast from aggregated solutions (red) yield large (10’s μm) C60 compact crystalline (and birefringent) clusters regardless of annealing, as shown in Fig. 5f and h (and S4†), suggesting that solution seed clusters grow extensively during the slow drying period and thus thermal annealing has no incremental (nucleation and growth) effect. The controlled growth of C60 micron-sized crystals with various shapes and crystal structures using solvent mixtures has been demonstrated (e.g.ref. 41). The drying pathway, across both sides of the phase boundary, has evidently a significant impact and potential on tuning the morphology of these polymer/fullerene composites.
4 Conclusions
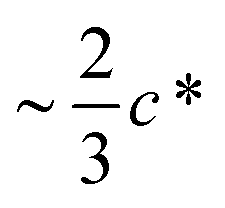
We examined the ternary solution phase behaviour of a model PS/C60/toluene mixture to elucidate the effect of addition of a polymer to the miscibility of C60, as well as the effect of C60 on the polymer conformation. As we have shown previously5 and corroborated with this work, the conformation of PS remains unperturbed across the dilute and semi-dilute regimes. By contrast, the addition of PS to C60/toluene solutions linearly decreases the miscibility limit of C60 in the mixture compared to that in neat toluene. We find that a simple volume argument assuming that the C60 concentration effectively increases by subtraction of the volume occupied by single PS chains describes remarkably well the experimental observations below c* for several MW. We find that the C60 miscibility eventually becomes largely insensitive to further PS addition between 0.12 and 0.15 wt% C60, which is compatible with the estimate of <1% wt for PS/C60 (binary) mixtures.23To assess the generality of our findings, we examined PS/toluene solutions with a more soluble fullerene (PCBM), and PS/PCBM solutions with a better solvent for the fullerene: chlorobenzene. These results are summarised in Fig. S5 and S6.† In short, we find that the phase boundaries vary qualitatively in a similar manner, i.e. a linear decrease in fullerene miscibility upon polymer addition. However, the volume estimate with α ≃ 0.74 (reminiscent of hard sphere packing) was only applied to PS/C60/toluene which we attribute to the large asymmetry in the solubility of PS and C60 in toluene. As this asymmetry decreases (e.g. with PCBM and further with chlorobenzene), the miscibility reduction becomes less sensitive to polymer addition, effectively reducing α (all the way to ≃0). Fullerene miscibility and aggregation appears thus highly dependent on the relative magnitude of the interactions between the solution components.
We have considered PS/C60 film morphologies obtained for identical compositions and thicknesses but formed through different solution pathways. In agreement with the measured phase diagram, we observe films that are rapidly formed by spin casting from the homogeneous region to be uniform, while those cast from above the miscibility line to contain clusters, that depend on solution age. Upon thermal annealing, these also yield different morphologies indicating opportunities for tuning the film morphology by controlling the solution properties, which have not been previously recognised. Slow drying of thick (>μm) films by drop casting has a proportionally larger effect on the resulting morphology (of nominally identical films) by increasing the timescale for fullerene aggregation across the phase boundaries.
Our findings highlight the importance of understanding solution properties of polymer/fullerene (and polymer/nanoparticle) composites in a range of practical applications, including fullerene-based solar cells and advanced coatings that are solution processed.
Acknowledgements
The authors thank the Engineering and Physical Sciences Research Council (EPSRC) for funding (EP/G037515/1), the Royal Society (UK) for an International Exchange award, and the Institute for Molecular Engineering (IME) at the University of Chicago for generous hospitality of JTC. We thank Klaus Huber (Universität Paderborn, Germany) and Jack Douglas (NIST, Maryland) for many thought provoking and useful discussions.References
- J. Keddie and A. F. Routh, Fundamentals of Latex Film Formation - Processes and Properties, Springer Laboratory, 2010 Search PubMed.
- J. Rivney, S. C. B. Mannsfeld, C. E. Miller, A. Salleo and M. F. Toney, Chem. Rev., 2012, 5488–5519 CrossRef PubMed.
- B. C. Thompson and J. M. J. Fréchet, Angew. Chem., Int. Ed., 2008, 47, 58–77 CrossRef CAS PubMed.
- M. T. Dang, L. Hirsch and G. Wantz, Adv. Mater., 2011, 23, 3597–3602 CrossRef CAS.
- R. Dattani, R. Michels, A. J. Nedoma, R. Schweins, P. Westacott, K. Huber and J. T. Cabral, Macromolecules, 2014, 47, 6113–6120 CrossRef CAS.
- A. I. Nakatani, W. Chen, R. G. Schmidt, G. V. Gordon and C. C. Han, Polymer, 2001, 42, 3713–3722 CrossRef CAS.
- S. Sen, Y. Xie, S. Kumar, H. Yang, A. Bansal, D. Ho, L. Hall, J. Hooper and K. Schweizer, Phys. Rev. Lett., 2007, 98, 128302 CrossRef.
- A. Tuteja, P. M. Duxbury and M. E. Mackay, Phys. Rev. Lett., 2008, 100, 77801 CrossRef.
- N. Jouault, F. Dalmas, S. Said, E. Di Cola, R. Schweins, J. Jestin and F. Boué, Macromolecules, 2010, 43, 9881–9891 CrossRef CAS.
- M. K. Crawford, R. J. Smalley, G. Cohen, B. Hogan, B. Wood, S. K. Kumar, Y. B. Melnichenko, L. He, W. Guise and B. Hammouda, Phys. Rev. Lett., 2013, 110, 196001 CrossRef CAS.
- K. J. Mutch, J. S. van Duijneveldt and J. Eastoe, Soft Matter, 2007, 3, 155–167 RSC.
- A. Polson, G. Potgieter, J. Largier, G. Mears and F. Joubert, Biochim. Biophys. Acta, 1964, 82, 463–475 CrossRef CAS.
- T. Odijk, Macromolecules, 1996, 29, 1842–1843 CrossRef CAS.
- P. G. de Gennes, C. R. Seances Acad. Sci., Vie Acad., 1979, 288, 359–361 CAS.
- R. Sear, Phys. Rev. E: Stat. Phys., Plasmas, Fluids, Relat. Interdiscip. Top., 1998, 58, 724–728 CrossRef CAS.
- R. Sear, Phys. Rev. Lett., 2001, 86, 4696–4699 CrossRef CAS.
- P. V. D. Schoot, Macromolecules, 1998, 31, 4635–4638 CrossRef.
- T. Kramer, S. Scholz, M. Maskos and K. Huber, J. Colloid Interface Sci., 2004, 279, 447–457 CrossRef CAS PubMed.
- T. Kramer, R. Schweins and K. Huber, Macromolecules, 2005, 38, 151–159 CrossRef CAS.
- T. Kramer, R. Schweins and K. Huber, Macromolecules, 2005, 38, 9783–9793 CrossRef CAS.
- T. Kramer, R. Schweins and K. Huber, J. Chem. Phys., 2005, 123, 014903 CrossRef PubMed.
- R. S. Ruoff, D. S. Tse, R. Malhotra and D. C. Lorents, J. Phys. Chem., 1993, 97, 3379–3383 CrossRef CAS.
- H. C. Wong, A. Sanz, J. F. Douglas and J. T. Cabral, J. Mol. Liq., 2010, 153, 79–87 CrossRef CAS PubMed.
- M. E. Mackay, A. Tuteja, P. M. Duxbury, C. J. Hawker, B. Van Horn, Z. Guan, G. Chen and R. S. Krishnan, Science, 2006, 311, 1740–1743 CrossRef CAS PubMed.
- K. A. Barnes, J. F. Douglas, D.-W. Liu and A. Karim, Adv. Colloid Interface Sci., 2001, 94, 83–104 CrossRef CAS.
- H. C. Wong and J. T. Cabral, Phys. Rev. Lett., 2010, 105, 38301 CrossRef.
- M. Holmes, M. Mackay and R. Giunta, J. Nanopart. Res., 2007, 9, 753–763 CrossRef CAS.
- M. A. Yaklin, P. M. Duxbury and M. E. Mackay, Soft Matter, 2008, 4, 2441–2447 RSC.
- H. C. Wong and J. T. Cabral, Macromolecules, 2011, 44, 4530–4537 CrossRef CAS.
- H. C. Wong, A. M. Higgins, A. R. Wildes, J. F. Douglas and J. T. Cabral, Adv. Mater., 2012, 25, 985–991 CrossRef PubMed.
- S. Roy, D. Bandyopadhyay, A. Karim and R. Mukherjee, Macromolecules, 2015, 48, 373–382 CrossRef CAS.
- R. Dattani, K. F. Gibson, S. Few, A. J. Borg, P. A. DiMaggio, J. Nelson, S. G. Kazarian and J. T. Cabral, J. Colloid Interface Sci., 2015, 446, 24–30 CrossRef CAS PubMed.
- K. Huber, S. Bantle, P. Lutz and W. Burchard, Macromolecules, 1985, 18, 1461–1467 CrossRef CAS.
- M. Daoud, J. P. Cotton, B. Farnoux, G. Jannink, G. Sarma, H. Benoit, C. Duplessix, C. Picot and P. G. de Gennes, Macromolecules, 1975, 8, 804–818 CrossRef CAS.
- J. P. Cotton, M. Nierlich, F. Boue, M. Daoud, B. Farnoux, G. Jannink, R. Duplessix and C. J. Picot, J. Chem. Phys., 1976, 65, 1101–1108 CrossRef CAS PubMed.
- Q. Ying and B. Chu, Macromolecules, 1987, 20, 362–366 CrossRef CAS.
- I. Zolotukhin, L. Yanchenko and E. Belonogov, JETP Lett., 1998, 67, 720–722 CrossRef.
- V. Georgakilas, F. Pellarini, M. Prato, D. M. Guldi, M. Melle-Franco and F. Zerbetto, Proc. Natl. Acad. Sci. U. S. A., 2002, 99, 5075–5080 CrossRef CAS PubMed.
- C. Park, H. J. Song and H. C. Choi, Chem. Commun., 2009, 4803–4805 RSC.
- V. J. Anderson and H. N. W. Lekkerkerker, Nature, 2002, 416, 811–815 CrossRef CAS PubMed.
- J. Jeong, W.-S. Kim, S.-I. Park, T.-S. Yoon and B. H. Chung, J. Phys. Chem. C, 2010, 114, 12976–12981 CAS.
Footnote |
| † Electronic supplementary information (ESI) available. See DOI: 10.1039/c5sm00053j |
| This journal is © The Royal Society of Chemistry 2015 |