 Open Access Article
Creative Commons Attribution 3.0 Unported Licence
Low temperature ionic conductor: ionic liquid incorporated within a metal–organic framework†
Kazuyuki
Fujie
*ab,
Kazuya
Otsubo
b,
Ryuichi
Ikeda
bc,
Teppei
Yamada
b and
Hiroshi
Kitagawa
*bdef
aR&D Center Kagoshima, Kyocera Corporation, 1-4 Kokubuyamashita-cho, Kirishima-shi, Kagoshima 899-4312, Japan. E-mail: kazuyuki.fujie.hs@kyocera.jp
bDivision of Chemistry, Graduate School of Science, Kyoto University, Kitashirakawa Oiwake-cho, Sakyo-ku, Kyoto 606-8502, Japan. E-mail: kitagawa@kuchem.kyoto-u.ac.jp
cDepartment of Chemistry, University of Tsukuba, Tsukuba 305, Japan
dCore Research for Evolutional Science and Technology (CREST), Japan Science and Technology Agency (JST), 5 Sanban-cho, Chiyoda-ku, Tokyo 102-0075, Japan
eInstitute for Integrated Cell-Material Sciences (iCeMS), Kyoto University, Yoshida, Sakyo-ku, Kyoto 606-8501, Japan
fINAMORI Frontier Research Center, Kyushu University, 744 Motooka, Nishi-ku, Fukuoka 819-3095, Japan
First published on 5th May 2015
Abstract
Ionic liquids (ILs) show promise as safe electrolytes for electrochemical devices. However, the conductivity of ILs decreases markedly at low temperatures because of strong interactions arising between the component ions. Metal–organic frameworks (MOFs) are appropriate microporous host materials that can control the dynamics of ILs via the nanosizing of ILs and tunable interactions of MOFs with the guest ILs. Here, for the first time, we report on the ionic conductivity of an IL incorporated within a MOF. The system studied consisted of EMI-TFSA (1-ethyl-3-methylimidazolium bis(trifluoromethylsulfonyl)amide) and ZIF-8 (Zn(MeIM)2, H(MeIM) = 2-methylimidazole) as the IL and the MOF, respectively. While the ionic conductivity of bulk EMI-TFSA showed a sharp decrease arising from freezing, the EMI-TFSA@ZIF-8 showed no marked decrease because there was no phase transition. The ionic conductivity of EMI-TFSA@ZIF-8 was higher than that of bulk EMI-TFSA below 250 K. This result points towards a novel method by which to design electrolytes for electrochemical devices such as batteries that can operate at low temperatures.
Introduction
Ionic conducting materials have increasingly gained importance in recent years for applications in electrical energy storage and generation. They are used as electrolytes in electrochemical devices, such as secondary batteries, electric double layer capacitors (EDLCs), and fuel cells. These electrochemical devices should operate at low temperatures of 253 K or below for automotive applications, such as electric or hybrid electric vehicles, since vehicles may be exposed to these temperatures.1 Therefore, these devices, particularly lithium ion batteries and EDLCs, contain volatile and flammable organic solvents as electrolytes to avoid freezing of the electrolyte and a decrease in ionic conductivity at low temperatures.2In order to avoid the use of these flammable solvents, ionic liquids (ILs) are promising candidate materials for safe electrolytes in electrochemical devices.3 ILs have desirable properties, such as non-flammability, negligible volatility, high electrochemical and thermal stability, and high ionic conductivity. However, the ionic conductivity of ILs is very low at low temperatures,4 at which the mobility of the ions decreases markedly owing to the formation of intermolecular interactions,5 which are particularly strong below the freezing point of the IL. Being able to tune the intermolecular interactions of the ions is a significant issue for controlling the ionic conductivity and phase behavior of ILs.
Metal–organic frameworks (MOFs) are supposed to be desirable host materials for this purpose. MOFs are a novel group of highly porous, crystalline materials with regular, well-defined micropores. The properties of various types of MOFs have been studied, such as gas adsorption6 and separation;7 their catalytic,8 magnetic,9 electronic,10 and optical11 properties; and their ionic conductivity.12 Furthermore, MOFs can be designed using several different characteristics, such as pore size, framework topology, surface area, and interactions with guest molecules. Therefore, MOFs are appropriate materials for controlling the dynamics of small molecules13 such as ILs via the nanosizing of ILs and tunable interactions of MOFs with the guest ILs.
We have reported previously that an IL inside a MOF's micropores (denoted as IL@MOF) shows no marked phase transition owing to the nanosizing of the IL, even in the low temperature region,14 even though the bulk IL showed the usual freezing and melting behavior. This observation suggests that IL@MOF is a promising ionic conductor that could work at low temperatures. Here, we demonstrate that ionic conduction occurs in the IL@MOF system. We used a thermally and chemically stable MOF, ZIF-8 (Zn(MeIM)2, H(MeIM) = 2-methylimidazole),15 and a highly conductive IL, EMI-TFSA (1-ethyl-3-methylimidazolium bis(trifluoromethylsulfonyl)amide).
Experimental
We incorporated EMI-TFSA into the ZIF-8 nanoparticles (denoted as EMI-TFSA@ZIF-8) by mixing the two materials together using a mortar and pestle, where the EMI-TFSA could theoretically occupy the micropore volumes in the ZIF-8 at loadings of 25%, 50%, 75%, 100%, and 125% (denoted as EZ25, EZ50, EZ75, EZ100, and EZ125, respectively). The smaller particle size of ZIF-8 is preferred to introduce EMI-TFSA into the central portion of each ZIF-8 particle. The mixtures were heated and stored overnight to enhance the diffusion of EMI-TFSA into the micropores. Sample preparation and analysis, except for X-ray powder diffraction (XRPD) experiments, were carried out under inert conditions to prevent water adsorption and absorption.Results and discussion
As shown in the XRPD patterns in Fig. 1, the synthesized ZIF-8 were crystalline, and showed very broad and weak diffraction because of small crystallite size. The crystal size of the ZIF-8 nanocrystals was estimated to be 12 nm using Scherrer's equation. The ZIF-8 crystal structure remained stable, even after mixing with EMI-TFSA and subsequent heating. The relative intensities of the peaks changed on incorporation of the EMI-TFSA. A similar change in relative intensity was reported in alkylammonium salt included ZIF-8.16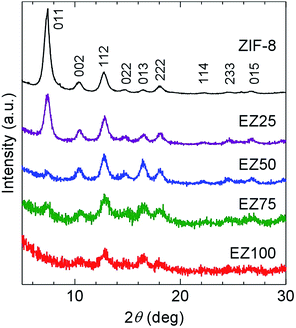 | ||
| Fig. 1 XRPD patterns of ZIF-8, EZ25, EZ50, EZ75, and EZ100. The plane indices were assigned with reference to a previous report.15 | ||
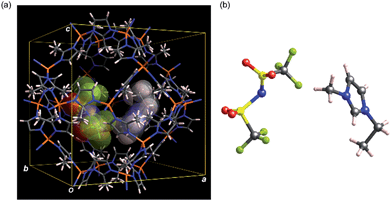
To obtain structural information of EMI-TFSA loaded ZIF-8 samples, structural analyses were carried out using the simulated annealing (SA) method installed on EXPO2013 (ref. 17) followed by Rietveld refinement using the RIETAN-FP18 program. We also investigated electron density within the micropores of the present materials using the maximum entropy method (MEM) using the Dysnomia19 program (for details, see ESI†). Only for these structural analyses, bulk samples of ZIF-8 (ZIF-8bulk: commercially available Basolite® Z1200) and EMI-TFSA loaded ZIF-8bulk with varying loading amount (EZ25bulk and EZ100bulk)14 were used (Fig. S4†). The calculated diffraction patterns based on the Rietveld refinements are in good agreement with experimental patterns indicating that EMI-TFSA units are surely included inside the cage of ZIF-8 (Fig. S5 and S6†). The model crystal structure obtained from Rietveld refinement of EZ25bulk is shown in Fig. 2 (see also Fig. S7†). From the MEM analysis, no obvious charge density was found within the micropore of ZIF-8bulk indicating that the ZIF-8bulk contains no guest molecules. In contrast, apparent electron density peaks were found within the micropores of EZ25bulk and EZ100bulk (Fig. S5 and S6†). In addition, the results of MEM analyses also show that the charge density originating from EMI-TFSA units was low at the centre of the micropore suggesting that EMI-TFSA units attractively interact with the host ZIF-8 framework (Fig. S8†).
We carried out elemental analysis for ZIF-8, EZ50, and EZ100 (Table S1†). The observed CHN ratios are almost the same as the calculated values based on the molar ratio in preparation. This result indicates that the molar ratio of EMI-TFSA to ZIF-8 remains unchanged even after mixing and subsequent heating, because of negligible volatility of the EMI-TFSA.
Nitrogen gas adsorption measurements were carried out to confirm the existence of EMI-TFSA inside the ZIF-8 micropores. As shown in Fig. 3, the samples of ZIF-8, EZ25, and EZ50 showed a sharp uptake at low relative pressure, and a gradual uptake exhibiting hysteresis at higher relative pressure, with the former and the latter values indicating the existence of micropores and mesopores, respectively. The micropores originate from the ZIF-8 framework. The mesopores originate from adsorption in the intergranular spaces between agglomerated ZIF-8 nanoparticles. Agglomeration and fusion of the ZIF-8 nanoparticles was observed using transmission electron microscopy (TEM), as shown in Fig. S3.† The nitrogen gas uptake at low relative pressure decreased with increasing concentration of introduced EMI-TFSA, indicating that the EMI-TFSA was preferentially introduced into the micropores rather than the mesopores.
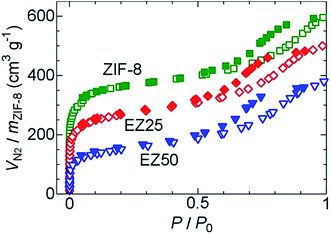 | ||
| Fig. 3 Nitrogen gas adsorption and desorption isotherms of ZIF-8 (green), EZ25 (red), and EZ50 (blue) at 77 K. The open and closed symbols indicate adsorption and desorption, respectively. | ||
Differential scanning calorimetry (DSC) measurements were conducted (Fig. 4) to study phase transitions in the nanosized EMI-TFSA. Bulk EMI-TFSA showed sharp peaks occurring at 257 K on heating and at 231 K on cooling, which indicated melting and freezing of the sample, respectively. By contrast, EMI-TFSA@ZIF-8 except for EZ125 showed no peaks in the DSC measurements between 143 and 473 K. Weak anomalies appeared at almost the same temperatures of the melting and freezing of the bulk EMI-TFSA only in EZ125. This result can be explained by the melting and freezing of the excess EMI-TFSA that was located outside the micropores of ZIF-8. The absence of peaks in EZ25, EZ50, EZ75, and EZ100 suggests that the nanosized EMI-TFSA in the micropores of ZIF-8 was prevented from freezing. Using the pore diameter of ZIF-8 (ref. 15) and the van der Waals volumes of the EMI+ cations and TFSA− anions,20 we confirmed that the storage capacity of each ZIF-8 micropore was only three ion pairs or fewer. This small number of ions is not enough to construct an ordered crystal structure.
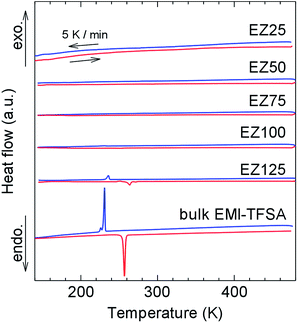 | ||
| Fig. 4 DSC curves of EZ25, EZ50, EZ75, EZ100, EZ125, and bulk EMI-TFSA. The red and blue lines indicate heating and cooling, respectively, at a fixed scan rate of 5 K min−1. | ||
Fig. 5 shows Arrhenius plots of the ionic conductivity. Bulk EMI-TFSA exhibited a sharp decrease in conductivity below 264 K. EZ125, which has the excess EMI-TFSA outside of the micropores of ZIF-8, also showed a decrease in conductivity with the inflection point around 257 K. These temperatures correspond to the melting point of bulk EMI-TFSA (257 K), as shown in the DSC data. By contrast, the ionic conductivity of EZ50, EZ75, and EZ100 showed no sharp decrease corresponding to the phase transition on freezing between 228 and 341 K. The EMI-TFSA inside the ZIF-8 micropores is thus thought to remain liquid, even in the low temperature region. Therefore, the ionic conductivity is maintained in the temperature range where bulk EMI-TFSA is frozen. EZ100 showed a higher ionic conductivity compared with bulk EMI-TFSA below 250 K. This result indicates that IL@MOF could be used as an electrolyte for electrochemical devices that operate in the low temperature region. In addition, the ionic conductivity of EMI-TFSA@ZIF-8 could be increased by several orders of magnitude, dependent on the concentration of EMI-TFSA. This result is anomalous, because in general, ionic conductivity increases linearly with the number of conducting ions present.
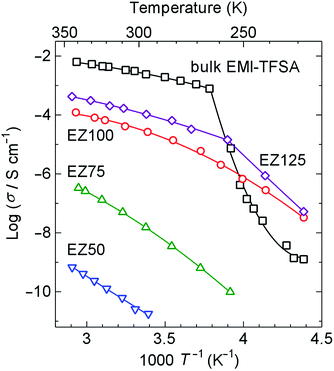 | ||
| Fig. 5 Arrhenius plots of the ionic conductivity of EZ50, EZ75, EZ100, EZ125, and bulk EMI-TFSA on heating. The solid lines are provided as guides for the eye. | ||
We carried out solid-state 19F static nuclear magnetic resonance (NMR) measurements to study the origin of the strong dependence of the conductivity on the concentration of EMI-TFSA. Fig. 6 shows 19F NMR spectra at ambient temperature, indicating the motion state of the TFSA− anions. A sharp line was observed in the spectrum of bulk EMI-TFSA. This indicates a “motional narrowing” arising from the free rotation and diffusion of the TFSA− anions in the bulk liquid state. In all the EMI-TFSA@ZIF-8 samples, almost the same spectrum was obtained, even though the ionic conductivity had increased by up to several orders of magnitude, dependent on the concentration of EMI-TFSA. Therefore, we hypothesized that the strong EMI-TFSA concentration dependence of the ionic conductivity in EMI-TFSA@ZIF-8 does not originate from the mobility of the guest ions, assuming that the mobility of the EMI+ cations and TFSA− anions was in the same range as in bulk EMI-TFSA.21 One of the most reasonable explanations for this observation is that the conductive paths for the ions were strongly connected with an increasing concentration of EMI-TFSA ions. Such continuous paths for mobile ions would lead to the high ionic conductivity of IL@MOF.
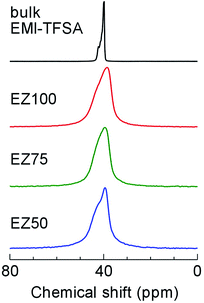 | ||
| Fig. 6 Solid-state 19F static NMR spectra of EZ50, EZ75, EZ100, and bulk EMI-TFSA at ambient temperature. | ||
Conclusions
We have demonstrated the ionic conductivity of an IL inside the micropores of a MOF for the first time. EMI-TFSA inside ZIF-8 micropores showed no marked phase transition from DSC measurements. EMI-TFSA@ZIF-8 showed no marked decrease in conductivity between 228 and 341 K, and showed higher conductivity than bulk EMI-TFSA below 250 K because the nanosized IL in the micropores was prevented from undergoing the freezing transition. This result provides a route towards developing novel electrolytes for electrochemical devices such as secondary batteries and EDLCs that could operate in the low temperature region.Acknowledgements
We wish to thank Mai Muramoto for sample preparations and help in the XRPD, DSC, and ac impedance measurements. We also thank Saeka Fujiwara for help in carrying out the nitrogen gas adsorption measurements.Notes and references
- A. D. Pasquier, I. Plitz, S. Menocal and G. Amatucci, J. Power Sources, 2003, 115, 171 CrossRef.
- (a) M. S. Ding, K. Xu and T. R. Jow, J. Electrochem. Soc., 2000, 147, 1688 CrossRef CAS PubMed; (b) M. C. Smart, B. V. Ratnakumar and S. Surampudi, J. Electrochem. Soc., 1999, 146, 486 CrossRef CAS PubMed; (c) K. Xu, Chem. Rev., 2004, 104, 4303 CrossRef CAS.
- (a) P. Wang, S. M. Zakeeruddin, P. Comte, I. Exnar and M. Grätzel, J. Am. Chem. Soc., 2003, 125, 1166 CrossRef CAS PubMed; (b) M. Ue, M. Takeda, A. Toriumi, A. Kominato, R. Hagiwara and Y. Ito, J. Electrochem. Soc., 2003, 150, A499 CrossRef CAS PubMed; (c) R. F. Souza, J. C. Padilha, R. S. Gonçalves and J. Dupont, Electrochem. Commun., 2003, 5, 728 CrossRef; (d) B. Garcia, S. Lavallée, G. Perron, C. Michot and M. Armand, Electrochim. Acta, 2004, 49, 4583 CrossRef CAS PubMed; (e) T. Sato, G. Masuda and K. Takagi, Electrochim. Acta, 2004, 49, 3603 CrossRef CAS PubMed; (f) J.-H. Shin, W. A. Henderson and S. J. Passerini, J. Electrochem. Soc., 2005, 152, A978 CrossRef CAS PubMed; (g) M. Armand, F. Endres, D. R. MacFarlane, H. Ohno and B. Scrosati, Nat. Mater., 2009, 8, 621 CrossRef CAS PubMed.
- (a) D. R. MacFarlane, J. Huang and M. Forsyth, Nature, 1999, 402, 792 CrossRef CAS; (b) Q. Zhou, P. D. Boyle, L. Malpezzi, A. Mele, J.-H. Shin, S. Passerini and W. A. Henderson, Chem. Mater., 2011, 23, 4331 CrossRef CAS.
- (a) T. Köddermann, C. Wertz, A. Heintz and R. Ludwig, ChemPhysChem, 2006, 7, 1944 CrossRef PubMed; (b) O. Borodin, G. D. Smith and W. Henderson, J. Phys. Chem. B, 2006, 110, 16879 CrossRef CAS PubMed; (c) J.-C. Lassègues, J. Grondin and D. Talaga, Phys. Chem. Chem. Phys., 2006, 8, 5629 RSC; (d) K. Fujii, R. Kanzaki, T. Takamuku, Y. Kameda, S. Kohara, M. Kanakubo, M. Shibayama, S. Ishiguro and Y. Umebayashi, J. Chem. Phys., 2011, 135, 244502 CrossRef PubMed; (e) B. A. D. Neto, E. C. Meurer, R. Galaverna, B. J. Bythell, J. Dupont, R. G. Cooks and M. N. Eberlin, J. Phys. Chem. Lett., 2012, 3, 3435 CrossRef CAS.
- (a) N. L. Rosi, J. Eckert, M. Eddaoudi, D. T. Vodak, J. Kim, M. O'Keeffe and O. M. Yaghi, Science, 2003, 300, 1127 CrossRef CAS PubMed; (b) X. Zhao, B. Xiao, A. J. Fletcher, K. M. Thomas, D. Bradshaw and M. J. Rosseinsky, Science, 2004, 306, 1012 CrossRef CAS PubMed; (c) L. J. Murray, M. Dincă and J. R. Long, Chem. Soc. Rev., 2009, 38, 1294 RSC.
- (a) O. M. Yaghi, G. Li and H. Li, Nature, 1995, 378, 703 CrossRef CAS PubMed; (b) J. R. Li, R. J. Kuppler and H. C. Zhou, Chem. Soc. Rev., 2009, 38, 1477 RSC.
- (a) J. S. Seo, D. Whang, H. Lee, S. I. Jun, J. Oh, Y. J. Jeon and K. Kim, Nature, 2000, 404, 982 CrossRef CAS PubMed; (b) C.-D. Wu, A. Hu, L. Zhang and W. Lin, J. Am. Chem. Soc., 2005, 127, 8940 CrossRef CAS PubMed; (c) J. Y. Lee, Chem. Soc. Rev., 2009, 38, 1450 RSC.
- (a) G. J. Halder, C. J. Kepert, B. Moubaraki, K. S. Murray and J. D. Cashion, Science, 2002, 298, 1762 CrossRef CAS PubMed; (b) M. Kurmoo, Chem. Soc. Rev., 2009, 38, 1353 RSC.
- (a) T. Okubo, R. Kawajiri, T. Mitani and T. Shimoda, J. Am. Chem. Soc., 2005, 127, 17598 CrossRef CAS PubMed; (b) M. Alvaro, E. Carbonell, B. Ferrer, F. X. L. i. Xamena and H. Garcia, Chem.–Eur. J., 2007, 13, 5106 CrossRef CAS PubMed.
- (a) E. Y. Lee, S. Y. Jang and M. P. Suh, J. Am. Chem. Soc., 2005, 127, 6374 CrossRef CAS PubMed; (b) B. Chen, L. Wang, F. Zapata, G. Qian and E. B. Lobkovsky, J. Am. Chem. Soc., 2008, 130, 6718 CrossRef CAS PubMed.
- (a) H. Kitagawa, Y. Nagao, M. Fujishima, R. Ikeda and S. Kanda, Inorg. Chem. Commun., 2003, 6, 346 CrossRef CAS; (b) J. A. Hurd, R. Vaidhyanathan, V. Thangadurai, C. I. Ratcliffe, I. L. Moudrakovski and G. K. H. Shimizu, Nat. Chem., 2009, 1, 705 CrossRef CAS PubMed; (c) B. M. Wiers, M. L. Foo, N. P. Balsara and J. R. Long, J. Am. Chem. Soc., 2011, 133, 14522 CrossRef CAS PubMed.
- (a) E. Eisbein, J.-O. Joswig and G. Seifert, J. Phys. Chem. C, 2014, 118, 13035 CrossRef CAS; (b) V. K. Peterson, P. D. Southon, G. J. Halder, D. J. Price, J. J. Bevitt and C. J. Kepert, Chem. Mater., 2014, 26, 4712 CrossRef CAS; (c) W.-X. Chen, H.-R. Xu, G.-L. Zhuang, L.-S. Long, R.-B. Huang and L.-S. Zheng, Chem. Commun., 2011, 47, 11933 RSC.
- K. Fujie, T. Yamada, R. Ikeda and H. Kitagawa, Angew. Chem., Int. Ed., 2014, 53, 11302 CrossRef CAS PubMed.
- K. S. Park, Z. Ni, A. P. Côté, J. Y. Choi, R. Huang, F. J. Uribe-Romo, H. K. Chae, M. O'Keeffe and O. M. Yaghi, Proc. Natl. Acad. Sci. U. S. A., 2006, 103, 10186 CrossRef CAS PubMed.
- M. Sadakiyo, H. Kasai, K. Kato, M. Takata and M. Yamauchi, J. Am. Chem. Soc., 2014, 136, 1702 CrossRef CAS PubMed.
- A. Altomare, C. Cuocci, C. Giacovazzo, A. Moliterni, R. Rizzi, N. Corriero and A. Falcicchio, J. Appl. Crystallogr., 2013, 46, 1231 CrossRef CAS.
- F. Izumi and K. Momma, Solid State Phenom., 2007, 130, 150 CrossRef.
- K. Momma, T. Ikeda, A. A. Belik and F. Izumi, Powder Diffr., 2013, 28, 184 CrossRef CAS.
- M. Ue, A. Murakami and S. Nakamura, J. Electrochem. Soc., 2002, 149, A1385 CrossRef CAS PubMed.
- A. Noda, K. Hayamizu and M. Watanabe, J. Phys. Chem. B, 2001, 105, 4603 CrossRef CAS.
Footnote |
| † Electronic supplementary information (ESI) available: Experimental details, structures of ZIF-8 and EMI-TFSA, TEM image of ZIF-8 nanocrystals, results of structural characterizations, Nyquist plots, IR spectra and results of elemental analysis. See DOI: 10.1039/c5sc01398d |
| This journal is © The Royal Society of Chemistry 2015 |

