 Open Access Article
Investigating pyridazine and phthalazine exchange in a series of iridium complexes in order to define their role in the catalytic transfer of magnetisation from para-hydrogen†
Kate M.
Appleby
ab,
Ryan E.
Mewis
ab,
Alexandra M.
Olaru
ab,
Gary G. R.
Green
ab,
Ian J. S.
Fairlamb
b and
Simon B.
Duckett
*ab
aCentre for Hyperpolarization in Magnetic Resonance, University of York, York Science Park, York, YO10 5NY, UK. E-mail: simon.duckett@york.ac.uk
bDepartment of Chemistry, University of York, Heslington, York, YO10 5DD, UK
First published on 28th April 2015
Abstract
The reaction of [Ir(IMes)(COD)Cl], [IMes = 1,3-bis(2,4,6-trimethylphenyl)imidazol-2-ylidene, COD = 1,5-cyclooctadiene] with pyridazine (pdz) and phthalazine (phth) results in the formation of [Ir(COD)(IMes)(pdz)]Cl and [Ir(COD)(IMes)(phth)]Cl. These two complexes are shown by nuclear magnetic resonance (NMR) studies to undergo a haptotropic shift which interchanges pairs of protons within the bound ligands. When these complexes are exposed to hydrogen, they react to form [Ir(H)2(COD)(IMes)(pdz)]Cl and [Ir(H)2(COD)(IMes)(phth)]Cl, respectively, which ultimately convert to [Ir(H)2(IMes)(pdz)3]Cl and [Ir(H)2(IMes)(phth)3]Cl, as the COD is hydrogenated to form cyclooctane. These two dihydride complexes are shown, by NMR, to undergo both full N-heterocycle dissociation and a haptotropic shift, the rates of which are affected by both steric interactions and free ligand pKa values. The use of these complexes as catalysts in the transfer of polarisation from para-hydrogen to pyridazine and phthalazine via signal amplification by reversible exchange (SABRE) is explored. The possible future use of drugs which contain pyridazine and phthalazine motifs as in vivo or clinical magnetic resonance imaging probes is demonstrated; a range of NMR and phantom-based MRI measurements are reported.
1. Introduction
Pyridazine and phthalazine are nitrogen-containing heterocycles with derivatives that have proven to be biologically active as anti-asthmatic,1 antifungal,2 anti-HIV-1,3 anti-cancer4,5 and anti-inflammatory drugs6–8 in addition to acting as treatments for Alzheimer's disease.9,10 A wide range of pyridazine and phthalazine coordination complexes are known where ligation takes place through one or both of the nitrogen centres.11–17 When these ligands bind through a single nitrogen centre, the resulting complexes undergo both dissociative ligand loss and 1,2-metallotropic shifts through which the contiguous nitrogen donor atoms interchange positions.12 Such shifts were first described in 1972 for a series of ruthenium porphine complexes that contained an axially-bound methylated pyridazine ligand.12 Rates for ligand shift and dissociation were obtained by nuclear magnetic resonance spectroscopy via line-shape analysis and subsequently the activation parameters for these processes were determined. The authors suggested that the sizeable, and positive, activation entropies that were observed are consistent with a dissociative pathway, although the precise mechanism for the 1,2-metallotropic shift was not discussed.12More recent studies have focused on related octahedral systems where full ligand dissociation was more difficult and the 1,2-metallotropic shift proceeded readily. Examples of such complexes can be found for ruthenium,13 chromium,14 tungsten, platinum11,15,16 and rhenium17 metals. In the more recent reports, the 1,2-metallotropic shift has been referred to as a ‘haptotropic shift’ because of the potential to involve a π-bonding interaction between the two nitrogen centres during exchange. A theoretical study on an octahedral chromium carbonyl complex suggests that this shift can proceed within the solvent cage that surrounds a 16-electron intermediate.18 These processes are illustrated in Scheme 1. The tendency for ligand dissociation has been predicted to increase as the metal becomes less electron rich or the ligand trans to the exchanging site becomes more basic.19
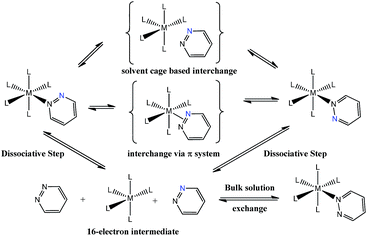 | ||
| Scheme 1 Proposed ligand exchange pathways of pyridazine, the blue nitrogen label is a visualization aid. | ||
Ligand exchange processes are readily probed by Nuclear Magnetic Resonance (NMR) spectroscopy,20 despite its low sensitivity.21 When slow, such exchange pathways are often followed by 1-D and 2-D nuclear Overhauser effect spectroscopy (NOESY).20 When fast, line-shape analysis allows exchange to be probed.22,23 It has been shown that magnetisation transfer from para-hydrogen (p-H2) can help to overcome the sensitivity problem associated with NMR.24,25 This is because, whilst p-H2 itself has no net spin angular momentum and is NMR silent, when used as a reagent in a reaction, products can be formed that possess non-Boltzmann nuclear spin distributions.26–29 The resulting signals that are detected in such NMR experiments can be many thousands of times stronger than normal. Para-hydrogen induced polarisation (PHIP)30 that is created in this way has been shown to enable the study of reaction intermediates that cannot otherwise be detected by NMR spectroscopy because they exist in low concentration.31 In this traditional approach, the reactants must accept H2 and thus be both unsaturated and highly reactive.31
p-H2 has also been used in a non-hydrogenative manner,32 where molecules are hyperpolarised through the establishment of J-coupling with p-H2, whilst they are simultaneously bound to a metal centre in low field. This has also been achieved by radio frequency excitation.33–35 The non-hydrogenative process requires the substrate and p-H2 to exchange freely with their ligated forms in order to build-up a concentration of hyperpolarised substrate in solution. This effect has been termed signal amplification by reversible exchange (SABRE).36 Polarisation transfer now proceeds over the short time period that the sample is stored in a small pre-determined magnetic field.25 This process has attracted interest because, unlike the traditional PHIP approach, it does not result in any chemical change to the detected species and reflects a novel catalytic process.37–40 A growing range of materials, including pyridine, nicotinamide, isoniazid, pyrazinamide and acetonitrile have been polarised in this manner.41–43
Here, we examine the substrates pyridazine (pdz) and phthalazine (phth) using the SABRE approach, whilst taking the opportunity to simultaneously explore their coordination chemistry. [Ir(IMes)(COD)Cl] (1) (where IMes = 1,3-bis(mesityl)imidazol-2-ylidene and COD = 1,5-cyclooctadiene) is used as the synthetic precursor in this study.44 We show that upon reaction of 1 with pyridazine or phthalazine, [Ir(COD)(IMes)(pdz)]Cl (2a) and [Ir(COD)(IMes)(phth)]Cl (2b) form, respectively. We find that these complexes add H2 reversibly to yield highly reactive [Ir(H)2(COD)(IMes)(pdz)]Cl (3a) and [Ir(H)2(COD)(IMes)(phth)]Cl (3b). They subsequently undergo COD hydrogenation to form [Ir(H)2(IMes)(pdz)3]Cl (4a) and [Ir(H)2(IMes)(phth)3]Cl (4b). The mechanism of the ligand dissociation process exhibited by these complexes is probed by NMR spectroscopy and the roles of 4a and 4b as polarisation transfer catalysts in the SABRE of pyridazine and phthalazine are explored. Both NMR and phantom-based MRI measurements are reported to illustrate the wider benefits of hyperpolarisation.
2. Experimental procedures
All the experimental procedures associated with this work were carried out under nitrogen using standard Schlenk techniques or in an MBraun Unilab glovebox. The solvents used in the synthetic chemistry were dried using an Innovative Technology anhydrous solvent system, or distilled from an appropriate drying agent under nitrogen. Methanol-d4, pyridazine and phthalazine were obtained from Sigma-Aldrich and used as supplied. [Ir(IMes)(COD)Cl] (1) was prepared according to literature methods.452.1. Instrumentation and procedures
All NMR measurements were recorded on Bruker Avance III series 400 MHz or 500 MHz systems. NMR samples were prepared in 5 mm NMR tubes fitted with Young's valves. Samples were degassed prior to p-H2 (3 bar) addition. Typical procedures for reactions with pyridazine and phthalazine are described. NMR characterisation data was collected using a range of 1 and 2 D methods that include nOe, COSY and HMQC procedures.46–50 The slow dynamic processes exhibited by the complexes studied here were monitored by EXSY methods.512.2. SABRE analysis
NMR samples were prepared as above. Arrays of NMR measurements were collected using a range of substrate concentrations, as revealed in the ESI.†1H NMR spectra were recorded with either π/4 or π/2 excitation pulses in order to differentiate PHIP and SABRE effects. Each single-scan NMR spectrum was collected immediately after shaking the sample in a magnetic field of 65 G (unless otherwise specified), whilst under 3 bar of p-H2. Enhancement factors were calculated by comparing the peak areas in the resulting NMR spectra with those of analogous traces collected under normal H2 and Boltzmann equilibrium conditions. In order to do this, the peak areas of individual resonances in the corresponding normal NMR spectra were calibrated to 1 and enhancements calculated by comparing these values to those in the polarised spectra. Total signal enhancements were calculated by multiplying this enhancement value by the number of protons in the group and summing across the molecule.2.3. Polarisation transfer field measurements
Polarisation transfer field measurements were made using a dedicated hyperpolarisation apparatus.44 Samples were first prepared in 3 mL of methanol-d4 in an ampoule containing 10 mg of 1 and 5 equivalents of pyridazine or phthalazine. The solution was degassed, and the ampoule was filled with 3 bar pressure of H2 and heated to 348 K overnight to form 4a or 4b. At this point, the resulting solutions were introduced into the flow system and the SABRE effect monitored for polarisation transfer fields that ranged from 0.5 to 140.5 G, in steps of 10 G. This involved the collection of a series of single-scan spectra using either π/2 pulses or shaped pulses50,52 for the multiple quantum filtered experiments. The peak integrals in the resulting NMR spectra were compared to those of a thermally polarised spectrum to determine signal enhancement factors.2.4. EXSY measurements
A series of exchange spectroscopy (EXSY) measurements were made to probe the dynamic behaviour of these systems.53 This process involved the selective excitation of a single resonance and the subsequent measurement of a 1H NMR spectrum at time, t, after the initial pulse. The resulting measurements consisted of a series of data arrays such that t was varied over 10 values, typically from 0.1 to 1.0 s. The precise values were varied with temperature to suit the speed of the process. Data was collected for a range of temperatures and sample concentrations as tabulated in the ESI.†2.5. Kinetic analysis
Integrals for the interchanging peaks in the associated 1H EXSY spectra were obtained and converted into a percentage of the total detected signal. These data were then analysed as a function of the mixing time according to a differential kinetic model.54 Rates of exchange were determined by employing the solver add-on in Microsoft EXCEL to minimize the sum of the residuals in the associated least mean squares analysis. The rate constants obtained in this way were doubled when calculating barrier heights to account for step reversibility.55 Errors associated with the calculated rate constant were determined by the Jackknife procedure of Harris.562.6. Image acquisition and processing
For the imaging experiments, samples containing 4a and 4b were prepared as described earlier. All data was then acquired on a 400 MHz Bruker spectrometer equipped with a micro imaging gradient system (1 T m−1) and a standard 30 mm 1H-13C double resonance birdcage. For the SABRE experiments the sample tubes were filled with 3 bar of p-H2 and shaken in the stray field of the MRI magnet (ca. 70 G). As a reference, images of the samples with Boltzmann-equilibrated magnetisations were recorded in conjunction with a recycle delay of 100 s and 512 averages.A standard rapid acquisition with refocused echoes (RARE)57 sequence composed of a train of 64 π pulses separated by an echo time (TE) of 8.15 ms (effective echo time, TEeff = 114 ms) was used to collect the images. According to Hennig et al., by using a relatively small number of echoes, combined with a short echo time, the effect of transverse relaxation is minimised and the image contrast is dictated by spin density.57 All images used a field of view (FOV) of 30 × 30 mm, a slice thickness of 5 mm and a 64 × 64 matrix size. This led to a raw resolution of 0.47 × 0.47 × 5 mm3. Data were processed by FT and zero filled to 128 × 128 (resulting digital resolution: 0.23 × 0.23 × 5 mm3) using a sine bell noise filter. Signal-to-noise (SNR) values were calculated using an algorithm that assumed a Rice-type noise distribution.
3. Experimental results
3.1. Reaction of [Ir(IMes)(COD)Cl] (1) with pyridazine and phthalazine
It has already been reported that when 1 reacts with pyridine in methanol-d4 it forms [Ir(COD)(IMes)(py)]Cl.44 When pyridine is replaced with either pyridazine or phthalazine the corresponding solutions immediately change colour from yellow to orange due to the formation of the analogous complexes [Ir(COD)(IMes)(pdz)]Cl (2a) and [Ir(COD)(IMes)(phth)]Cl (2b). Both of these complexes have been characterized by NMR spectroscopy and mass spectrometry. Attempts to follow this process by stop-flow UV-Vis spectroscopy, with a dead-time of 0.6 ms, failed because the reaction was too rapid.3.2. Ligand exchange exhibited by [Ir(COD)(IMes)(pdz)]Cl (2a) and [Ir(COD)(IMes)(phth)]Cl (2b)
When these products were analysed by 1H NMR spectroscopy, signals for the bound N-heterocycles could not be resolved at room temperature. To overcome this, a series of NMR spectra were collected at 253 K. The ESI† presents the corresponding 1H, 13C and 15N resonance assignments for these species. A series of 2-D nOe spectra were also collected at 253 K. These confirmed that the NCHCH and NCH protons of the pyridazine ligand in 2a and the phthalazine ligand in 2b switch their nitrogen binding sites on a timescale of 0.5 seconds (see Scheme 2). The broadening of the NMR signals for these ligands, seen at room temperature, is due to this rapid exchange. NMR signals for the free ligand were also present in these spectra, although no exchange into them was observed at this temperature, or upon warming to 298 K. This is therefore an intramolecular process.The intramolecular nature of this process means that the 1,2-metallotropic shift is haptotropic. It occurs via an intermediate with an η2-N![[double bond, length as m-dash]](https://www.rsc.org/images/entities/char_e001.gif) N coordination mode according to Eaton et al.,12 rather than dissociation which would lead to 14-electron [Ir(COD)(IMes)]+ and the observation of exchange with the free ligand pool.
N coordination mode according to Eaton et al.,12 rather than dissociation which would lead to 14-electron [Ir(COD)(IMes)]+ and the observation of exchange with the free ligand pool.
The rate of the haptotropic shift was determined over the temperature range 240 to 260 K by EXSY spectroscopy. Exchange in 2a, between the proton signal at δ 7.69 (corresponding to IrNCHCH) and that at δ 7.51 (corresponding to IrNNCHCH), was probed. The analogous process in 2b was followed between 235 and 255 K by selecting the proton signal at δ 9.55 (corresponding to IrNCH) and observing its exchange into the signal at δ 8.37 (corresponding to IrNNCH). The associated exchange rates were quantified by data fitting (see ESI†). Fig. 1 shows a typical exchange profile, while Table 1 lists the corresponding rate data. The activation parameters for these processes were calculated by Eyring analysis and are given in Table 2. They are similar to those reported.11,14–17
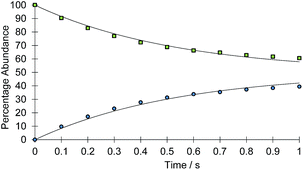 | ||
| Fig. 1 Signal intensity profile change associated with the interchange of the IrNCHCH (green squares) and IrNNCHCH (blue circles) resonances of 2a, according to Scheme 2 above, as a function of reaction time (t). Simulated data is presented as the solid line. | ||
| Temperature/K | Rate of haptotropic shift/s−1 | |
|---|---|---|
| 2a | 2b | |
| 235 | — | 0.923 ± 0.001 |
| 240 | 0.729 ± 0.001 | 1.873 ± 0.003 |
| 245 | 1.501 ± 0.003 | 3.955 ± 0.003 |
| 250 | 3.155 ± 0.002 | 7.318 ± 0.004 |
| 255 | 5.80 ± 0.01 | 13.426 ± 0.004 |
| 260 | 12.74 ± 0.02 | — |
| Complex | ΔH‡/kJ mol−1 | ΔS‡/J mol−1 K−1 | ΔG‡/kJ mol−1 (300 K) |
|---|---|---|---|
| 2a | 71.3 ± 0.3 | 57 ± 1 | 54.2 ± 0.4 |
| 2b | 66.0 ± 0.1 | 43.0 ± 0.6 | 53.1 ± 0.2 |
The enthalpy of activation for the haptotropic shift of 2a is larger than that of 2b by 5 kJ mol−1. This difference suggests that the Ir–pdz bond is stronger than the Ir–phth bond and yet the reported pKa values of pyridazine and phthalazine are 2.33 and 3.50, respectively.58 We suggest that steric interactions result in the smaller activation entropy gain for binding site interchange of the larger and more basic phthalazine ligand.
3.3. Addition of H2 to [Ir(COD)(IMes)(pdz)]Cl (2a) and [Ir(COD)(IMes)(phth)]Cl (2b)
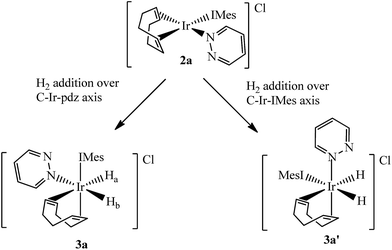
Two separate methanol-d4 solutions of 2a and 2b were exposed to a 3 bar pressure of hydrogen at 240 K. In both cases the solutions changed colour from orange to colourless due to the formation of [Ir(H)2(COD)(IMes)(pdz)]Cl (3a) and [Ir(H)2(COD)(IMes)(phth)]Cl (3b), respectively. These complexes are easily identified by 1H NMR spectroscopy as they yield two coupled hydride resonances, which in the case of 3a lie at δ −13.84 and −17.69, and for 3b lie at δ −13.87 and −17.55. As the hydride ligands of both these products are chemically inequivalent, they must adopt one of two possible product geometries, assuming that hydrogen addition follows the expected concerted route, as shown in Scheme 3.59 In one of these product geometries, the hydride ligands lie trans to the N-heterocycle and COD (3a) while in the second they lie trans to IMes and COD (3a′).60One route to differentiate these two orientations is to recognise that a trans H–Ir–15N coupling is significantly larger than a cis coupling. When a 15N-optimized HMQC NMR spectrum was recorded to probe this, strong cross-peaks were found between the hydride signals at δ −17.55 (of 3b) and −17.69 (of 3a) and the nitrogen signals of the bound N-heterocycle at δ 294.17 and 266.53 respectively. This confirms their mutual trans orientation and that 3a and 3b form by H2 addition over the COD–Ir–N axis of 2a and 2b respectively. This is consistent with the nature of the ligands determining the direction of addition, which in this case favours addition over the axis containing the weak nitrogen donor rather than the strong IMes ligand.61
Furthermore, the corresponding 2D-1H COSY NMR spectrum contains cross-peaks between the hydride ligand signals at δ −13.84 (of 3a) and −13.87 (of 3b) and the inequivalent proton signals that arise from the two CH environments in the bound COD that are trans to hydride. In the case of 3a these COD signals appear at δ 5.09 and 4.45. Both species 3a and 3b have been fully characterised by NMR spectroscopy.
We note that when solutions of 3a and 3b are degassed, reductive elimination of H2 occurs and 2a and 2b reform. H2 addition is therefore a reversible process. These complexes are examples of a relatively rare class of alkene dihydride species that are typically active in alkene hydrogenation. A related iridium pyridylpyrrolide COD complex has been shown by Searles et al. to reversibly bind hydrogen in a similar way.62
3.4. Reaction of [Ir(COD)(H)2(IMes)(pdz)]Cl (3a) and [Ir(COD)(H)2(IMes)(phth)]Cl (3b) with p-H2
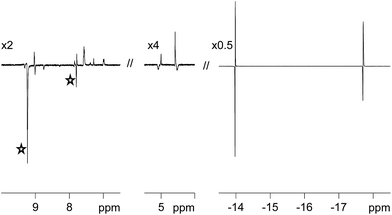
One route to probe the concerted nature of this process is to employ p-H2. This is because PHIP requires the pair-wise transfer of H2. When the H2 atmosphere of these samples is replaced with p-H2, and the NMR tube shaken immediately prior to 1H NMR signal detection, dramatic hydride signal enhancements result. These signal enhancements are illustrated in Fig. 2 for 3a. The experimentally observed signal enhancement was 90-fold for the sharper signal at δ −13.84 due to Ha and 66-fold for the broader signal at δ −17.69 due to Hb. For 3b, smaller 52-fold and 35-fold signal enhancements are observed for the corresponding resonances.In order to compare the reactivity of these complexes we prepared a sample that contained approximately equal amounts of pyridazine and phthalazine (6.73 equivalents of phth and 6.16 equivalents of pdz relative to 1 as measured by NMR). Upon NMR examination, the binding of phthalazine proved to dominate over that of pyridazine, with the ratio of 2b![[thin space (1/6-em)]](https://www.rsc.org/images/entities/char_2009.gif) :
:![[thin space (1/6-em)]](https://www.rsc.org/images/entities/char_2009.gif) 2a being 3.7
2a being 3.7![[thin space (1/6-em)]](https://www.rsc.org/images/entities/char_2009.gif) :
:![[thin space (1/6-em)]](https://www.rsc.org/images/entities/char_2009.gif) 1. When corrected for these slightly unequal starting ligand concentrations, the equilibrium ratio is 3.40
1. When corrected for these slightly unequal starting ligand concentrations, the equilibrium ratio is 3.40![[thin space (1/6-em)]](https://www.rsc.org/images/entities/char_2009.gif) :
:![[thin space (1/6-em)]](https://www.rsc.org/images/entities/char_2009.gif) 1 and ΔΔG2a–2b0 at 240 K is approximately −2.44 kJ mol−1 with 2b being more stable than 2a.
1 and ΔΔG2a–2b0 at 240 K is approximately −2.44 kJ mol−1 with 2b being more stable than 2a.
The normalized PHIP enhancements that are exhibited by the hydride signals of species 3a and 3b upon p-H2 addition at 240 K are 56.8-fold and 38.2-fold, respectively. As the p-H2 concentration in solution is constant and its purity identical at the point of measurement, these numbers can be compared. If we assume that both complexes retain the same level of p-H2 derived magnetisation at the point of their formation then their relative signal intensities will be proportional to the product of their rates of reaction and concentration. The greater abundance of 2b (×3.7), in combination with the hydride signal enhancement levels, suggests that the rate of H2 addition to the more stable 2b is a factor of ca. 4.7 slower than that to 2a.
The PHIP effect that is seen in these hydride signals vanishes rapidly upon the introduction of the sample into the NMR probe at 240 K. This is because the hydrides do not undergo H2 elimination on the NMR timescale at this temperature. However, if the sample is removed from the magnet and shaken to dissolve fresh p-H2, the PHIP effect is re-established in the associated hydride ligand signals. This is due to the transiently higher temperatures that the sample experiences whilst shaken. Under these conditions, however, 3a and 3b are present and it is their exchange rates that control the level of PHIP. In subsequent NMR spectra the levels of observed signal enhancement are almost equal, at 27.6-fold and 20.1-fold. However, in the corresponding thermally equilibrated NMR spectra, at 240 K, the phthalazine dihydride complex 3b still dominates, now by a factor of 3.2. In fact, these data suggest that ΔG3a–3b0 is −2.33 kJ mol−1 at 240 K. Based on these data we can conclude that less stable 3a undergoes more rapid H2 loss than 3b.
Limited evidence for the formation of the isomers 3a′ and 3b′ of Scheme 3 was observed. This is in agreement with the IMes–Ir–COD axis being the most electron rich and the most sterically hindered, and therefore the least able to promote H2 addition across it.59,63 Hydride signals for these species were seen at δ −9.12 and −13.48 for 3a′ and at δ −9.11 and −13.48 for 3b′, with very low intensity. The values of the hydride chemical shifts in this pair of complexes reflect their trans-orientations to soft carbene and COD ligands.64 The signals did not exhibit PHIP, despite being coupled. They are also not visible in the low temperature 1H NMR spectra but can be observed at 298 K. Upon cooling from this temperature, in an effort to trap the species, the corresponding hydride signals vanish and only those for 3a and 3b remain.
We conclude from these data that stability increases in the order 2a < 2b < 3a < 3b and that the addition of H2 proceeds more rapidly to 3a.
3.5. Observation of the SABRE effect in the NMR signals of [Ir(COD)(H)2(IMes)(pdz)]Cl (3a) and [Ir(COD)(H)2(IMes)(phth)]Cl (3b)
The SABRE effect is evident in the first scan of these PHIP enhanced 1H NMR spectra. This is reflected in the observation of enhanced pyridazine resonances for 3a at δ 9.06, 9.03, 7.91 and 7.62, as shown in Fig. 2. Additional enhanced signals corresponding to free pyridazine at δ 9.27 and 7.85 (the NCH and NCHCH environments respectively) are also observed. The ratio of the NCH signal for the free and bound ligand is 4.29![[thin space (1/6-em)]](https://www.rsc.org/images/entities/char_2009.gif) :
:![[thin space (1/6-em)]](https://www.rsc.org/images/entities/char_2009.gif) 1. These data confirm that 3a undergoes pyridazine loss on a shorter timescale than NMR relaxation.
1. These data confirm that 3a undergoes pyridazine loss on a shorter timescale than NMR relaxation.
One surprising feature of these chemical systems is the polarisation of bound CH proton environments of the η4-COD ligand, at δ 5.09 and 4.45 in the case of 3a, although no free COD, COE or COA signals are evident. We note that there is no evidence in the corresponding EXSY spectra to suggest that the bound COD reversibly accepts a hydride ligand.65 SABRE magnetisation transfer proceeds readily from the hydride ligands of 3a and 3b into the ligands that are trans to them.
3.6. Formation of the efficient magnetisation transfer catalysts [Ir(H)2(IMes)(pdz)3]Cl (4a) and [Ir(H)2(IMes)(phth)3]Cl (4b)
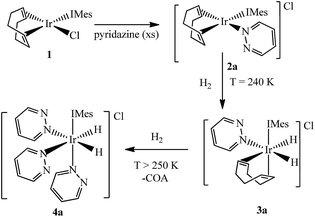
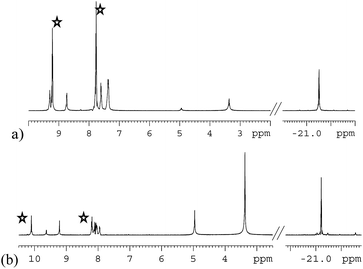
Both 3a and 3b were stable at temperatures up to 250 K, with their hyperpolarisation effects disappearing in solution after several seconds. Above this temperature, however, the COD ligand hydrogenates and forms COA; there is no NMR evidence for COE.65 The vacant sites that are created by the hydrogenation of COD then become occupied by two further pyridazine or phthalazine ligands. This leads to the formation of [Ir(H)2(IMes)(pdz)3]Cl (4a) and [Ir(H)2(IMes)(phth)3]Cl (4b) respectively. These reactions take approximately one hour to go to completion at 298 K. Both 4a and 4b have been characterised by NMR spectroscopy and mass spectrometry. The reaction pathway for the conversion of 1 into 4a is illustrated in Scheme 4. A weak unassigned hydride signal is seen in these 1H NMR spectra at δ −22.87. This may correspond to an intermediate with a similar structure to that of [IrH(1-κ-C8H13)(PMe3)(NCCH3)2]BF4, which provides a diagnostic hydride resonance at δ −20.35.65The organic region of a 1H NMR spectrum of 4a is shown in Fig. 3. The corresponding hydride region, which is not displayed, contains a single peak, at δ −21.47, due to the two chemically equivalent, but magnetically distinct, hydride ligands of this complex. The organic region of this NMR spectrum is complicated as the symmetry of pyridazine is broken upon binding to the metal centre. Seven new aromatic 1H resonances are visible, four of which appear as simple doublets, at δ 9.62, 9.31, 8.75 and 8.29 with integral ratios of 1![[thin space (1/6-em)]](https://www.rsc.org/images/entities/char_2009.gif) :
:![[thin space (1/6-em)]](https://www.rsc.org/images/entities/char_2009.gif) 2
2![[thin space (1/6-em)]](https://www.rsc.org/images/entities/char_2009.gif) :
:![[thin space (1/6-em)]](https://www.rsc.org/images/entities/char_2009.gif) 2
2![[thin space (1/6-em)]](https://www.rsc.org/images/entities/char_2009.gif) :
:![[thin space (1/6-em)]](https://www.rsc.org/images/entities/char_2009.gif) 1 respectively, relative to the 2-proton hydride ligand signal. Their doublet nature means that they arise from pyridazine NCH environments, and their relative areas confirm the presence of a single axial ligand (δ 9.62 and 8.29) and two equivalent equatorial ligands (δ 9.31 and 8.75). The remaining three multiplets, at δ 7.62, 7.48 and 7.40, have integral ratios of 2
1 respectively, relative to the 2-proton hydride ligand signal. Their doublet nature means that they arise from pyridazine NCH environments, and their relative areas confirm the presence of a single axial ligand (δ 9.62 and 8.29) and two equivalent equatorial ligands (δ 9.31 and 8.75). The remaining three multiplets, at δ 7.62, 7.48 and 7.40, have integral ratios of 2![[thin space (1/6-em)]](https://www.rsc.org/images/entities/char_2009.gif) :
:![[thin space (1/6-em)]](https://www.rsc.org/images/entities/char_2009.gif) 1
1![[thin space (1/6-em)]](https://www.rsc.org/images/entities/char_2009.gif) :
:![[thin space (1/6-em)]](https://www.rsc.org/images/entities/char_2009.gif) 3 respectively and arise from the remaining NCHCH environments. The arrangement of these groups around the metal centre was confirmed by nOe measurements at 300 K with mixing times of ≥0.6 s. These data revealed that both the equatorial IrNCH and IrNNCH environments interact with methyl-IMes protons that resonate at δ 2.22 and 2.04. These connections confirm that the equatorial pyridazine ligands lie in close proximity to the IMes ligand. Complex 4a was further characterised by extensive COSY, 13C-optimised HMQC and 15N-optimised HMQC measurements.
3 respectively and arise from the remaining NCHCH environments. The arrangement of these groups around the metal centre was confirmed by nOe measurements at 300 K with mixing times of ≥0.6 s. These data revealed that both the equatorial IrNCH and IrNNCH environments interact with methyl-IMes protons that resonate at δ 2.22 and 2.04. These connections confirm that the equatorial pyridazine ligands lie in close proximity to the IMes ligand. Complex 4a was further characterised by extensive COSY, 13C-optimised HMQC and 15N-optimised HMQC measurements.
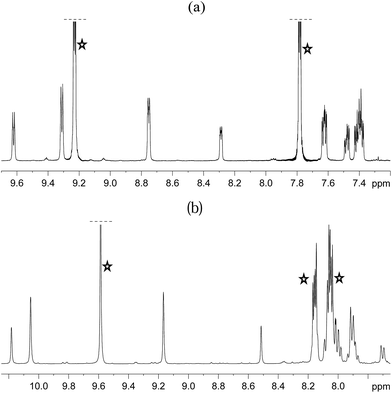 | ||
| Fig. 3 1H NMR spectra of 4a (a) and 4b (b) showing the organic region with key equatorial and axial IrNCH and IrNNCH resonances. Free substrate resonances are also shown (stars). | ||
The phthalazine analogue of 4a, [Ir(H)2(IMes)(phth)3]Cl (4b) was characterised in a similar way. Part of its 1H NMR spectrum is shown in Fig. 3b. A single hydride peak is also observed for this product, at δ −21.0. Peaks at δ 9.63, 8.26 and 8.15 correspond to the NCH, NCHCCH and NCHCCHCH environments of free phthalazine respectively. Four singlets are observed at δ 10.28, 10.16, 9.27 and 8.60 with integral ratios of 1![[thin space (1/6-em)]](https://www.rsc.org/images/entities/char_2009.gif) :
:![[thin space (1/6-em)]](https://www.rsc.org/images/entities/char_2009.gif) 2
2![[thin space (1/6-em)]](https://www.rsc.org/images/entities/char_2009.gif) :
:![[thin space (1/6-em)]](https://www.rsc.org/images/entities/char_2009.gif) 2
2![[thin space (1/6-em)]](https://www.rsc.org/images/entities/char_2009.gif) :
:![[thin space (1/6-em)]](https://www.rsc.org/images/entities/char_2009.gif) 1. These resonances correspond to the bound NCH environments of 4b and can be broken down into axial and equatorial contributions. NMR data for 4a and 4b is given in the ESI.†
1. These resonances correspond to the bound NCH environments of 4b and can be broken down into axial and equatorial contributions. NMR data for 4a and 4b is given in the ESI.†
3.7. Using 15N chemical shifts to support the characterisation of [Ir(H)2(IMes)(pdz)3]Cl (4a) and [Ir(H)2(IMes)(phth)3]Cl (4b)
Modern NMR methods, specifically inverse sequences, allow insensitive nuclei, such as 15N, to be detected when they are present at natural abundance.6615N NMR data, collected by inverse HMQC methods for 4a and 4b are detailed in Table 3. In the case of 4a, pyridazine binding to iridium moves the 15N chemical shift of the free ligand from δ 383.2, to δ 326.2, when bound trans to hydride, and to δ 305.8 when bound trans to carbene. The value of the change in chemical shift on binding Δδ (free-bound) has been suggested to relate to the extent of interaction with the metal.67 As revealed in Table 3, the largest Δδ value is observed for the axial N-heterocycle arrangement with the in-plane change being 30% smaller. This suggests that there is a weaker in-plane ligand interaction as a consequence of the greater trans-influence of hydride relative to IMes.67 The corresponding Δδ values for the remote nitrogen centres in these ligands are much smaller and positive in sign thereby illustrating that electron density surrounding them is significantly less perturbed by the introduction of a metal–ligand interaction.| 4a | Δδ | 4b | Δδ | |
|---|---|---|---|---|
15N equatorial Ir–N![[double bond, length as m-dash]](https://www.rsc.org/images/entities/char_e001.gif) N– N– |
326.2 | −57.0 | 299.7 | −49.9 |
15N equatorial Ir–N![[double bond, length as m-dash]](https://www.rsc.org/images/entities/char_e001.gif) N– N– |
390.0 | 6.8 | 360.9 | 11.3 |
15N axial Ir–N![[double bond, length as m-dash]](https://www.rsc.org/images/entities/char_e001.gif) N– N– |
305.8 | −77.4 | 278.8 | −70.8 |
15N axial Ir–N![[double bond, length as m-dash]](https://www.rsc.org/images/entities/char_e001.gif) N– N– |
392.2 | 9.0 | 362.8 | 13.2 |
3.8. Hydride and N-heterocycle ligand exchange dynamics of [Ir(H)2(IMes)(pdz)3]Cl (4a) and [Ir(H)2(IMes)(phth)3]Cl (4b)
The ligand exchange pathways of 4a and 4b have been explored by NMR spectroscopy. The samples examined here employ d4-methanol as the solvent. A series of 1D EXSY measurements were undertaken, at 10 different temperatures, and both ligand exchange and H2 loss pathways were revealed. These processes were too slow to be detected at temperatures below 280 K and the upper limit of our measurements was 325 K, due to the boiling point of methanol. At this temperature, the exchange rates were too slow to observe any line-shape changes.In the first of our EXSY experiments, peaks corresponding to the NCH environment of the axial ligands in 4a and 4b were probed. No magnetisation transfer was observed from these sites, at 320 K, and we conclude that the axial ligands in both 4a and 4b remain bound to the metal on this timescale and that their involvement in exchange can be neglected. This observation matches the higher strength of interaction predicted through the larger 15N-Δδ value detailed earlier. In contrast, when the equatorial ligands of 4a and 4b were probed, magnetisation transfer indicative of ligand exchange and the ‘shifting’ of the equatorial ligand's nitrogen binding centre was observed by a 1,2-metallotropic shift. A typical EXSY trace is shown in Fig. 4. Both of these processes are common in such systems.11–17 Shifting coordination from one nitrogen centre to the other is likely to proceed via a trigonal bipyramidal transition state, rather than a Berry-pseudorotation, in accordance with the molecular orbital studies by Alvarez et al.19 When the hydride ligand signals of 4a and 4b were examined, in a similar way, exchange into the signal for H2 was observed.
The rate constants for these processes were calculated by analysing an array of EXSY spectra that were recorded with a series of magnetisation transfer times. ESI Scheme 2† illustrates pictorially the exchange processes that occur with pyridazine, and the extracted rate constants as a function of temperature are also available. Eyring analysis of these data provided the activation parameters that are shown in Table 4. The barrier to Ir–N bond rupture (dissociation) is twice the sum of the full ligand loss rate if upon reaching the transition state there is an equal probability of a null-reaction. The haptotropic shift was considered as a separate intramolecular pathway in this analysis.
| Process | ΔH‡/kJ mol−1 | ΔS‡/J K−1 mol−1 | ΔG‡(300 K)/kJ mol−1 | |||
|---|---|---|---|---|---|---|
| complex | 4a | 4b | 4a | 4b | 4a | 4b |
| Substrate dissociation | 97.9 ± 0.3 | 92.0 ± 0.3 | 85 ± 1 | 62 ± 1 | 72.5 ± 0.3 | 73.3 ± 0.3 |
| Haptotropic shift | 94.3 ± 0.4 | 78.13 ± 0.06 | 72 ± 1 | 17.4 ± 0.2 | 72.6 ± 0.3 | 72.93 ± 0.06 |
| H2 loss | 95.6 ± 0.2 | 83.6 ± 0.1 | 82.4 ± 0.8 | 39.8 ± 0.4 | 70.9 ± 0.3 | 71.6 ± 0.2 |
3.9. Mechanism of pyridazine and phthalazine ligand dissociation and binding site shift in [Ir(H)2(IMes)(pdz)3]Cl (4a) and [Ir(H)2(IMes)(phth)3]Cl (4b)
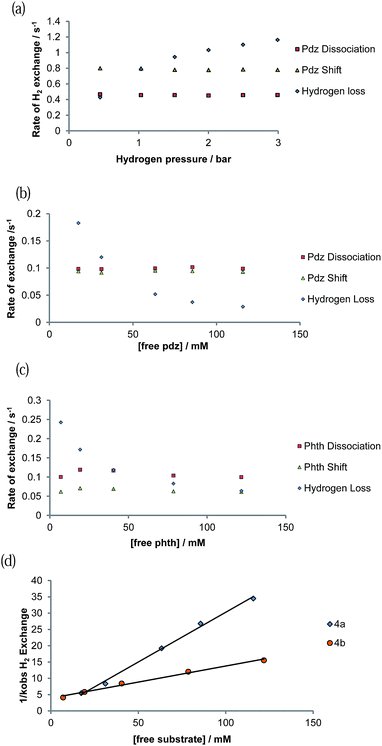
Exchange behaviour was probed as a function of substrate concentration at 285 K (see ESI Tables 6–10†). A plot of ligand exchange rate versus ligand concentration, for a constant concentration of 1, is presented in Fig. 5b for 4a and Fig. 5c for 4b. It can be seen from these data that the experimental rate constants for pyridazine and phthalazine ligand dissociation are unaffected by an increase in the free ligand concentration (Fig. 5b and c). This zero-order rate behaviour is consistent with a dissociative process and a haptotropic shift.18The ΔH‡ values in Table 4 reflect the associated Ir–N bond energies and the barriers to ligand exchange. For each pair of complexes, the enthalpy change on reaching the transition states for the haptotropic shift is lower than that of dissociation. Bulkier phthalazine has a weaker Ir–N bond and hence smaller ΔH‡ term. Consequently, the Ir–N bond is longer and the gain in entropic freedom on reaching the transition state for both phthalazine dissociation and shifting falls. The two effects act to compensate each other such that their ΔG≠(300 K) values are similar. This is particularly noticeable in the haptotropic shift, where the ΔH‡ and ΔS‡ terms of phthalazine are lower by 16.2 kJ mol−1 and 55 J K−1 mol−1 respectively.
As mentioned previously, the literature values for the pKa of pyridazine and phthalazine are 2.33 and 3.50 respectively. Our observed values of 15N-Δδ upon ligand binding were −57.0 and −49.9 respectively. Less basic pyridazine exhibits a stronger bonding interaction than phthalazine; ground state steric effects must therefore control the Ir–N bond strength.
3.10. Mechanism of H2 loss from [Ir(H)2(IMes)(pdz)3]Cl (4a) and [Ir(H)2(IMes)(phth)3]Cl (4b)
The rate of H2 loss from 4a depends on the pressure of H2 for a constant substrate excess, as shown in Fig. 5a. However, when the H2 loss pathway was monitored at constant H2 pressure as a function of substrate concentration, inhibition was observed (Fig. 5b and c). The pseudo-rate constant for H2 loss is inversely proportional to the substrate concentration (Fig. 5d). This behaviour matches with that predicted by DFT for the related pyridine system in which the dihydrogen-dihydride intermediate [Ir(H)2(H2)(IMes)(py)]Cl is involved in H2 exchange.44 The inhibition by substrate occurs as it reacts with 16-electron [Ir(H)2(IMes)(sub)]Cl rather than H2.3.11. SABRE 1H NMR signal enhancement by [Ir(H)2(IMes)(pdz)3]Cl (4a) and [Ir(H)2(IMes)(phth)3]Cl (4b)
Both 4a and 4b undergo ligand exchange on the NMR timescale. Such exchange is necessary for the SABRE effect to successfully hyperpolarise a material. We investigated the effect of shaking a sample of 1 (5.2 mM), containing 5 equivalents of pyridazine and 3 bar of p-H2, in the Earth's magnetic field for 10 seconds at 298 K, prior to collecting a 1H NMR spectrum. 1H NMR signal enhancements are observed in all of the free and bound equatorial substrate resonances, and the hydride resonance of these complexes. No evidence for the formation of any dinuclear complexes was evident, and the phase of the observed hyperpolarised signals for the corresponding free and bound sites were identical.Upon integration, the free pyridazine NCH resonance was 180-times larger than the corresponding signal recorded when the magnetisation was probed under thermal equilibrium conditions. The total signal enhancement of the two resonances in this substrate was 410-fold. When a similar phthalazine sample was probed in an identical way, the hydride signal for 4b, and all of the free and equatorially bound substrate resonances were again enhanced. In this case, the corresponding free NCH resonance was 85-fold enhanced and the total molecular enhancement was 195-fold. The net enhancement factor therefore drops significantly on moving from pyridazine to phthalazine, despite their comparable ligand loss rates. Furthermore, the remote ring of phthalazine, which is connected by a 5-bond coupling of 0.43 Hz into the first ring is only weakly polarised by comparison to the first ring (14%). The underlying difference of 2.1-fold between the polarisation levels observed for these two molecules cannot be accounted for by a spin dilution effect (the consequence of sharing the magnetisation of p-H2 with 6 rather than 4 receptor protons). By implication, the J-coupling that exists between the hydride and Ir–NCH protons of pyridazine must be larger than that to phthalazine, hence better polarisation transfer results; this fits with the predicted shorter bond length.
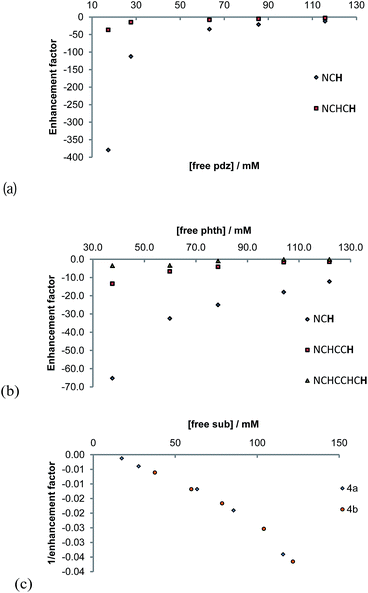
The concentration dependence on the level of SABRE seen in a series of 1H NMR spectra recorded with π/2 pulses is illustrated in Fig. 6a for pyridazine and Fig. 6b for phthalazine. It is clear, in these data, that the proton resonance which corresponds to the site next to nitrogen is most strongly enhanced with 4a delivering a 380-fold NCH intensity gain when a 17 mM concentration of pyridazine is employed in conjunction with a metal concentration of 6.24 mM. The signal enhancement level falls as the substrate concentration increases, when a constant metal concentration is maintained. In addition to reflecting spin-dilution, this change also results in a progressive reduction in the rate of H2 exchange. Both of these effects reduce the levels of signal gain seen for all of the protons of pyridazine and phthalazine. Surprisingly, when the inverse of the sum of the enhancement levels is plotted against equivalents of free substrate, a negative linear relationship can be seen (Fig. 6c).
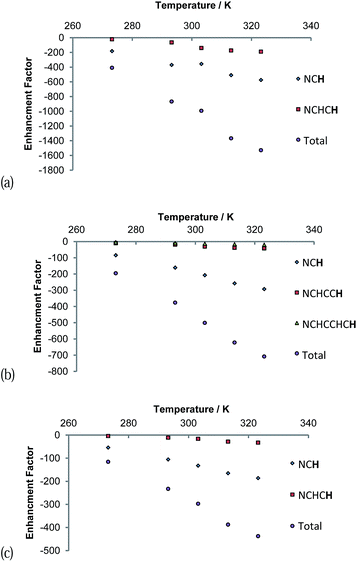
The signal intensity gains that were observed in these 1H NMR spectra also varied with temperature as shown in Fig. 7. A continuous growth in the hyperpolarisation level with increasing temperature is observed between 273 K and 323 K, the highest temperature used. In the first of these samples, the concentration of free pyridazine was 12.3 mM while in the second, the concentration of free phthalazine was 14.1 mM. The corresponding rates of H2 loss at 323 K were estimated to be 29.7 s−1 and 13.49 s−1 respectively. This suggests that an optimal ligand exchange rate has not been reached at 323 K, despite the short lifetimes of these complexes.
The gain in signal strength appears to be linear with temperature, although the gradient exhibited by the 5 resonance intensities differs substantially, falling with distance from the ligation site. This change mirrors the efficiency of their polarisation. The gradients shown for the pyridazine signals are larger than those for phthalazine in accordance with its greater exchange rate sensitivity to temperature. Furthermore, the sensitivity to temperature falls as the substrate excess increases (Fig. 7c). This observation can be rationalised by the fall in H2 exchange rates with increase in ligand concentration.
3.12. Probing the effect of sample dilution on the level of SABRE enhancement
In the case of pyridazine, the effect of the concentration of 4a (with the excess of free pyridazine kept constant) on the level of SABRE enhancement has been rigorously studied. The smallest ligand excess delivered the largest level of polarisation, alongside a metal concentration of 2.8 mM. The maximum total signal enhancement observed in the 1H NMR spectra collected using pyridazine was 1278-fold with a π/2 pulse. Normally, the S/N value associated with a given resonance is proportional to concentration. Here, however, the S/N value is linked to the product of the concentration and the hyperpolarisation level. An approximately linear dependence on the detected signal strength with concentration was observed experimentally for samples in which the substrate concentration lay between 2.8 mM and 6.2 mM, as shown in Fig. 8. We conclude from these observations that there is no benefit in working at higher concentration, even if there is an abundance of the available substrate, since the fall in SABRE level acts to offset the signal gain resulting from an increase in concentration.68,69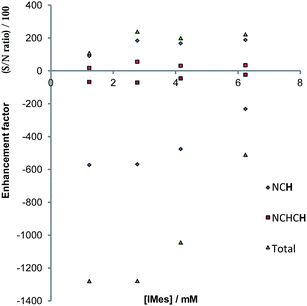 | ||
| Fig. 8 Plots of S/N (upper), and the indicated hyperpolarised 1H NMR signal intensities (lower) of pyridazine as a function of catalyst concentration. | ||
3.13. Probing the effect of the polarisation transfer field on the efficiency of SABRE
The variation in the level of SABRE observed with the magnetic field experienced by the sample at the point of polarisation transfer is substantial (see ESI†). Both substrates behave in a similar way, each yielding their largest free ligand single spin enhancement values when the polarisation transfer field is 65 G. Consequently, this field should be used for detection. SABRE, however, also creates higher order magnetic terms which are optimally enhanced at different field values (see ESI†).70 It is possible to selectively observe the signals from these substrates without the need for a deuterated solvent by employing the OPSY protocol as shown in Fig. 9.71,723.14. SABRE enhancements delivered by [Ir(H)2(IMes)(pdz)3]Cl (4a) and [Ir(H)2(IMes)(phth)3]Cl (4b) as a function of the polarisation transfer time
Increasing the time that these samples are exposed to p-H2 during the SABRE step further increases the level of signal enhancement. The plots in ESI Fig. 13–23† show how the resonance intensities vary with the polarisation transfer time. Ultimately, the maximum polarisation level reaches a plateau as T1(effective) of the probed state counteracts the rate of SABRE build-up. The polarisation builds up most quickly in the single spin NCH protons, and ultimately reaches a higher polarisation level than any other spin state. While the observed rate of two-spin order build up is comparable to that of a single spin their ultimate amplitudes are lower as a consequence of their more rapid relaxation (se ESI†).3.15. Using SABRE to collect MRI data
We recorded a series of SABRE images and compared them to their thermal counterparts (Fig. 10). As expected, these images exhibited better signal to noise, improved contrast, and signal intensity. Furthermore, the samples of pyridazine were superior to those of phthalazine in terms of signal intensity (one order of magnitude higher) for the same concentration of substrate.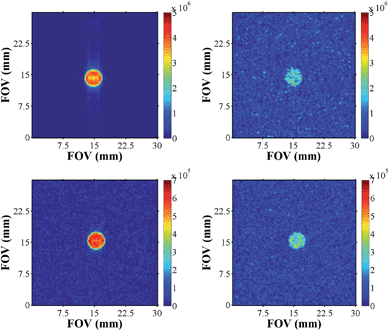 | ||
| Fig. 10 Hyperpolarised images of pyridazine (upper, left) and phthalazine (lower left) compared to their respective thermally equilibrated images (right). | ||
In order to more precisely quantify the improvement in image quality, five one-shot images of the hyperpolarised samples were acquired and the resulting image SNR's calculated. The average result was divided by the SNR of a reference image that was recorded under Boltzmann equilibrium conditions using 512 averages. The underlying improvement in contrast and image quality is revealed in Table 5. A considerable increase in the SNR values was observed, and the acquisition times required for SABRE images were 6 orders of magnitude smaller than the scan times necessary under thermal equilibrium conditions (260 ms versus several hours).
| Catalyst | SNRhyp | SNRhyp (max. value) | SNRhyp/SNRB | SNRhyp/SNRB (max. value) |
|---|---|---|---|---|
| 4a | 185 | 234 | 1100 | 1392 |
| 4b | 72 | 96 | 229 | 306 |
The optimum conditions used to hyperpolarise both pyridazine and phthalazine in methanol, at 298 K, have been applied to 5-aminophthalazine, which has antifungal properties.73 Preliminary results are very promising – with total signal enhancements of ca. 500-fold being observed. The applicability of SABRE, in hyperpolarising pyridazine and phthalazine-derived drug molecules for use as contrast agents, is dependent ultimately on performance in biologically-compatible solvents. Although water would seem an obvious solvent choice, SABRE has not yet been shown to work efficiently in this medium.37,39 An ethanol–water mixture is, however, biocompatible, hence the use of ethanol, followed by dilution has been predicted to be viable.70,74 We have therefore examined pyridazine and phthalazine in ethanol-d6. Our preliminary results reveal superior SABRE in this solvent, with the pyridazine signal enhancement of ca. 400-fold (9.62-fold excess, 60 mM free pyridazine) being 33% better than in methanol. For phthalazine the total signal enhancement was 480-fold (2.12-fold excess, 13.2 mM free phthalazine) or 20% better. Our studies on 5-aminophthalazine confirm that further functionalisation of the remote ring will not prevent SABRE activity and an array of such materials could be probed.75
4. Conclusions
We have established that [Ir(IMes)(COD)Cl] (1) reacts rapidly with pyridazine and phthalazine to form the ligand substitution products [Ir(IMes)(COD)(pdz)]Cl, 2a and [Ir(IMes)(COD)(phth)]Cl 2b, respectively. Phthalazine is more basic than pyridazine, and 2b is more stable than 2a.76 These complexes undergo a haptotropic shift on the NMR timescale which is more rapid for 2b.Complexes 2a and 2b add H2 to form the corresponding Ir(III) complexes [Ir(H)2(COD)(IMes)(pdz)]Cl (3a) and [Ir(H)2(COD)(IMes)(phth)]Cl (3b), where 3b is more stable than 3a. When the H2 addition reaction was monitored with p-H2, PHIP was observed in the hydride NMR signals of these two products and 2a is more reactive to H2 addition than 2b. 3a and 3b also exhibit SABRE in specific ligand resonances that lie trans to the hydrides. This demonstrates that hyperpolarisation can be used to characterise such complexes, even if they have a transient existence.
3a and 3b are highly reactive and upon warming they rapidly convert to the dihydrides [Ir(H)2(IMes)(pdz)3]Cl (4a) and [Ir(H)2(IMes)(phth)3]Cl (4b). These two complexes also undergo a haptotropic ligand shift in addition to full ligand loss on the NMR timescale. The iridium–nitrogen bonds of 4a are stronger than those of 4b. The hyperpolarisation of both pyridazine and phthalazine by 4a and 4b respectively, under SABRE, proved to be facile. NMR enhancements increase with temperature, due to faster ligand exchange, and are optimised with 5 equivalents of substrate, and a polarisation transfer field of 65 G. An optimised enhancement level, at 298 K, of 1278-fold was achieved for pyridazine.
The total signal enhancement of pyridazine was consistently larger than that of phthalazine even though the ligand loss rates of 4a and 4b were comparable. This difference in behaviour cannot be accounted for by the sharing of magnetisation from p-H2 with 4 rather than 6 receptor protons, but instead suggests that the J-coupling between the hydride and Ir–NCH protons of pyridazine is larger than that to phthalazine. This deduction agrees with the predicted shorter Ir–N bond length in 4a. A series of more complex magnetic states can also be created which allow the observation of these substrates in protio solvents through the OPSY protocol.
Finally, we have shown that it is possible to collect optimised MRI images for these substrates on phantoms. Whilst neither pyridazine nor phthalazine are used clinically, their derivatives, in the form of drugs such as Hydralazine,77 play an important role in medicine; we have polarised 5-aminophthalazine which has antifungal properties and achieved total enhancement levels of 500-fold. In the future, we plan to use the results of this study to aid in the optimisation of SABRE for the analysis of similar heterocycles that are used pharmaceutically.
Conflict of interest
The authors have no competing financial interest.Abbreviations
| COA | Cyclooctane |
| COD | 1,5-Cyclooctadiene |
| COE | Cyclooctene |
| DFT | Density functional theory |
| η | Eta coordination |
| EXSY | Exchange spectroscopy |
| IMes | 1,3-Bis(2,4,6-trimethylphenyl)imidazol-2-ylidene |
| MRI | Magnetic resonance imaging |
| nOesy | Nuclear overhauser effect spectroscopy |
| NMR | Nuclear magnetic resonance |
| pdz | Pyridazine |
| p-H2 | para-Hydrogen |
| PHIP | para-Hydrogen-induced polarisation |
| phth | Phthalazine |
| SABRE | Signal amplification by reversible exchange |
| σ-CAM | Sigma-complex assisted metathesis |
| S/N | Signal to noise ratio |
Acknowledgements
Funding Sources. We are grateful for financial support from the EPSRC (grant no. EP/G009546/1), the MRC (studentship KDA) and Bruker BioSpin (CASE studentship KMA, and equipment). We also acknowledge helpful discussions with Dr J. Lohman. SBD, IJSF and GGRG would like to thank the Wellcome Trust and Wolfson Foundation (grants 092506 and 098335).Notes and references
- M. Kuwahara, Y. Kawano, M. Kajino, Y. Ashida and A. Miyake, Chem. Pharm. Bull., 1997, 45, 1447–1457 CrossRef CAS.
- C. Lamberth, S. Trah, S. Wendeborn, R. Dumeunier, M. Courbot, J. Godwin and P. Schneiter, Bioorg. Med. Chem., 2012, 20, 2803–2810 CrossRef CAS PubMed.
- D. G. H. Livermore, R. C. Bethell, N. Cammack, A. P. Hancock, M. M. Hann, D. V. S. Green, R. B. Lamont, S. A. Noble, D. C. Orr, J. J. Payne, M. V. J. Ramsay, A. H. Shingler, C. Smith, R. Storer, C. Williamson and T. Willson, J. Med. Chem., 1993, 36, 3784–3794 CrossRef CAS.
- L. S. Chen, S. Redkar, D. Bearss, W. G. Wierda and V. Gandhi, Blood, 2009, 114, 4150–4157 CrossRef CAS PubMed.
- V. Pogacic, A. N. Bullock, O. Fedorov, P. Filippakopoulos, C. Gasser, A. Biondi, S. Meyer-Monard, S. Knapp and J. Schwaller, Cancer Res., 2007, 67, 6916–6924 CrossRef CAS PubMed.
- S. Bingham, P. J. Beswick, C. Bountra, T. Brown, I. B. Campbell, I. P. Chessell, N. Clayton, S. D. Collins, P. T. Davey, H. Goodland, N. Gray, C. Haslam, J. P. Hatcher, A. J. Hunter, F. Lucas, G. Murkitt, A. Naylor, E. Pickup, B. Sargent, S. G. Summerfield, A. Stevens, S. C. Stratton and J. Wiseman, J. Pharmacol. Exp. Ther., 2005, 312, 1161–1169 CrossRef CAS PubMed.
- J. M. Craft, D. M. Watterson and L. J. Van Eldik, Expert Opin. Ther. Targets, 2005, 9, 887–900 CrossRef CAS PubMed.
- E. Abignente, F. Arena, E. Luraschi, C. Saturnino, E. Marmo, L. Berrino and D. Donnoli, Farmaco, 1990, 45, 1075–1087 CAS.
- T. M. Bare, J. F. Resch and P. F. Jackson, US Pat., US 5652239, 1997.
- W. R. Carling, A. M. MacLeod, R. McKernan, A. J. Reeve, F. Sternfeld and L. J. Street, US Pat., US 6465462, 2002.
- E. W. Abel, E. S. Blackwall, P. J. Heard, K. G. Orrell, V. Sik, M. B. Hursthouse, M. A. Mazid and K. M. A. Malik, J. Chem. Soc., Dalton Trans., 1994, 445–455 RSC.
- S. S. Eaton, G. R. Eaton and R. H. Holm, J. Organomet. Chem., 1972, 39, 179–195 CrossRef CAS.
- Y. Chen and R. E. Shepherd, Inorg. Chim. Acta, 1998, 279, 85–94 CrossRef CAS.
- K. R. Dixon, D. T. Eadie and S. R. Stobart, Inorg. Chem., 1982, 21, 4318–4321 CrossRef CAS.
- E. W. Abel, P. J. Heard, K. G. Orrell and V. Sik, Polyhedron, 1994, 13, 2907–2913 CrossRef CAS.
- E. W. Abel, P. J. Heard, K. G. Orrell, M. B. Hursthouse and K. M. A. Malik, J. Chem. Soc., Dalton Trans., 1995, 3165–3171 RSC.
- E. W. Abel, P. J. Heard and K. G. Orrell, Inorg. Chim. Acta, 1997, 255, 65–71 CrossRef CAS.
- S. K. Kang, T. A. Albright and C. Mealli, Inorg. Chem., 1987, 26, 3158–3166 CrossRef CAS.
- S. Alvarez, M. J. Bermejo and J. Vinaixa, J. Am. Chem. Soc., 1987, 109, 5316–5323 CrossRef CAS.
- J. Jeener, B. H. Meier, P. Bachmann and R. R. Ernst, J. Chem. Phys., 1979, 71, 4546–4553 CrossRef CAS PubMed.
- K. Golman, R. in't Zandt and M. Thaning, Proc. Natl. Acad. Sci. U. S. A., 2006, 103, 11270–11275 CrossRef CAS PubMed.
- J. Feeney, J. G. Batchelor, J. P. Albrand and G. C. K. Roberts, J. Magn. Reson., 1979, 33, 519–529 CAS.
- G. Binsch, J. Am. Chem. Soc., 1969, 91, 1304–1309 CrossRef CAS.
- J. Natterer and J. Bargon, Prog. Nucl. Magn. Reson. Spectrosc., 1997, 31, 293–315 CrossRef.
- R. A. Green, R. W. Adams, S. B. Duckett, R. E. Mewis, D. C. Williamson and G. G. R. Green, Prog. Nucl. Magn. Reson. Spectrosc., 2012, 67, 1–48 CrossRef CAS PubMed.
- C. R. Bowers and D. P. Weitekamp, Phys. Rev. Lett., 1986, 57, 2645–2648 CrossRef CAS.
- S. B. Duckett and C. J. Sleigh, Prog. Nucl. Magn. Reson. Spectrosc., 1999, 34, 71–92 CrossRef CAS.
- D. Blazina, S. B. Duckett, J. P. Dunne and C. Godard, Dalton Trans., 2004, 2601–2609 RSC.
- S. Gloggler, J. Colell and S. Appelt, J. Magn. Reson., 2013, 235, 130–142 CrossRef CAS PubMed.
- T. C. Eisenschmid, R. U. Kirss, P. P. Deutsch, S. I. Hommeltoft and R. Eisenberg, J. Am. Chem. Soc., 1987, 109, 8089–8091 CrossRef CAS.
- S. B. Duckett and R. E. Mewis, Acc. Chem. Res., 2012, 45, 1247–1257 CrossRef CAS PubMed.
- R. W. Adams, J. A. Aguilar, K. D. Atkinson, M. J. Cowley, P. I. P. Elliott, S. B. Duckett, G. G. R. Green, I. G. Khazal, J. Lopez-Serrano and D. C. Williamson, Science, 2009, 323, 1708–1711 CrossRef CAS PubMed.
- K. D. Atkinson, M. J. Cowley, S. B. Duckett, P. I. P. Elliott, G. G. R. Green, J. Lopez-Serrano, I. G. Khazal and A. C. Whitwood, Inorg. Chem., 2009, 48, 663–670 CrossRef CAS PubMed.
- T. Theis, M. Truong, A. M. Coffey, E. Y. Chekmenev and W. S. Warren, J. Magn. Reson., 2014, 248, 23–26 CrossRef CAS PubMed.
- A. N. Pravdivtsev, A. V. Yurkovskaya, H. M. Vieth and K. L. Ivanov, Phys. Chem. Chem. Phys., 2014, 16, 24672–24675 RSC.
- K. D. Atkinson, M. J. Cowley, P. I. P. Elliott, S. B. Duckett, G. G. R. Green, J. Lopez-Serrano and A. C. Whitwood, J. Am. Chem. Soc., 2009, 131, 13362–13368 CrossRef CAS PubMed.
- H. F. Zeng, J. D. Xu, M. T. McMahon, J. A. B. Lohman and P. C. M. van Zijl, J. Magn. Reson., 2014, 246, 119–121 CrossRef CAS PubMed.
- J. B. Hovener, S. Knecht, N. Schwaderlapp, J. Hennig and D. von Elverfeldt, ChemPhysChem, 2014, 15, 2451–2457 CrossRef PubMed.
- M. L. Truong, F. Shi, P. He, B. X. Yuan, K. N. Plunkett, A. M. Coffey, R. V. Shchepin, D. A. Barskiy, K. V. Kovtunov, I. V. Koptyug, K. W. Waddell, B. M. Goodson and E. Y. Chekmenev, J. Phys. Chem. B, 2014, 118, 13882–13889 CrossRef CAS PubMed.
- D. A. Barskiy, K. V. Kovtunov, I. V. Koptyug, P. He, K. A. Groome, Q. A. Best, F. Shi, B. M. Goodson, R. V. Shchepin, A. M. Coffey, K. W. Waddell and E. Y. Chekmenev, J. Am. Chem. Soc., 2014, 136, 3322–3325 CrossRef CAS PubMed.
- H. Zeng, J. Xu, J. Gillen, M. T. McMahon, D. Artemov, J.-M. Tyburn, J. A. B. Lohman, R. E. Mewis, K. D. Atkinson, G. G. R. Green, S. B. Duckett and P. C. M. van Zijl, J. Magn. Reson., 2013, 237, 73–78 CrossRef CAS PubMed.
- E. B. Duecker, L. T. Kuhn, K. Muennemann and C. Griesinger, J. Magn. Reson., 2012, 214, 159–165 CrossRef CAS PubMed.
- M. Fekete, O. Bayfield, S. B. Duckett, S. Hart, R. E. Mewis, N. Pridmore, P. J. Rayner and A. Whitwood, Inorg. Chem., 2013, 52, 13453–13461 CrossRef CAS PubMed.
- M. J. Cowley, R. W. Adams, K. D. Atkinson, M. C. R. Cockett, S. B. Duckett, G. G. R. Green, J. A. B. Lohman, R. Kerssebaum, D. Kilgour and R. E. Mewis, J. Am. Chem. Soc., 2011, 133, 6134–6137 CrossRef CAS PubMed.
- O. Torres, M. Martin and E. Sola, Organometallics, 2009, 28, 863–870 CrossRef CAS.
- K. Stott, J. Stonehouse, J. Keeler, T. L. Hwang and A. J. Shaka, J. Am. Chem. Soc., 1995, 117, 4199–4200 CrossRef CAS.
- J. Stonehouse, P. Adell, J. Keeler and A. J. Shaka, J. Am. Chem. Soc., 1994, 116, 6037–6038 CrossRef CAS.
- A. A. Shaw, C. Salaun, J. F. Dauphin and B. Ancian, J. Magn. Reson., 1996, 120, 110–115 CrossRef CAS.
- B. Ancian, I. Bourgeois, J. F. Dauphin and A. A. Shaw, J. Magn. Reson., 1997, 125, 348–354 CrossRef CAS.
- H. Kessler, H. Oschkinat and C. Griesinger, J. Magn. Reson., 1986, 70, 106–133 CAS.
- N. G. Vassilev and V. S. Dimitrov, Magn. Reson. Chem., 2001, 39, 607–614 CrossRef CAS PubMed.
- C. Bauer, R. Freeman, T. Frenkiel, J. Keeler and A. J. Shaka, J. Magn. Reson., 1984, 58, 442–457 CAS.
- K. Stott, J. Keeler, Q. N. Van and A. J. Shaka, J. Magn. Reson., 1997, 125, 302–324 CrossRef CAS.
- W. D. Jones, G. P. Rosini and J. A. Maguire, Organometallics, 1999, 18, 1754–1760 CrossRef CAS.
- M. L. H. Green, L. L. Wong and A. Sella, Organometallics, 1992, 11, 2660–2668 CrossRef CAS.
- D. C. Harris, J. Chem. Educ., 1998, 75, 119–121 CrossRef CAS.
- J. Hennig, A. Nauerth and H. Friedburg, Magn. Reson. Med., 1986, 3, 823–833 CrossRef CAS PubMed.
- H. J. S. Machado and A. Hinchliffe, J. Mol. Struct.: THEOCHEM, 1995, 339, 255–258 CrossRef CAS.
- C. E. Johnson and R. Eisenberg, J. Am. Chem. Soc., 1985, 107, 3148–3160 CrossRef CAS.
- A. L. Sargent, M. B. Hall and M. F. Guest, J. Am. Chem. Soc., 1992, 114, 517–522 CrossRef CAS.
- A. L. Sargent and M. B. Hall, Inorg. Chem., 1992, 31, 317–321 CrossRef CAS.
- K. Searles, M. Pink, K. G. Caulton and D. J. Mindiola, Dalton Trans., 2012, 9619–9622 RSC.
- C. E. Johnson, B. J. Fisher and R. Eisenberg, J. Am. Chem. Soc., 1983, 105, 7772–7774 CrossRef CAS.
- R. F. R. Jazzar, S. A. Macgregor, M. F. Mahon, S. P. Richards and M. K. Whittlesey, J. Am. Chem. Soc., 2002, 124, 4944–4945 CrossRef CAS PubMed.
- M. Martin, E. Sola, O. Torres, P. Plou and L. A. Oro, Organometallics, 2003, 22, 5406–5417 CrossRef CAS.
- A. Bax, S. W. Sparks and D. A. Torchia, Methods Enzymol., 1989, 176, 134–150 CAS.
- L. Pazderski, Magn. Reson. Chem., 2008, 46, S3–S15 CrossRef PubMed.
- N. Eshuis, N. Hermkens, B. J. A. van Weerdenburg, M. C. Feiters, F. Rutjes, S. S. Wijmenga and M. Tessari, J. Am. Chem. Soc., 2014, 136, 2695–2698 CrossRef CAS PubMed.
- S. Gloggler, M. Emondts, J. Colell, R. Muller, B. Blumich and S. Appelt, Analyst, 2011, 136, 1566–1568 RSC.
- R. E. Mewis, K. D. Atkinson, M. J. Cowley, S. B. Duckett, G. G. R. Green, R. A. Green, L. A. R. Highton, D. Kilgour, L. S. Lloyd, J. A. B. Lohman and D. C. Williamson, Magn. Reson. Chem., 2014, 52, 358–369 CrossRef CAS PubMed.
- J. A. Aguilar, P. I. P. Elliott, J. Lopez-Serrano, R. W. Adams and S. B. Duckett, Chem. Commun., 2007, 1183–1185 RSC.
- J. A. Aguilar, R. W. Adams, S. B. Duckett, G. G. R. Green and R. Kandiah, J. Magn. Reson., 2011, 208, 49–57 CrossRef CAS PubMed.
- C.-K. Ryu, R.-E. Park, M.-Y. Ma and J.-H. Nho, Bioorg. Med. Chem. Lett., 2007, 17, 2577–2580 CrossRef CAS PubMed.
- J. B. Hovener, N. Schwaderlapp, R. Borowiak, T. Lickert, S. B. Duckett, R. E. Mewis, R. W. Adams, M. J. Burns, L. A. R. Highton, G. G. R. Green, A. Olaru, J. Hennig and D. von Elverfeldtt, Anal. Chem., 2014, 86, 1767–1774 CrossRef PubMed.
- A. Gomtsyan, E. K. Bayburt, R. G. Schmidt, G. Z. Zheng, R. J. Perner, S. Didomenico, J. R. Koenig, S. Turner, T. Jinkerson, I. Drizin, S. M. Hannick, B. S. Macri, H. A. McDonald, P. Honore, C. T. Wismer, K. C. Marsh, J. Wetter, K. D. Stewart, T. Oie, M. F. Jarvis, C. S. Surowy, C. R. Faltynek and C.-H. Lee, J. Med. Chem., 2005, 48, 744–752 CrossRef CAS PubMed.
- M. Brorson, M. R. Dyxenburg, F. Galsbol and K. Simonsen, Acta Chem. Scand., 1996, 50, 289–293 CrossRef CAS PubMed.
- J. N. Cohn, G. Johnson, S. Ziesche, F. Cobb, G. Francis, F. Tristani, R. Smith, W. B. Dunkman, H. Loeb, M. L. Wong, G. Bhat, S. Goldman, R. D. Fletcher, J. Doherty, C. V. Hughes, P. Carson, G. Cintron, R. Shabetai and C. Haakenson, N. Engl. J. Med., 1991, 325, 303–310 CrossRef CAS PubMed.
Footnote |
| † Electronic supplementary information (ESI) available: Synthesis, Characterisation, kinetic and hyperpolarisation data with the kinetic model is available here. See DOI: 10.1039/c5sc00756a |
| This journal is © The Royal Society of Chemistry 2015 |


