
Graphene/polyurethane composites: fabrication and evaluation of electrical conductivity, mechanical properties and cell viability
Gagan Kaur *a,
Raju Adhikaria,
Peter Cassa,
Mark Bowna,
Margaret D. M. Evansb,
Aditya V. Vashia and
Pathiraja Gunatillake*a
*a,
Raju Adhikaria,
Peter Cassa,
Mark Bowna,
Margaret D. M. Evansb,
Aditya V. Vashia and
Pathiraja Gunatillake*a
aCSIRO Manufacturing, Bayview Avenue, Clayton, VIC 3168, Australia. E-mail: Thilak.Gunatillake@csiro.au; Gagan.Kaur@csiro.au
bCSIRO Manufacturing, Julius Avenue, North Ryde, NSW, 2113 Australia
First published on 12th November 2015
Abstract
Recently conducting and electroactive polymers have received the attention of researchers to explore their potential in biomedical applications. Polyurethanes (PUs) are of particular interest to make conductive polymer composites by the incorporation of conductive particles because of their inherent biocompatibility, biostability, excellent processability and good mechanical properties. In the present work, conductive composites of graphene and a siloxane polyurethane (Elast-Eon™) were prepared. The graphene/Elast-Eon™ composites were prepared using different methods i.e. solution mixing, melt processing and in situ polymerisation in order to compare the effect of the processing method on the conductivity of resulting composites. The composites were prepared with varying content of graphene and the electrical conductivity of the resulting composites was determined using a two point probe method. In order to improve the conductivity, effect of cooling rate during compression moulding as well as annealing of composite films was examined. Both of these approaches were found to significantly improve the conductivity of composites with lower graphene content (≤5 wt%). A conductivity of 1.12 × 10⁻³ S cm−1 was achieved with 5 wt% loading of graphene and a maximum conductivity of 5.96 × 10⁻² S cm−1 was achieved with 15 wt% of graphene content. The composites were further characterised using scanning electron microscopy (SEM), differential scanning calorimetry (DSC), thermogravimetric analysis (TGA), and tensile testing methods. The tensile and TGA results showed that the composites have good mechanical properties and showed that composites retain the thermal properties of parent PU material. Furthermore, the cytotoxicity assay tests found that composites were not cytotoxic to living cells in vitro and potentially useful in biomedical applications.
1. Introduction
Electrically conductive polymeric materials have recently attracted considerable interest for their potential biomedical applications such as biosensors, drug delivery systems, biomedical implants, and tissue engineering.1 Conventional conductive homopolymers such as polypyrrole and poly(3,4-ethylenedioxythiophene) (PEDOT) show promising conductivity for these applications, however their mechanical properties, biocompatibility and processability are often poor.2–5 The development of composites of conducting polymers with conducting nanoparticles along with non-conducting polymers to improve mechanical performance and biocompatibility has been one of the recent approaches in attempting to overcome some of these limitations.6 This has also led to more recent attention being directed towards conductive polymeric composites comprised of biostable/biocompatible polymers with dispersed conductive fillers such as graphene, carbon nanotubes, and metallic nanoparticles.Polyurethanes (PUs) are of particular interest to make conducting polymer composites by way of incorporating conductive particles because of their biocompatibility, biostability, processability and good mechanical properties.7,8 Polyurethanes have found applications in numerous medical devices, including vascular grafts and pacemaker lead insulators.7,9–13 Electrical conductivity can be imparted to insulating polymers by the incorporation of conductive fillers while still maintaining their polymeric characteristics.14 Carbon black, carbon fibre, silver, and other metallic particles have often been used as fillers. Recently, nanosized conductive fillers including carbon nanotubes, graphene, and metal nanoparticles have generated a considerable interest and have been explored extensively in the development of polymer based conductive composites.15–24 Graphene is a two dimensional monolayer of sp2-hybridized carbon arranged in honeycomb lattice and exhibits high mechanical strength, electrical conductivity, and ultra-high specific surface area.25 Graphene based polymer composites have been shown to have good mechanical, thermal and electrical properties.21,26
In the literature, quite a handful of reports can be found on composites of graphene and polyurethane.27–29 Kim and co-workers27 reported the preparation and conductivity of graphene reinforced polymeric composites from water-based colloidal dispersions of graphene oxide and polyurethane latex but did not investigate mechanical and thermal properties of these materials. Choi and co-workers28 examined the role of graphene as reinforcing filler in shape memory polyurethane nanocomposites, however the ultimate tensile strength and elongation (at break) of the resulting materials were not reported. Cho and co-workers29 also reported the preparation of caprolactone based polyurethanes containing graphene, although these composites exhibited good conductivity, their low melting point (36.3 °C) could limit their applications such as in implantable biomedical devices. In summary, while composites of graphene and polyurethane have been reported previously, the main focus of these studies was on their conductivity and shape memory properties rather than a wider exploration of properties relevant to biomedical applications. None of the materials reported in above mentioned reports has been shown to have good electrical conductivity along with good thermal stability, reasonable mechanical strength and biocompatibility. Moreover, siloxane based polyurethanes have never been used before for making conductive materials to the best of authors' knowledge. Polyurethanes containing high silicone content are well known for their long term biostability, thermal stability, excellent mechanical properties and processing versatility.30–32
Herein, we present for the first time in this report, the preparation of conductive composites of a siloxane polyurethane and graphene for potential use in biomedical applications. We have chosen a siloxane based polyurethane, Elast-Eon™, to prepare conductive composites because the biostability of Elast-Eon™ is well established and it has already been used in implant devices.33 We have prepared composites of Elast-Eon™ incorporating varied graphene contents and their electrical conductivity was determined. Importantly, the mechanical and thermal properties of graphene/Elast-Eon™ composites were also examined using a combination of tensile testing, differential scanning calorimetry (DSC) and thermogravimetric analysis (TGA). The composites were further characterised using scanning electron microscopy (SEM) and their cytotoxicity was examined using indirect cytotoxicity test.
2. Experimental
2.1 Materials
The thermoplastic polyurethane Elast-Eon™ (E2A) was obtained from Aortech Biomaterials, and was dried under vacuum (10 mbar) at 60 °C for 24 h before use to remove any moisture. Graphene (ACS Materials, Single Layer Graphene) was used as received. The α,ω-bis(6-hydroxyethoxypropyl) poly(dimethylsiloxane) (PDMS) (Shin Etsu, Product X-22-160AS), was dried at 105 °C under a vacuum (10 mbar) for 15 h to remove any volatile impurities. The 4,4′-methylenediphenyl diisocyanate (MDI) (Huntsman, SUPRASEC® Grade), and 1,4-butanediol (BDO) (Sigma Aldrich) were used as received. The poly(hexamethyleneoxide) (PHMO) was synthesized by acid-catalyzed condensation polymerization as reported previously.34 The PHMO was dried at 130 °C under vacuum (10 mbar) for 4 h to remove any volatile impurities.2.2 Preparation of graphene/Elast-Eon™ composite films
2.3 Measurement of conductivity
A ∼100 μm thick graphene/Elast-Eon™ composite film was placed on a Corning XG glass substrate (25.0 × 25.0 × 1.1 cm) and was then transferred to a vacuum evaporator (EvoVac vacuum deposition system by Angstrom Engineering) with integrated nitrogen filled glove box. The deposition of Ag electrodes was performed through a shadow mask. Deposition control was accomplished through the Sigma SQS-242 deposition software. Ag is thermally evaporated from open tungsten boat at a rate of 3.5 Å s−1 and at pressures less than 2 × 10⁻⁶ torr, until a final electrode thickness of 1000 Å is reached. After the electrode deposition, d.c. resistance measurements of the composites were carried out in two-probe configuration using a Keithley 2400 SourceMeter unit by driving current and measuring the voltage. Surface electrical conductivity was calculated using the method as described below:The resistivity ρ, in Ω cm, was calculated, using equation:

The conductivity values are reported as the average of three replicates.
2.4 X-ray photoelectron spectroscopy (XPS) analysis
XPS analysis was performed using an AXIS Ultra DLD spectrometer (Kratos Analytical Inc., Manchester, UK) with a monochromated Al Kα source at a power of 150 W (15 kV × 12 mA), a hemispherical analyser operating in the fixed analyser transmission mode and the standard aperture (analysis area: 0.3 mm × 0.7 mm). The total pressure in the main vacuum chamber during analysis was typically between 10−9 and 10−8 mbar. Survey spectra were acquired at a pass energy of 160 eV. To obtain more detailed information about chemical structure, oxidation states etc., high resolution spectra were recorded from individual peaks at 20 eV pass energy (yielding a typical peak width for polymers of <1.0 eV). Samples were filled into shallow wells of a custom-built sample holder. Samples were analysed at a nominal photoelectron emission angle of 0° w.r.t. the surface normal. Since the actual emission angle is ill-defined in the case of particles (ranging from 0° to 90°) the sampling depth may range from 0 nm to approx. 10 nm. Data processing was performed using CasaXPS processing software version 2.3.15 (Casa Software Ltd., Teignmouth, UK). All elements present were identified from survey spectra. The atomic concentrations of the detected elements were calculated using integral peak intensities and the sensitivity factors supplied by the manufacturer. The accuracy associated with quantitative XPS is ca. 10–15%.2.5 Scanning electron microscopy (SEM)
The SEM images of composites and polyurethane films were taken using a ZEISS MERLIN Ultra High Resolution field emission SEM (FE-SEM) instrument operated at an accelerating voltage of 5–20 kV. For surface morphology, the 100 μm thick composite films were coated with a ∼200 Å thick iridium coating prior to analysis. For cross-sectional analysis, the cryogenically fractured samples were etched in potassium hydroxide/ethanol solution (20 wt% of KOH) for 1 min. The etched samples were thoroughly washed with deionised water, air-dried and then coated with ∼200 Å thick iridium prior to analysis. For SEM analysis of graphene, it was dispersed in acetone (0.5 mg in 1 mL) and a drop of this dispersion was put on a specimen stub. The sample was air dried before analysis and was used without any coating.2.6 Optical microscopy
The composite films with thickness of 100 μm were mounted on glass slides for optical microscopy. The images were taken on a Nikon Labophot – 2 optical microscope equipped with InfinityX camera and Infinity Capture software.2.7 X-ray diffraction (XRD) analysis
A Bruker D8 Advance X-ray Diffractometer using Cu Kα radiation (40 kV, 40 mA) equipped with a Lynx Eye silicon strip detector was employed to obtain the XRD patterns of composite films. The samples (thickness of ∼400 μm) were scanned over the 2θ range 5° to 40° with a step size of 0.02° 2θ and a count time of 0.4 seconds per step. The Lynx Eye detector comprises 185 sensor strips; the equivalent count time using a conventional single channel detector would be 71.6 seconds per step. Analyses were performed on the collected XRD data using the Bruker XRD search match program EVA™. Crystalline phases were identified using the ICDD-PDF4+ 2010 powder diffraction database.2.8 Tensile testing
A standard test method, ASTM D882, for tensile properties of thin plastic sheeting was used for tensile testing of composites. Hot-pressed composite samples having 0.3–0.5 mm thickness were used for tensile testing. The samples were cut into dumbbell-shaped specimens of 3 cm length and 1 cm width. The narrow section of the specimens was 1.2 cm in length and 0.4 cm in width. The dumbbells were stored under ambient conditions for 4 weeks before tensile tests were carried out. Tensile testing was carried out with an Instron 5565 Testing Machine. A 1 kN load cell was used and the crosshead speed was 10 mm min−1. The results reported are the mean values for six replicates. The same procedure was also used for the neat Elast-Eon™ specimens, which were used as a control.2.9 Differential scanning calorimetry (DSC)
The samples were dried at 70 °C for 48 h under a vacuum to remove moisture prior to recording the thermograms. This treatment also removed the thermal history of polymers. Analyses were conducted on a Mettler Toledo DSC 821, using samples (∼5 mg) that were encapsulated in lightweight aluminium pans. The module was calibrated using the indium/zinc total method. The samples were heated from −50 °C to 280 °C at a rate of 10 °C min−1 under a nitrogen purge of 30 mL min−1. Tg values were determined using the STARe software from temperature verses heat flow plots.2.10 Thermogravimetric analysis (TGA)
A Mettler Toledo TGA/SDTA 851 thermogravimetric analyzer and STARe software were used to measure the changes in weight of the materials as a function of temperature.Samples of the materials (1–10 mg) were accurately weighed into alumina crucibles (70 μL) without a lid. All of the analyses were performed over a temperature range of 30–600 °C at heating rate of 10 °C min−1 in N2 (flow rate: 30 mL min−1).
2.11 Assessment of the in vitro cytotoxicity
3. Results and discussion
3.1 Electrical conductivity
 | ||
| Fig. 1 Preparation of graphene/Elast-Eon™ composites using melt mixing (a), solution mixing (b) and in situ polymerisation (c). | ||
For solution mixing method, THF was used as solvent for dispersing graphene as well as for solubilising the polymer. In the melt mixing method, a mixture of graphene and Elast-Eon™ was melt compounded at 190 °C and extruded as a solid tube. The in situ polyurethane synthesis was carried out using two-step polymerisation, to prepare a siloxane polyurethane with composition similar to Elast-Eon™, using the method described previously.32 The in situ method provided powdery composites for a graphene loading of >3 wt% which resulted in mechanically fragile films. Therefore, the loading of graphene was kept at 3 wt% for comparison between methods. Each of the composite samples was compression moulded to obtain ∼100 μm thick films and conductivity of the composites was determined using a two-point probe method. Ag electrodes were deposited on the composite films in order to facilitate electrical contact.
The graphene/Elast-Eon™ composites with 3 wt% loading were found to be largely insulating. The conductivity of composites obtained by the solution mixing method was 5 × 10⁻⁹ S cm−1 and of those obtained by the in situ method was 1.7 × 10⁻⁹ S cm−1. In spite of very low conductivity of the composites, the loading of graphene in these composites was enough to achieve the formation of some conductive pathways above the percolation threshold. Although the in situ method was unsuitable for preparation of composites with higher graphene loadings (>3 wt%) due to poor mechanical strength of resulting composites, however, it provided a composite with conductivity comparable to solution mixing method. On the other hand, the conductivity of the composites obtained by melt mixing method was too low to be determined. The lower conductivity from melt mixing method is most likely the result of uneven or incomplete mixing of graphene with PU matrix due to high viscosity of molten PU as well as large surface area of graphene sheets. The formation of conductive networks was not achieved due to insufficient mixing and as a result, the material obtained had very low conductivity. From these results, it was concluded that solution mixing method is most promising to obtain the graphene/Elast-Eon™ composites as it provided optimum mixing of filler in polymer composites without compromising the mechanical properties to a great extent and was found to be suitable for making composites with graphene loadings of up to 15 wt%. Similar conclusions were also drawn in literature reports comparing solution mixing method to melt compounding for other polymeric composites containing carbon based fillers.38–40
Based on above results, the rest of the studies were carried out on the graphene/Elast-Eon™ composites prepared by solution mixing method.
It was found that the rate of cooling of the compression moulding had a significant effect on the conductivity of the resulting composite films. To examine this effect, the composites were compression moulded at 200 °C and were cooled at two different rates, 20 °C min−1 (fast cooling) and 1 °C min−1 (slow cooling). Fig. 2 presents the results of electrical conductivity measurements, plotted as a function of graphene content for both cooling rates.
 | ||
Fig. 2 (a) Conductivity of graphene/Elast-Eon™ composites as a function of graphene content. (b) log![[thin space (1/6-em)]](https://www.rsc.org/images/entities/char_2009.gif) σ plotted against log(ρ − ρc) where ρc is the percolation threshold (slow cooling). σ plotted against log(ρ − ρc) where ρc is the percolation threshold (slow cooling). | ||
A rapid increase in the electrical conductivity of composite materials takes place when the conductive filler forms an infinite network of connected paths through the insulating matrix. When the filler particles are rigid bodies, the conductivity of such media is typically described with a bond percolation model.42 The conductivity of the composite, σc, above the percolation threshold is then calculated using power law equation:42
| σc = σf[(ρ − ρc)/(1 − ρc)]t |
A low percolation threshold is desirable which is dependent on aspect ratio of the conductive filler and its homogeneous dispersion in the composites. The percolation threshold will vary depending on how well the conductive filler is dispersed in the polymer matrix. If the conductive filler particles within a composite are concentrated in dense primary agglomerates, the electrical percolation threshold is increased.43
As expected, the conductivity of the composites was found to increase with an increase in the content of graphene. The electrical conductivity increased exponentially at low graphene content, followed by a slower growth at high content. The composites with a lower loading of graphene (<3 wt%) were found to be insulators. Percolation threshold is reached in graphene/Elast-Eon™ composites when the filler concentration, ρc, reaches approximately ∼2.9 wt% and ∼2.5 wt% for rapidly cooled and slowly cooled samples, respectively. The percolation threshold for slowly cooled samples was lower when compared to samples cooled at a higher rate. These results showed that slow cooling helps in improved alignment/reorganisation of filler particles in the polymer matrix. However, the percolation threshold of graphene/Elast-Eon™ composites is higher when compared to similar polymeric composites reported in the literature.26,44 This difference could be attributed to the graphene agglomerates formed by physical entanglements and van der Waals forces between sheets.44
The composites prepared at slow cooling rate showed an overall better conductivity for graphene loadings of <10% than the samples prepared at a much faster cooling rate. While the difference in conductivity was more pronounced for samples with lower graphene content, there was no significant difference observed for samples with higher graphene content.
For the slowly cooled samples, there was a sharp increase in conductivity with an increase in loading from 2% to 5%, with conductivity rising from 2.25 × 10⁻⁸ S cm−1 to 1.12 × 10⁻³ S cm−1 respectively. An increase in the loading of graphene above 5 wt% yielded a more gradual increase in electrical conductivity, with values of, 5.18 × 10⁻³ S cm−1 at 7.5 wt% and 3.68 × 10⁻² S cm−1 at 15 wt% loading of graphene. For rapidly cooled samples, the trend in conductivity with respect to loading was similar with a sharp increase in conductivity from 5.04 × 10⁻⁹ S cm−1 to 1.23 × 10⁻⁴ S cm−1 with an increase in loading from 3% to 5% respectively. An increase in the loading of graphene above 5 wt% resulted in a slower increase in electrical conductivity with maximum conductivity of 5.96 × 10⁻² S cm−1 achieved at 15 wt% of graphene content. The composites with a graphene loading of greater than 15 wt% were powdery and resulted in very fragile films. These results clearly showed that the slow cooling rate during compression moulding can enhance the formation of conduction network of filler particles in the polymer matrix, resulting in improved conductivity and lower percolation threshold. Furthermore slow cooling is most likely to favour the secondary agglomeration of filler particles which is also reported to enhance the electrical conductivity due to strengthening of the conductive pathways.45
Furthermore, there was only a minor improvement (∼0–2 folds) observed upon annealing in the conductivity of composite films with low graphene content (<5 wt%) prepared using slow cooling rate during compression moulding. The most likely reason for small improvement in conductivity of these composite films is that slow cooling during compression moulding had already enhanced the formation of macroscopic conductive pathways via reaggregation of graphene sheets.
The graphene/Elast-Eon™ composites with 5 wt% graphene content were further characterised for their morphology, mechanical properties, thermal properties and cytotoxicity, as discussed in the following sections.
3.2 Morphology of composites
The morphology of the graphene/Elast-Eon™ composites (with 5 wt% loading of graphene) was analysed using optical microscopy and FE-SEM. The pristine graphene was also characterised using XPS and FE-SEM. The XPS analysis (Fig. 3a) showed characteristic peak of graphene at 284.4 eV with a tail at higher binding energies (∼>290 eV) which is also characteristic of graphitic carbon such as graphene. A shoulder at ∼286 eV was also present indicating the presence of some C–O groups. The SEM image of pristine graphene showed that the graphene particles was found to be 4–6 μm and were present as aggregates (Fig. 3b). The SEM images also showed that the graphene particles were composed of at least few layers of graphene sheets (Fig. 3c). | ||
| Fig. 3 (a) XPS plot of graphene (b and c) FE-SEM image of graphene (d) optical microscope image of graphene/Elast-Eon™ composite film (e) FE-SEM image of graphene/Elast-Eon™ composite film (f) FE-SEM image of annealed composite film (g and j) cross-sectional FE-SEM image of etched neat Elast-Eon™ (h and k) cross-sectional FE-SEM image of etched graphene/Elast-Eon™ composite film (i and l) cross-sectional FE-SEM image of annealed graphene/Elast-Eon™ composite film after etching. The arrows indicate graphene embedded in the polymer matrix. | ||
The optical microscope images (Fig. 3d) showed a uniform distribution of graphene particles. In the FE-SEM images of the surface of graphene/Elast-Eon™ (Fig. 3e), the graphene sheets were seen to be embedded throughout the polymer matrix and the size of graphene particles was found to be 1–3 μm. The morphology of the annealed composite films was also examined. The SEM image of the annealed composite (Fig. 3f) showed the ‘sinking’ of graphene sheets in the polymer matrix which could be due to relaxation of polymer chains. This further resulted in improved conductivity possibly as a result of enhancement of alignment of graphene sheets in the polymer matrix.
The cross-sectional FE-SEM images of cryogenically fractured graphene/Elast-Eon™ are shown in Fig. 3g–l. The fractured composite films were etched using KOH/ethanol prior to SEM imaging in order to improve the contrast between graphene and polymer matrix. The fractured surface of neat Elast-Eon™ was observed to be relatively smooth (Fig. 3g and j) and it became rough in the presence of graphene sheets (Fig. 3h and k). There was no noticeable change observed in the morphology of the annealed composite films (Fig. 3i and l). The cross-sectional FE-SEM images also showed that graphene was well incorporated in the polymer matrix (Fig. 3k and l). These results of optical microscopy and FE-SEM show that the graphene sheets are finely dispersed in the PU matrix.
The structural characterization of the graphene/Elast-Eon™ composites was also carried out by XRD and the plots are shown in Fig. 4. The XRD pattern of neat Elast-Eon™ showed the amorphous nature of the polymer with two broad peaks (2θ ∼ 10° and 20°). The peak corresponding to graphene (i.e. the characteristic 002 plane of graphene) has been reported to appear between 2θ values of 23° and 26° (d-spacing = 3.42–3.86 Å).48–50 For the graphene/Elast-Eon™ composites, the diffraction peak appeared at 22.5° with a d-spacing of 3.94 Å. The increased d-spacing of graphene/Elast-Eon™ composites could be attributed to the polyurethane particles entering into the network of graphene sheets during composite preparation.
 | ||
| Fig. 4 XRD plots of graphene/Elast-Eon™ composite and neat Elast-Eon™. | ||
3.3 Mechanical properties of composites
The mechanical properties of graphene/Elast-Eon™ composites with 5 wt% graphene content were characterised by tensile testing. The tensile testing results showed that the graphene/Elast-Eon™ composites possess fairly good mechanical properties when compared to similar composites reported in literature.27–29,51 The tensile testing data of the composites is shown in Fig. 5 and their mechanical properties are summarised in Table 1. | ||
| Fig. 5 Tensile testing curves of neat Elast-Eon™ and graphene/Elast-Eon™ composite films (with 5 wt% loading of graphene). | ||
Both the elasticity and tensile strength of the graphene/Elast-Eon™ composites was found to be significantly less than that of the parent material, Elast-Eon™. The graphene/Elast-Eon™ composites showed the tensile strength of about 11 MPa, 66% less than that of the parent material Elast-Eon™. The lower tensile strength and elasticity is most likely due to graphene discretely mixing in the two phase morphology of Elast-Eon™ and could also be attributed to the micron size of graphene sheets. The modulus of the composites increased to 48 MPa as expected due to graphene sheets working as fillers. Although the graphene/Elast-Eon™ composites showed a significant loss of elastomeric properties compared to parent material, but they still retained fairly good mechanical strength and moderate elasticity.
3.4 Thermal analyses of composites
The thermal stability of the graphene/Elast-Eon™ composites was examined by differential scanning calorimetry (DSC) and thermogravimetric analysis (TGA).The DSC plots of neat Elast-Eon™ and graphene/Elast-Eon™ composites with different loading of graphene are presented in Fig. 6. There were no significant differences seen in the DSC plots of composites upon addition of graphene to Elast-Eon™ (Fig. 6a–e). However, the composites were seen to become more phase mixed and homogenous with increasing content of graphene. The results indicated that graphene sheets mixed well in the polymer matrix. For the annealed composites (with graphene content of 5 wt%), a phase transition was observed in temperature range of 120–130 °C (Fig. 6f). This could have been most likely arisen due to a reorganisation (such as re-orientation of graphene sheets) of material structure.
 | ||
| Fig. 6 DSC plots of (a) neat Elast-Eon™ (b–e) graphene/Elast-Eon™ composites with loadings (wt%) of 1%, 5%, 10% and 15% respectively (f) annealed graphene/Elast-Eon™ composite with 5 wt% loading. | ||
Fig. 7 presents the TGA plots of the parent material Elast-Eon™ compared to the composites containing 5 wt% graphene. These result showed that the composite retained the thermal stability of parent PU material up to 250 °C. Similar observations were also obtained for the annealed composites (Fig. 7). It can be concluded from these results that addition of graphene (5 wt%) does not affect the thermal stability of resulting composite.
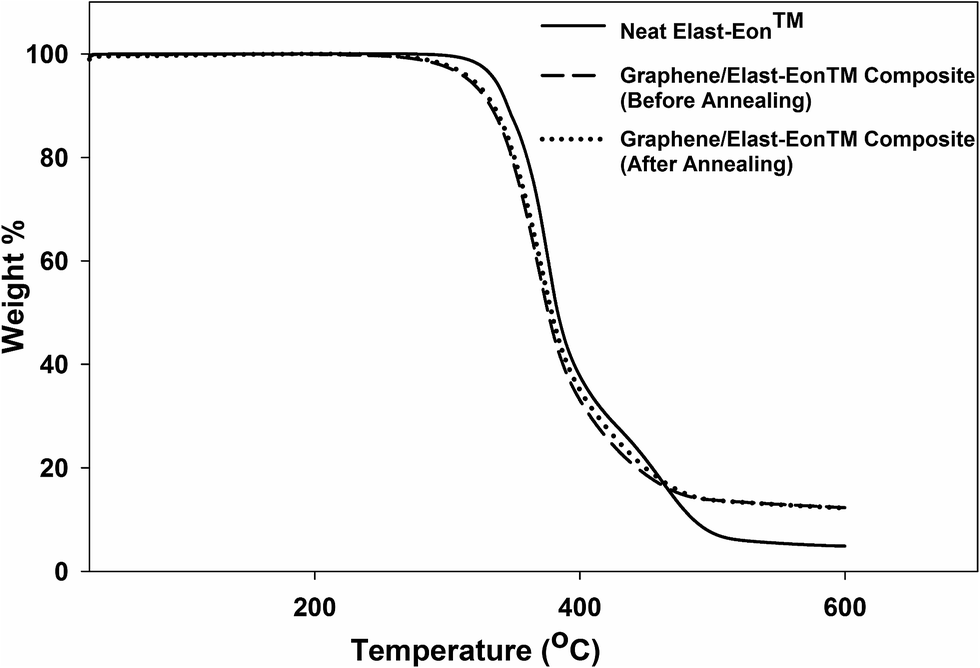 | ||
| Fig. 7 TGA plots of graphene/Elast-Eon™ composite (with 5 wt% loading of graphene) and neat Elast-Eon™. | ||
3.5 Cytotoxicity of graphene/Elast-Eon™ composites
The in vitro cytotoxicity of graphene/Elast-Eon™ (with graphene content of 5 wt%) composite films was tested using an indirect cytotoxicity assay. The samples were placed in the culture medium at 37 °C for 72 hours and extracted medium was collected from each of the samples. The extracts were prepared in a dilution series and were placed onto L929 cells pre-seeded into a culture plate. The viability of cells in wells of each polymer treatment was quantified after 24 hours using MTT assay. An outcome from MTT assay which resulted in a reduction in cell viability of greater than 30% was deemed to be cytotoxic. The graphene/Elast-Eon™ composite films did not show significant cytotoxicity in these tests (Fig. 8) which showed that no toxic leachables were released from the films.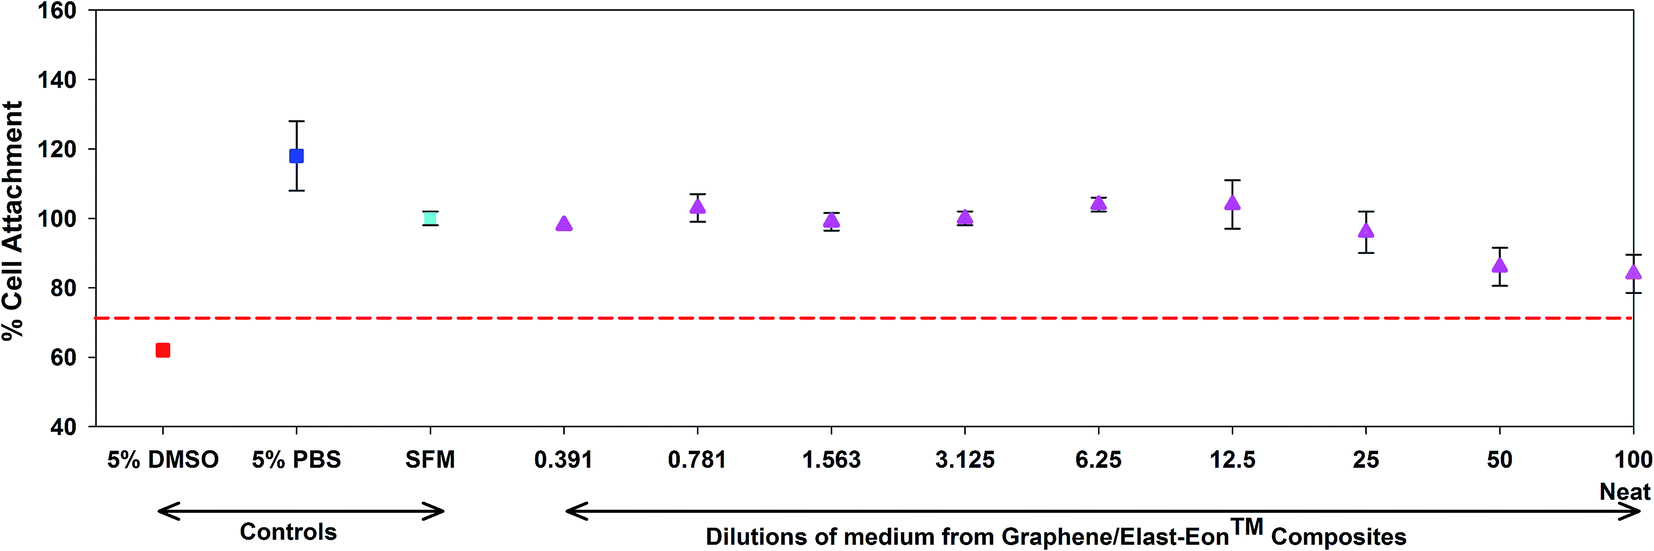 | ||
| Fig. 8 Viability of cells in dilutions of medium from 5% graphene/Elast-Eon™ composite films (cell viability of 70% is marked by red dashed line and anything less than this is regarded to be cytotoxic). Cell culture controls included cells seeded into uncoated wells in serum free medium (SFM), 5% PBS in SFM and 5% DMSO in SFM (control cell-killer). | ||
Following indirect cytotoxicity tests, cell viability assay was used to examine the cell adhesion on the surface of graphene/Elast-Eon™ composite films. In these tests, the L929 cells were directly seeded on to the surface of composite films placed in cell culture medium. The neat Elast-Eon™ and TCP were used as control samples. These results showed some cell adhesion on neat Elast-Eon™ surface, however, the cell adhesion on the surface of graphene/Elast-Eon™ composite (5 wt%) was relatively poor (Fig. 9). Only a few viable cells were observed on the composite surface after 24 h (Fig. 9c). The poor cell attachment on the surface of composites could possibly be due to either the change in surface roughness or hydrophobicity upon addition of graphene to the polymer matrix.52–55 However, despite the poor adhesion, most of the seeded cells migrated to TCP surface underneath and these cells were found viable showing characteristic spread morphology of fibroblasts (Fig. 9d). This suggested that even though the composite surface was not ideal for cell adhesion, the graphene/Elast-Eon™ composite surface did not create any cytotoxic effects, confirming the results obtained from indirect cytotoxicity tests.
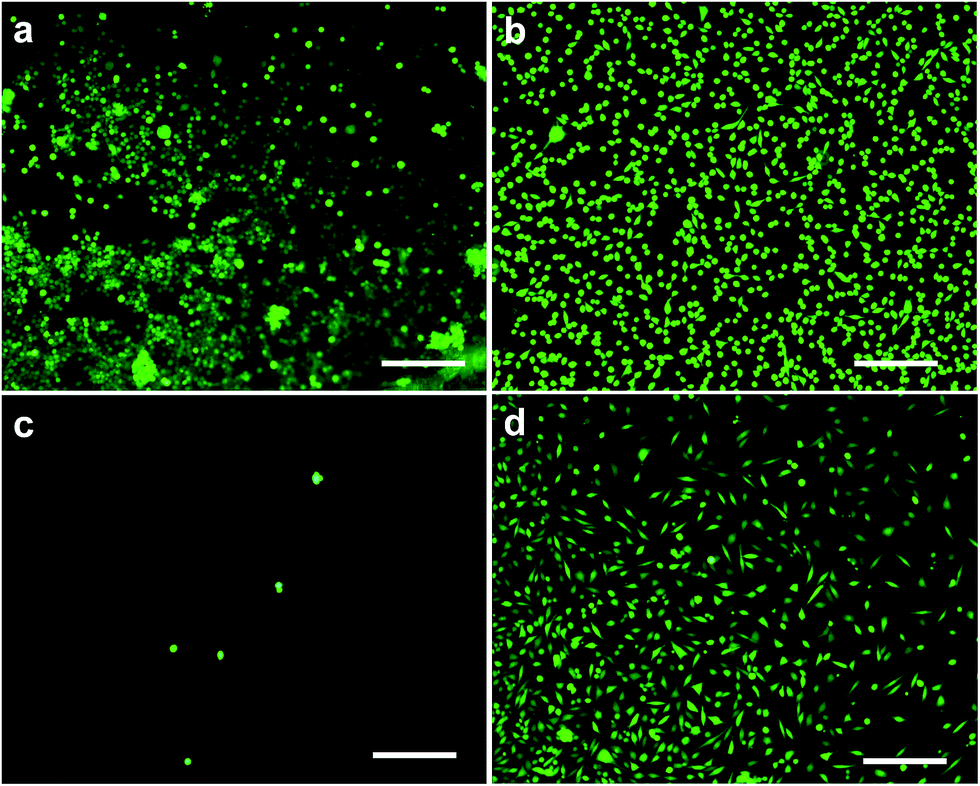 | ||
| Fig. 9 Live–dead viability test results for graphene/Elast-Eon™ composite. The live cells are stained green. (a) Cells on the surface of neat Elast-Eon™ (b) cells on the surface of tissue culture plastic (control) (c) cells on the surface of graphene/Elast-Eon™ composite (5 wt%) (d) cells that did not adhere to graphene/Elast-Eon™ composite (5 wt%) and migrated to TCP surface underneath. Bars = 100 μm. | ||
4. Conclusions
Conductive composites of graphene and a siloxane polyurethane (Elast-Eon™) were prepared using different methods i.e. solution mixing, melt processing and in situ method. The solution mixing method was found to be best because it resulted in the composites with higher electrical conductivity and it was suitable for preparing composites with better mechanical properties. The composites were prepared with varying content of graphene and the electrical conductivity of the resulting composites was determined using a two point probe method. For composites prepared using the solution mixing method, a conductivity of 1.12 × 10⁻³ S cm−1 was achieved with 5 wt% loading of graphene and a maximum conductivity of 5.96 × 10⁻² S cm−1 was obtained for composites with graphene content of 15 wt%. In attempts to improve the conductivity of composite films, effect of cooling rate during compression moulding as well as annealing of composite films was examined. Both of these approaches were found to significantly improve the conductivity of composites with lower graphene content (≤5 wt%). The composites (with loading of graphene ≤5 wt%) prepared at a slow cooling rate during compression moulding were found to have a higher overall conductivity compared to those prepared using a faster cooling rate. Furthermore, the composites (with 5 wt% loading of graphene) retained thermal stability of the host polymer up to ∼250 °C and, also exhibited fairly good mechanical properties when compared to the neat Elast-Eon™. In addition, cell-based cytotoxicity tests showed that composites were not cytotoxic. The results were promising with room for improvement and for development of materials potentially suitable for biomedical applications. Further studies might also focus on the further investigation of effect of graphene attributes on the conductivity and mechanical properties of the polyurethane composites.Acknowledgements
The authors would like to acknowledge the financial support provided by CSIRO Office of Chief Executive Postdoctoral Program. The authors would also like to acknowledge Dr Ajay Padsalgikar of St Jude Medical for providing Elast-Eon™ samples, Mark Greaves for his help in SEM and Sumeet Bal for his assistance in cell studies. The authors also acknowledge Dr Christopher Easton for his help in XPS analysis and Dr Gavin Collis for his advice and fruitful discussions.References
- J. Jagur-Grodzinski, e-Polymers, 2012, 12, 722–740 CrossRef.
- N. K. Guimard, N. Gomez and C. E. Schmidt, Prog. Polym. Sci., 2007, 32, 876–921 CrossRef CAS.
- B. Guo, L. Glavas and A. C. Albertsson, Prog. Polym. Sci., 2013, 38, 1263–1286 CrossRef CAS.
- R. Balint, N. J. Cassidy and S. H. Cartmell, Acta Biomater., 2014, 10, 2341–2353 CrossRef CAS PubMed.
- Z.-B. Huang, G.-F. Yin, X.-M. Liao and J.-W. Gu, Front. Mater. Sci., 2014, 8, 39–45 CrossRef.
- G. Kaur, R. Adhikari, P. Cass, M. Bown and P. Gunatillake, RSC Adv., 2015, 5, 37553–37567 RSC.
- S. Gogolewski, Colloid Polym. Sci., 1989, 267, 757–785 CAS.
- M. S. Kathalewar, P. B. Joshi, A. S. Sabnis and V. C. Malshe, RSC Adv., 2013, 3, 4110–4129 RSC.
- A. Silvestri, P. M. Serafini, S. Sartori, P. Ferrando, F. Boccafoschi, S. Milione, L. Conzatti and G. Ciardelli, J. Appl. Polym. Sci., 2011, 122, 3661–3671 CrossRef CAS.
- L. Xue and H. P. Greisler, J. Vasc. Surg., 2003, 37, 472–480 CrossRef PubMed.
- A. Rahimi and A. Mashak, Plast., Rubber Compos., 2013, 42, 223–230 CrossRef CAS.
- T. Gurunathan, C. R. K. Rao, R. Narayan and K. V. S. N. Raju, J. Mater. Sci., 2013, 48, 67–80 CrossRef CAS.
- C. M. Williams, M. A. Nash and L. A. Poole-Warren, Progress in Biomedical Optics and Imaging, Proc. SPIE, 2005, 5651, 329–335 CrossRef CAS.
- D. Untereker, S. Lyu, J. Schley, G. Martinez and L. Lohstreter, ACS Appl. Mater. Interfaces, 2009, 1, 97–101 CAS.
- F. Du, R. C. Scogna, W. Zhou, S. Brand, J. E. Fischer and K. I. Winey, Macromolecules, 2004, 37, 9048–9055 CrossRef CAS.
- A. Nogales, G. Broza, Z. Roslaniec, K. Schulte, I. Šics, B. S. Hsiao, A. Sanz, M. C. García-Gutiérrez, D. R. Rueda, C. Domingo and T. A. Ezquerra, Macromolecules, 2004, 37, 7669–7672 CrossRef CAS.
- K. I. Winey, T. Kashiwagi and M. Mu, MRS Bull., 2007, 32, 348–353 CrossRef CAS.
- M. Antunes and J. I. Velasco, Prog. Polym. Sci., 2014, 39, 486–509 CrossRef CAS.
- H. Bai, C. Li and G. Shi, Adv. Mater., 2011, 23, 1089–1115 CrossRef CAS PubMed.
- T. K. Das and S. Prusty, Polym.-Plast. Technol. Eng., 2013, 52, 319–331 CrossRef CAS.
- N. Grossiord, M.-C. Hermant and E. Tkalya, in Polymer-Graphene Nanocomposites, The Royal Society of Chemistry, 2012, pp. 66–85 Search PubMed.
- T. Kuilla, S. Bhadra, D. Yao, N. H. Kim, S. Bose and J. H. Lee, Prog. Polym. Sci., 2010, 35, 1350–1375 CrossRef CAS.
- X. Cheng, C. Li, L. Rao, H. Zhou, T. Li and Y. Duan, J. Wuhan Univ. Technol., Mater. Sci. Ed., 2012, 27, 1053–1057 CrossRef CAS.
- J. Stejskal, Chem. Pap., 2013, 67, 814–848 CAS.
- X. Sun, H. Sun, H. Li and H. Peng, Adv. Mater., 2013, 25, 5153–5176 CrossRef CAS PubMed.
- S. Stankovich, D. A. Dikin, G. H. B. Dommett, K. M. Kohlhaas, E. J. Zimney, E. A. Stach, R. D. Piner, S. T. Nguyen and R. S. Ruoff, Nature, 2006, 442, 282–286 CrossRef CAS PubMed.
- N. Yousefi, M. M. Gudarzi, Q. B. Zheng, S. H. Aboutalebi, F. Sharif and J. K. Kim, J. Mater. Chem., 2012, 22, 12709–12717 RSC.
- J. T. Choi, T. D. Dao, K. M. Oh, H. I. Lee, H. M. Jeong and B. K. Kim, Smart Mater. Struct., 2012, 21, 9 Search PubMed.
- S. Rana, J. W. Cho and L. P. Tan, RSC Adv., 2013, 3, 13796–13803 RSC.
- D. J. Martin, L. A. Poole Warren, P. A. Gunatillake, S. J. McCarthy, G. F. Meijs and K. Schindhelm, Biomaterials, 2000, 21, 1021–1029 CrossRef CAS PubMed.
- P. A. Gunatillake, D. J. Martin, G. F. Meijs, S. J. McCarthy and R. Adhikari, Aust. J. Chem., 2003, 56, 545–557 CrossRef CAS.
- P. A. Gunatillake, G. F. Meijs, S. J. McCarthy and R. Adhikari, J. Appl. Polym. Sci., 2000, 76, 2026–2040 CrossRef CAS.
- A. Simmons, J. Hyvarinen, R. A. Odell, D. J. Martin, P. A. Gunatillake, K. R. Noble and L. A. Poole-Warren, Biomaterials, 2004, 25, 4887–4900 CrossRef CAS PubMed.
- P. A. Gunatillake, G. F. Meijs, R. C. Chatelier, D. M. McIntosh and E. Rizzardo, Polym. Int., 1992, 27, 275–283 CrossRef CAS.
- J. Liang, Y. Xu, Y. Huang, L. Zhang, Y. Wang, Y. Ma, F. Li, T. Guo and Y. Chen, J. Phys. Chem. C, 2009, 113, 9921–9927 CAS.
- A. V. Raghu, Y. R. Lee, H. M. Jeong and C. M. Shin, Macromol. Chem. Phys., 2008, 209, 2487–2493 CrossRef CAS.
- V. Singh, D. Joung, L. Zhai, S. Das, S. I. Khondaker and S. Seal, Prog. Mater. Sci., 2011, 56, 1178–1271 CrossRef CAS.
- G. Haznedar, S. Cravanzola, M. Zanetti, D. Scarano, A. Zecchina and F. Cesano, Mater. Chem. Phys., 2013, 143, 47–52 CrossRef CAS.
- S. Araby, L. Zhang, H.-C. Kuan, J.-B. Dai, P. Majewski and J. Ma, Polymer, 2013, 54, 3663–3670 CrossRef CAS.
- S. Araby, Q. Meng, L. Zhang, H. Kang, P. Majewski, Y. Tang and J. Ma, Polymer, 2014, 55, 201–210 CrossRef CAS.
- B. Ramaraj, Polym.-Plast. Technol. Eng., 2007, 46, 575–578 CrossRef CAS.
- D. S. McLachlan, C. Chiteme, C. Park, K. E. Wise, S. E. Lowther, P. T. Lillehei, E. J. Siochi and J. S. Harrison, J. Polym. Sci., Part B: Polym. Phys., 2005, 43, 3273–3287 CrossRef CAS.
- J. Yu, L. Q. Zhang, M. Rogunova, J. Summers, A. Hiltner and E. Baer, J. Appl. Polym. Sci., 2005, 98, 1799–1805 CrossRef CAS.
- C. I. Kim, S. M. Oh, K. M. Oh, E. Gansukh, H. I. Lee and H. M. Jeong, Polym. Int., 2014, 63, 1003–1010 CrossRef CAS.
- S. Pegel, P. Pötschke, G. Petzold, I. Alig, S. M. Dudkin and D. Lellinger, Polymer, 2008, 49, 974–984 CrossRef.
- F. Jiang, L. Zhang, Y. Jiang, Y. Lu and W. Wang, J. Appl. Polym. Sci., 2012, 126, 845–852 CrossRef.
- B. H. Cipriano, A. K. Kota, A. L. Gershon, C. J. Laskowski, T. Kashiwagi, H. A. Bruck and S. R. Raghavan, Polymer, 2008, 49, 4846–4851 CrossRef CAS.
- F. T. Thema, M. J. Moloto, E. D. Dikio, N. N. Nyangiwe, L. Kotsedi, M. Maaza and M. Khenfouch, New J. Chem., 2013, 2013, 6 Search PubMed.
- P. Bhattacharya, S. Dhibar, G. Hatui, A. Mandal, T. Das and C. K. Das, RSC Adv., 2014, 4, 17039–17053 RSC.
- L. Gong, B. Yin, L.-p. Li and M.-b. Yang, Composites, Part B, 2015, 73, 49–56 CrossRef CAS.
- H. R. Pant, P. Pokharel, M. K. Joshi, S. Adhikari, H. J. Kim, C. H. Park and C. S. Kim, Chem. Eng. J., 2015, 270, 336–342 CrossRef CAS.
- N. Mitik-Dineva, J. Wang, R. C. Mocanasu, P. R. Stoddart, R. J. Crawford and E. P. Ivanova, Biotechnol. J., 2008, 3, 536–544 CrossRef CAS PubMed.
- A. V. Singh, V. Vyas, R. Patil, V. Sharma, P. E. Scopelliti, G. Bongiorno, A. Podestà, C. Lenardi, W. N. Gade and P. Milani, PLoS One, 2011, 6, e25029 CAS.
- S. M. Oliveira, N. M. Alves and J. F. Mano, J. Adhes. Sci. Technol., 2012, 28, 843–863 CrossRef.
- S. P. Khan, G. G. Auner and G. M. Newaz, Nanomedicine, 2005, 1, 125–129 CrossRef CAS PubMed.
| This journal is © The Royal Society of Chemistry 2015 |