Influence of silicate sol–gel host matrices and catalyst agents on the luminescent properties of Eu3+/Gd3+ under different excitation wavelengths
B. Szpikowska-Sroka*a,
N. Pawlika,
T. Goryczkab and
W. A. Pisarskia
aInstitute of Chemistry, University of Silesia, 9 Szkolna Street, 40-007 Katowice, Poland. E-mail: barbara.szpikowska-sroka@us.edu.pl; Fax: +48-32-259-9978; Tel: +48-32-359-1157
bInstitute of Materials Science, University of Silesia, 75 Pułku Piechoty 1A, 41-500 Chorzów, Poland
First published on 9th November 2015
Abstract
Sol–gel silicate glasses co-doped with Gd3+ and Eu3+ ions were successfully obtained and the pronounced effect of the matrix composition on the energy transfer process from Gd3+ to Eu3+ was confirmed. Qualitative compositions of the examined matrices were varied while the europium and gadolinium ion concentrations were kept constant. Different chemical compositions of the sol–gel matrices were clearly marked by changes in the photoluminescent properties. The effect of gadolinium ions on the visible emission of europium ions has been studied. The characteristic emission bands corresponding to the 5D0 → 7FJ (J = 0–4) transitions of Eu3+ were registered. The emission of Eu3+ ions significantly increased during indirect excitation via the energy transfer process Gd3+ → Eu3+ (λexc = 273 nm) in comparison to direct excitation of Eu3+ ions (λexc = 393 nm). The beneficial influence of the energy transfer process on the 5D0 luminescence lifetimes of Eu3+ ions was definitely stated. The structure of the prepared silica sol–gel materials was examined using X-ray diffraction measurements (XRD) and FT-IR spectroscopic techniques. The formation of GdF3 and Gd2O3 nanocrystalline phases was confirmed.
Introduction
In recent years, materials obtained by low-temperature processes have attracted much attention due to a variety of photonic applications, such as: phosphors, solid-state lasers, field emission displays and active waveguides.1–5 The basic advantages of low-temperature methods are the low risk of impurities in the material's structure and prevention of thermal decomposition of some components. One of such methods is sol–gel process, which allows to form an amorphous glass structure by chemical polymerization in liquid phase. An important feature of the sol–gel process is final homogeneity obtained directly in the solution on a molecular scale. If such materials could be used as a component in optoelectronic systems, aside from high degree of purity, the low vibrational phonon energy of host should be also achieved, such as in fluoride glasses. However, these glasses have poor thermal and mechanical properties. In contrast, the oxide glasses have a high vibrational phonon energy and limited ability to integrate rare earth ions into host structure. Therefore, their combination leads to obtain oxyfluoride glasses, which are unique class of materials that combine the advantages of physical and chemical durability with the high solubility of rare earth ions.3Preparation of glass-ceramic materials is based on controlled crystallization by heat treatment process, which results in forming of crystalline phase dispersed in amorphous glassy matrix. Incorporation of rare earth ions into the crystalline phase causes a reduction of nonradiative relaxation due to less vibrational phonon energy of the nearest surrounding around optically active dopant relative to an amorphous environment. Finally, a significant improvement of the optical properties could be obtained. Compared to an amorphous structure, rare earth ions incorporated into the crystalline phase reveal a narrow emission bands and longer luminescence lifetimes.1
Trivalent Eu3+ ions stand out among other lanthanide ions due to exceptionally strong emission in red light spectral range. Materials doped with Eu3+ ions play a particularly important role in lighting applications or color displays.6 Emission spectra of Eu3+ ions are dominated by two transitions: 5D0 → 7F2 and 5D0 → 7F1. The following bands are associated to electric dipole transition (red emission) and magnetic dipole transition (orange luminescence), respectively. The mutual bands intensity varies depending on the symmetry of the local environment in which Eu3+ ions are located and therefore the Eu3+ ions are used as a spectroscopic probes.5,7,8 In practice, the luminescence intensity ratio of 5D0 → 7F2/5D0 → 7F1 transitions indicates nature of the bonding between Eu3+ ion and its nearest surrounding and it is commonly known as R factor.
The basic feature of many phosphors based on lanthanides emission is ability to exchange the energy between optically active ions. This phenomenon is well-known as energy transfer. One of the first spectroscopic system in which efficient energy transfer was successfully observed is Gd3+–Eu3+ couple. Taking into account that the 6PJ levels of Gd3+ and the 5HJ states of Eu3+ ions are energetically similar to each other, the energy may migrates from Gd3+ to Eu3+ ions which act as donor and acceptor of the energy. Thus, the energy transfer process can greatly enhance the luminescence originated from Eu3+ ions in glass and glass-ceramic materials.1,5
Many preparation methods of the luminescent materials based on Eu3+/Gd3+ spectroscopic system are documented in the literature.1,6,7,9–13,16–37 To the best of our knowledge, only a few papers are available based on the sol–gel synthesis, e.g.: LiGdF4:Eu3+,9–12 CsGd2F7,13 Gd4O3F6:Eu3+,21 GdF3,1,35 and GdYCa4O(BO3)3.37
However, there are no reports on the influence of sol–gel matrix compositions on the energy transfer from Gd3+ to Eu3+ and differences in spectroscopic properties resulting from direct (λexc = 393 nm) and indirect (λexc = 273 nm, energy transfer Gd3+ → Eu3+) excitation of Eu3+ ions. These facts were sufficient to carry out research on the Gd3+/Eu3+ system.
In this study, we present new optical results for sol–gel silicate oxyfluoride materials co-doped with Gd3+ and Eu3+ ions. Compositions of the studied materials were varied while the europium and gadolinium ions concentration in all prepared samples were kept constant. The influence of the sol–gel matrix compositions on the luminescence properties and Gd3+ → Eu3+ energy transfer before and after heat treatment was studied. Especially, the presence of various catalyst agents on luminescence of Gd3+/Eu3+ sol–gel system was examined. The beneficial effect of the energy migration process on the spectroscopic properties of Eu3+ ions was also confirmed.
Experimental section
The reagents used in the preparation of sol–gel materials were of analytical grade and supplied by Aldrich Chemical Co. Deionized water obtained from Elix 3 system (Millipore, Molsheim, France) was used during the experiments.Preparation of sol–gel samples
Eu3+ and Gd3+ co-doped oxyfluoride sol–gel materials were analyzed as a function of qualitative compositions of matrices. The sol–gel samples of following compositions (in mol ratios) using the procedure described in38,39 were prepared: 1TEOS–4C2H5OH–10H2O–0.5CH3COOH (SG1 matrix); 1TEOS–2C2H5OH–2DMF–4H2O–0.4HNO3 (SG2 matrix); 1TEOS–2C2H5OH–2DMF–4H2O–0.4CH3COOH (SG3 matrix) (90% mass). The solution of tetraethoxysilane (TEOS) and N,N-dimethylformamide (DMF) in ethanol and water with acetic or nitric acid as a catalyst was hydrolyzed for 30 minutes at room temperature. After this time, previously dissolved Gd(CH3COO)3 and Eu(CH3COO)3 in water and trifluoroacetic acid were added dropwise to the all initial solutions. The molar ratio of the optical active compound was: 0.05Eu(CH3COO)3–1Gd(CH3COO)3–5CF3COOH (10% mass). The resulting mixtures were stirred for another hour. In order to obtain xerogels the wet-gels were dried at 35 °C for 6 weeks. It should be noted that the amounts of europium acetate, gadolinium acetate and trifluoroacetic acid are the same in all synthesized samples. The concentration (in mass%) of Gd3+ and Eu3+ ions are equal to 1.7 and 0.08, respectively. Finally, the samples were inserted into cold muffle furnace (FCF 5 5SHP produced by Czylok Poland) and were heat treated at control conditions of temperature and time (350 °C for 10 hours). The temperature was raised by 10 °C min−1 until 350 °C. After 10 hours of annealing, the glass-ceramic samples were cooled to room temperature in a closed furnace. The process was performed in air.Instruments
The luminescence measurements of obtained samples before and after heat treatment were performed using Horiba Jobin-Yvon spectrofluorimeter FLUOROMAX-4 with 150 W xenon lamp as a light source. The measurements were carried out with a spectral resolution of 0.1 nm. The excitation spectra were measured in the 175–300 nm and 350–575 nm spectral ranges. The emission spectra were measured in the range 285–530 nm and 410–750 nm upon excitation at λexc = 273 nm (excitation of Gd3+ ions) and λexc = 393 nm (excitation of Eu3+ ions), respectively.The X-ray diffraction patterns were carried out using INEL diffractometer with Cu Kα radiation. The IR transmission spectra in the frequency region 500–4000 cm−1 were performed on the Shimadzu FT-IR ATR spectrometer. All experiments and spectral measurements were carried out at room temperature.
Results and discussion
Excitation spectra
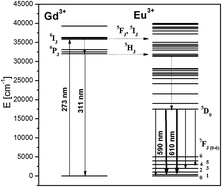
The optical properties of obtained materials were studied with particular emphasis on the energy transfer process. Energy transfer is phenomenon, in which dopant ions in active media can exchange the excitation energy among themselves. To the explanation of this phenomenon the samples were excited by different wavelengths related to different excitation mechanisms of Eu3+ ions. When the samples were pumped by λexc = 393 nm the Eu3+ ions are excited through direct excitation way to the 5L6 excited states of Eu3+ ions. While the samples were excited by λexc = 273 nm from the 8S7/2 ground state to the 6IJ levels of Gd3+ ions the indirect excitation mechanism through Gd3+ → Eu3+ energy transfer process was occurred. Energy transfer mechanism between Gd3+ and Eu3+ ions is presented in Fig. 1. In the Gd3+/Eu3+ system the energy transfer is possible, because excited states of Eu3+ and Gd3+ ions are energetically close to each other. Therefore, after excitation of Gd3+ ions by radiation in UV range (λexc = 273 nm) from the 8S7/2 stable ground state to the 6IJ levels, the energy may be transferred to Eu3+ ions by two possible ways. One approach is based on direct energy transfer and corresponds to the 6IJ (Gd3+) → 5FJ, 5IJ (Eu3+) transition, due to energetically overlapping of the 6IJ levels of donor (Gd3+ ions) and the 5FJ and 5IJ states of acceptor (Eu3+ ions). Firstly, the excited Eu3+ ions loss energy by non-radiative way to the nearest surrounding, until the lowest 5D0 excited state was achieved. Consequently, emission in the visible light range (primarily red and orange luminescence assigned to the 5D0 → 7F2 and 5D0 → 7F1 transitions, respectively) is recorded.1,5,13 The second possible way of the energy transfer is related to non-radiatively transition from the 6IJ levels to the lower-located 6PJ excited states of Gd3+ions. Then the energy migration process follows to the 5HJ excited levels of acceptor Eu3+ ions, because they are energetically coincide with the 6PJ energy states of Gd3+. Finally, emission in the visible spectral range is obtained. Obviously, the emission at λem = 311 nm corresponding to the 6PJ → 8S7/2 transition of Gd3+ ions is also possible. The excitation of Gd3+ ions into the higher-located 6GJ levels was also examined.13–15,18–20 The energy gap between the 6GJ and 6PJ excited states is sufficiently large, therefore emission from the 6GJ state may contain in visible spectral range between 560 nm–640 nm.13–15 So, it results in the visible light range emission derived from Gd3+ ions. This emission overlaps with the luminescence bands characteristic for Eu3+ ions.The excitation of Gd3+ ions into the 6GJ levels can be achieved directly by wavelength at λexc = 202 nm, or indirectly through an excited state absorption process (ESA). This phenomenon involves the absorption of next photon by the lanthanide ion, which is on metastable excited state.5 The 6P7/2 energy level of Gd3+ is metastable, therefore it is probable that the 6GJ excited states of Gd3+ ions can be achieved.5,14,15
Fig. 2 shows the excitation spectra registered for obtained glass samples before heat treatment. Presence of two spectroscopic ranges in each excitation spectra is related to carry out the parallel measurements for Gd3+ and Eu3+. Only for SG1 sample, the registered spectra shows intense narrow band at λexc = 273 nm, which corresponds to the transition from the 8S7/2 stable ground state to the 6IJ energy levels of Gd3+ ions. Therefore, the occurrence in excitation spectra the 8S7/2 → 6IJ transition band during emission monitoring at λem = 611 nm is a direct proof of energy migration process in Gd3+–Eu3+ system. Obviously, it also indicates the involvement of Gd3+ on the emission of Eu3+ ions.
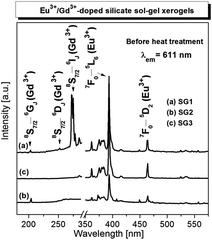 | ||
| Fig. 2 Excitation spectra of Eu3+ and Gd3+ ions in silicate sol–gel xerogels monitored at λem = 611 nm. | ||
The intensities of the excitation bands registered for SG1 sample from the higher-located 6GJ and 6DJ states of Gd3+ ions are negligible in comparison to the 8S7/2 → 6IJ transition. Similarly, the 8S7/2 → 6IJ excitation band of Gd3+ shows the highest intensity in matrices investigated by other authors, for example: Grzyb et al.,5 Zhong et al.,6 Lepoutre et al.,9 Karbowiak et al.,13 Park et al.,32 Szczeszak et al.25 and de Moura et al.27 However, obtained results presented in other papers are different from ours. The intensity of the 8S7/2 → 6GJ transition is strongly higher in comparison to the 8S7/2 → 6IJ transition and described in following ref. 18, 19 and 22–24, especially in ref. 20.
The qualitative composition of studied sol–gel matrices plays an important role for energy transfer process. Based on excitation spectra showed in Fig. 2 we can concluded, that introduction of N,N-dimethylformamide almost completely inhibits the excitation of Gd3+ ions at λexc = 273 nm on 6IJ levels. The Eu3+ ions strong absorb radiation wavelength at 393 nm, which is assigned to the 7F0 → 5L6 transition. Less absorb the visible light at λexc = 464 nm, which corresponds to relatively low intense peak on the excitation spectra (Fig. 2). The excitation bands originated from Eu3+ ions appear regardless of the composition of each glass sample. However, intensities of several bands are varied despite the constant concentration of the optically active dopant.
Emission spectra
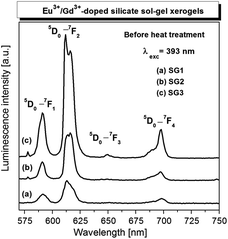
In Fig. 3 the emission spectra of Eu3+ in the sol–gel materials before heat treatment was presented. The sol–gel samples were excited at λexc = 393 nm. For each of obtained glasses the characteristic emission bands for Eu3+ were registered, however intensities of several bands are varied for individual samples.Excitation of optically active dopant at λexc = 393 nm causes the characteristic luminescence bands for Eu3+ ions. The emission is assigned to following transitions: 5D0 → 7F1, 5D0 → 7F2, 5D0 →7F3, and 5D0 → 7F4. Intensity of the 5D0 → 7F2 band associated with the electric dipole transition is the greatest. Observed reduce of the main emission band was in the following order: SG3, SG2 and SG1. Therefore, we can conclude, that using DMF during sol–gel synthesis could have a significant influence not only on inhibition of Gd3+ excitation, but distinctly in promote enhancing emission of Eu3+ ions. DMF is a well-known drying agent. The presence of DMF in sol–gel glass samples allows to remove water from the environment of the optically active dopant. In result, the spectroscopic properties of these materials are better.40 It is important from chemical and technological point of view.
The emission from higher-located excited states of Eu3+ ions does not occur, which is probably due to presence of residual hydroxyl groups, causing non-radiative decay mechanism and results in luminescence quenching.
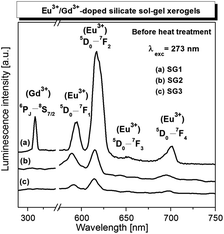
The emission spectra of Eu3+ in obtained glasses monitored at λexc = 273 nm before heat treatment is presented in Fig. 4. Contrary to the results obtained in the emission spectrum upon excitation at λexc = 393 nm (Fig. 3), the strongest emission was obtained for SG1 sample. Taking into account the fact of presence the intensive 8S7/2 → 6IJ band on excitation spectra for SG1 sample (Fig. 2), the significantly growth of luminescence intensity of Eu3+ ions is an expected effect. The characteristic emission of Eu3+ ions in SG2 and SG3 samples is very weak in comparison to SG1. Furthermore, the 6PJ → 8S7/2 characteristic band for Gd3+ ions (λem = 311 nm) was registered only for SG1 sample. Both the excitation and emission spectra suggest the efficient energy transfer Gd3+ → Eu3+ in SG1 sol–gel matrix. The beneficial effect of energy transfer is revealed by significant increase the characteristic luminescence of Eu3+ ions. In other samples energy transfer process also occurred as indicated by characteristic emission of Eu3+ upon excitation at λexc = 273 nm, however, the efficiency is lower than for SG1 samples. Generally, quenching emission originated from Gd3+ ions was probably due to introduction into the glass structure N,N-dimethylformamide and nitric acid as a catalyst agent. This effect is clearly observed in reducing of energy transfer efficiency in studied SG2 and SG3 samples and confirmed previous assumptions. In SG2 and SG3 samples the concentration quenching was excluded due to the same amount of optically active dopant in all prepared samples. It is also significant, that the energy transfer in Gd3+–Eu3+ spectroscopic system in SG1 sample is not complete due to presence of the 6PJ → 8S7/2 emission band of Gd3+ ions in the spectra. Indeed, reduce intensity of the 6PJ → 8S7/2 emission band is a measure of transferring excited energy from Gd3+ to Eu3+ ions and this points to energy transfer process. Zhong et al. conducted the studies on modification in intensity of the emission band corresponding to the 6PJ → 8S7/2 transition of Gd3+ ions in NaEuxGd(1−x)(PO3)4, which is a measure of the energy transfer process efficiency. It was clearly observed, that increasing amounts of acceptor ions (Eu3+) in matrix causes radical decline in the emission intensity of Gd3+ ions at λem = 311 nm.6
The emission spectra for SG1 samples registered under following parameters: λexc = 393 nm and λexc = 273 nm were presented in Fig. 5. Excitation by two different parameters allows to determine the influence of energy transfer process on optical properties in studied glass systems. We focused our attention on enhanced luminescence intensity of characteristic bands for Eu3+ ions. The particular emphasis was placed on comparison the 5D0 → 7F1 and the 5D0 → 7F2 transitions of Eu3+ ions upon excitation at λexc = 273 nm and λexc = 393 nm, respectively. This phenomenon illustrates beneficial influence of the energy transfer process on Eu3+ emission. Therefore, the Eu3+ ions could be an effective luminescence centers upon UV excitation. Indeed, SG1 sample is characterized by significantly stronger red emission under UV excitation (λexc = 273 nm) in comparison to λexc = 393 nm excitation.
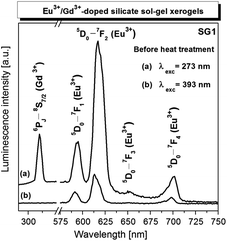 | ||
| Fig. 5 Emission spectra of Eu3+ ions in sol–gel xerogels excited at λexc = 393 nm and λexc = 273 nm. | ||
Furthermore, we also observed widening of the red luminescence band of Eu3+ ions upon λexc = 273 nm excitation in comparison to λexc = 393 nm excitation. It should be noticed, that change in the excitation wavelength leads to modification the R-factors calculated for the SG1 sample and probably illustrates the visible luminescence of Gd3+ ions. It is really interesting that under excitation at λexc = 393 nm the R-factor equals to 3.12, but the UV excitation apparently leads to growth the R-factor value, which finally equals to 4.97 and indicating Gd3+ emission in the visible light range (Table 1).
| Sample | Excitation λex [nm] | Emission λem [nm] | Transitions | τm [ms] | R |
|---|---|---|---|---|---|
| SG 1 | 393 | 590 | 5D0 → 7F1 | τ1 = 0.19 | 3.12 |
| 611 | 5D0 → 7F2 | ||||
| 273 | 590 | 5D0 → 7F1 | τ1 = 0.37 | 4.97 | |
| 619 | 5D0 → 7F2 | ||||
| SG HT 1 | 393 | 590 | 5D0 → 7F1 | τ1 = 0.30, τ2 = 1.50 | 0.84 |
| 611 | 5D0 → 7F2 | ||||
| 273 | 590 | 5D0 → 7F1 | τ1 = 0.47, τ2 = 2.75 | 0.80 | |
| 611 | 5D0 → 7F2 | ||||
| SG 2 | 393 | 591 | 5D0 → 7F1 | τ1 = 0.28 | 3.66 |
| 614 | 5D0 → 7F2 | ||||
| 273 | 590 | 5D0 → 7F1 | τ1 = 0.07 | 2.70 | |
| 614 | 5D0 → 7F2 | ||||
| SG HT 2 | 393 | 590 | 5D0 → 7F1 | τ1 = 0.04, τ2 = 0.68 | 4.90 |
| 612 | 5D0 → 7F2 | ||||
| 273 | 590 | 5D0 → 7F1 | τ1 = 0.09, τ2 = 0.75 | 3.35 | |
| 612 | 5D0 → 7F2 | ||||
| SG 3 | 393 | 591 | 5D0 → 7F1 | τ1 = 0.40 | 3.42 |
| 612 | 5D0 → 7F2 | ||||
| 273 | 590 | 5D0 → 7F1 | τ1 = 0.07 | 2.71 | |
| 611 | 5D0 → 7F2 | ||||
| SG HT 3 | 393 | 590 | 5D0 → 7F1 | τ1 = 0.03, τ2 = 0.90 | 2.87 |
| 612 | 5D0 → 7F2 | ||||
| 273 | 590 | 5D0 → 7F1 | τ1 = 0.08, τ2 = 1.11 | 2.64 | |
| 612 | 5D0 → 7F2 |
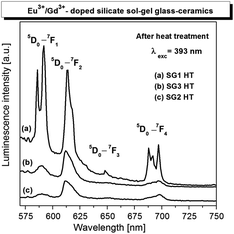
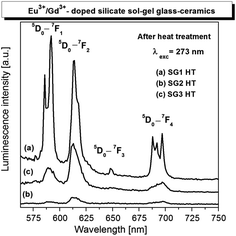
The emission spectra of obtained sol–gel samples after heat treatment upon excitation at λexc = 393 nm and λexc = 273 nm were shown in Fig. 6 and 7, respectively. The emission spectra for Eu3+ ions were registered in the range from 285 nm to 750 nm, upon excitation at λexc = 273 nm (to the 6IJ levels of Gd3+) and at λexc = 393 nm (to the 5L6 level of Eu3+ ions). The most intense luminescence bands are observed for the SG1 HT sample and the resulting emission peaks are narrow, suggesting partial crystallization. Relatively weak emission were recorded for SG2 HT and SG3 HT samples upon excitation at λexc = 393 nm and λexc = 273 nm. The emission spectra of SG1 and SG3 samples after annealing presented the change in the relative intensities of bands, which are associated to the 5D0 → 7F2 (red line) and the 5D0 → 7F1 (orange line) transitions of Eu3+ ions. According to Jorgensen and Judd,41 the electric-dipole transitions of trivalent rare earth ions that obey the selection rules: |ΔS| = 0, |ΔJ| ≤ 2 and |ΔL| ≤ 2 are strongly sensitive to the host environment, and are referred as hypersensitive transitions.
In numerous published works devoted to the phenomenon of hypersensitivity42–44 much attention has been paid to the 5D0 → 7F2 transition of Eu3+.45–48 Accumulated experimental findings justify the assignment of this transition to the category of hypersensitive transitions despite the fact that it is not consistent with the selection rule ΔS = 0. Detailed discussion of this topic can be found in an excellent review paper by Koen Binnemans published recently.49 In contrast to the 5D0 → 7F2 red electric-dipole transition, the 5D0 → 7F1 orange transition is a magnetic-dipole transition, which is independent of the local symmetry. Therefore, the ratio of integrated emission intensity of the 5D0 → 7F2 transition to that of the 5D0 → 7F1 transition, defined as fluorescence intensity ratio R, is relative to the strength of covalent/ionic bonding between the Eu3+ ion and the surrounding ligands and is the spectroscopic key to estimate the deviation from the site symmetries of trivalent europium. This ratio is a sensitive function of covalency and asymmetry around the Eu3+ ions. Small R value is usually attributed to higher local symmetry for Eu3+ ions. The increase in R value is due to increasing asymmetry and degree of covalency between trivalent europium and oxygen ions. After annealing the local symmetry around the optically active dopant (Eu3+ ions) and ionic character of bonds increased and it is confirmed by lower R-ratio value. For SG1 HT sample it was observed that the orange emission is stronger than red luminescence, and R-ratios are equal to 0.84 (λexc = 393 nm) and 0.80 (λexc = 273 nm). The luminescence intensities ratios calculated for samples after annealing are decreased more than three and six times, upon λexc = 393 nm and λexc = 273 nm excitation, respectively. This effect confirms the partial crystallization of amorphous structure and partial incorporation the optical active dopant into the crystalline phase during controlled ceramization. Thus, the annealing process for SG1HT glass conducted at 350 °C for 10 hours leads to an efficient formation the crystalline phase within the amorphous structure of precursor sol–gel glass. Indeed, the XRD studies confirmed formation of GdF3:Eu3+ nanocrystalline phase in the SG1 sample, which is presented and discussed in the next parts of this article.
In contrary to our expectations, the 5D0 → 7F2 band for SG2 HT and SG3 HT samples is stronger than the 5D0 → 7F1 transition and suggest no incorporation of dopant ions (Eu3+) within the crystalline phase. The R-values calculated for SG2 and SG3 samples before annealing are similar to those after annealing, and suggest that there is no change in surroundings framework around optically active dopant. Therefore, a different annealing procedure should be used to incorporate an optically active dopant into the crystalline phase in SG2 and SG3 glass samples. For SG2 HT samples after annealing we observed very weak emission of Eu3+ ions upon λexc = 273 nm excitation in contrast to SG1 HT and SG3 HT. We suppose that, presence of nitric acid in studied SG2 HT samples probably does not allow on the efficiently energy transfer from Gd3+ to Eu3+. Nitric acid is a well-known strong acid, which is completely dissociates in aqueous solutions, therefore the final pH value of solution during hydrolysis and condensation of the SG2 glass precursor was equal to 1 and it is much lower than for SG1 and SG3 samples. While acetic acid CH3COOH as a weak acid dissociates partially only, and the strength of this acid could be characterized by the acid dissociation constant. The final pH value of solution during hydrolysis and condensation of the SG1 and SG3 matrices was higher than SG2 sample and equal to about 5. It is well-known that the structure and properties of sol–gel materials (e.g. hydrophobicity) are dependent on the used catalyst agent and conditions of the hydrolysis and polymerization. Therefore, to explain the influence of catalyst on luminescence properties, the acids of different strength were used during experiment. Different acid catalysts lead to formation materials with variety structures that may affect the luminescence behavior dopant due to change the surrounding framework around the optically active ions.
In literature the energy transfer in Gd3+–Eu3+ spectroscopic sol–gel system was investigated. However, there is no data on comparison the luminescence properties of Eu3+ ions upon indirect (via energy transfer) and direct (without the involvement of Gd3+ ions) excitation. The comparison was presented and discussed in a few works, only.5,13,35–37 Excitation of Eu3+ ions in GdF3:Eu3+ after annealing process (350–500 °C)5 through energy transfer leads to more efficient luminescence in comparison to direct excitation way. In contrast, Karbowiak et al. (CsGd2F7:Eu3+, annealing temperature: 750 °C)13 and Solarz et al. (GdCa4O(BO3)3:Eu3+, annealing temperature: 1050 °C)37 obtained comparable intensities of characteristic bands for Eu3+ regardless of excitation parameters.
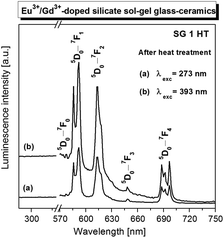
Comparison of emission spectra for SG1 HT glass-ceramic material registered under different excitation wavelengths: λexc = 393 nm and λexc = 273 nm were presented in Fig. 8. It was observed the three characteristic for Eu3+ emission bands: 5D0 → 7F1,2,4 and very weak two other bands, which are associated to 5D0 → 7F0 and 5D0 → 7F3 transitions. Occurrence of the emission bands characteristic for Eu3+ ions upon λexc = 273 nm excitation indicates the energy transfer process from Gd3+ to Eu3+ after heat treatment. Moreover, emission corresponding to the 6PJ → 8S7/2 transition of Gd3+ ions at λem = 311 nm is not observed, which also confirms that the effective energy migration from Gd3+ to Eu3+ occurs. The R-ratio values calculated for SG1 HT sample upon both excitation parameters are similar to each other and equals to 0.84 (λexc = 393 nm) and 0.80 (λexc = 273 nm). It also indicates that after annealing we registered no emission from Gd3+ ions in the visible range.
 | ||
| Fig. 8 Emission spectra of Eu3+ ions in SG1 HT sol–gel glass-ceramic excited at λexc = 393 nm and λexc = 273 nm. | ||
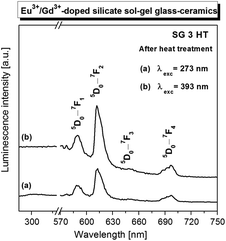
Fig. 9 shows the comparison of the emission spectra registered at λexc = 393 nm and λexc = 273 nm for SG3 HT sol–gel glass-ceramic samples. The emission of Eu3+ ions upon λexc = 273 nm excitation confirms, that the Gd3+ → Eu3+ energy transfer process occurs, but the efficiency is smaller than in SG1 HT samples. The characteristic for Gd3+ ions emission band at λexc = 311 nm, corresponding to the 6PJ → 8S7/2 transition does not appear on the spectra registered for SG3 HT samples (Fig. 9). After heat treatment the red luminescence of Eu3+ ions in SG3 HT sample is the greatest. Obtained R-factor values are larger than for SG1 HT sample, what clearly demonstrates local asymmetry of environment around Eu3+ ions and covalent bonding between Eu3+ and nearest surrounding within matrix.5,8 Based on presented results, we can conclude, that different annealing parameters should be used in order to incorporate the optically active dopant ions into crystal phase. However, this research will be conducted in the future work.
 | ||
| Fig. 9 Emission spectra of Eu3+ ions in SG3 HT sol–gel glass-ceramic excited at λexc = 393 nm and λexc = 273 nm. | ||
Luminescence lifetimes
The luminescence lifetime is one of the most important parameters which characterize the emission in luminescent material. In order to determine the impact of the energy transfer process on optical properties of the obtained sol–gel materials, the luminescence decay curves for the 5D0 excited state of Eu3+ ions under different excitation parameters (λexc = 273 nm and λexc = 393 nm) before and after heat treatment were measured. The lifetimes for the 5D0 excited state were analyzed monitoring λem = 590 nm (5D0 → 7F1 transition of Eu3+) emission, because in this spectral range the emission coming from Gd3+ was not observed.36 To determine the effect of qualitative composition of the matrices on emission properties, the luminescence decay curves measured under different excitation wavelengths were compared and the results are presented in Table 1. The luminescence lifetime registered for SG1 sample before annealing process is almost twice longer under UV excitation (λexc = 273 nm, τ1 = 0.37 ms) in comparison to 393 nm excitation (τ1 = 0.19 ms). Thus, the obtained results confirm the beneficial effect of the energy transfer process on the optical properties in SG1 samples. Before heat treatment the longest luminescence lifetime for the 5D0 state of Eu3+ ions upon 393 nm excitation was obtained for SG3 sample (τ = 0.40 ms), while the shortest lifetime was obtained for SG1. The obtained results are comparable with the luminescence of SG1–SG3 samples (Fig. 3). Generally, the lifetimes of the 5D0 excited state of Eu3+ are longer for SG2 and SG3 samples in comparison to SG1 sample. This effect is probably due to introduction of DMF during preparation. DMF as a desiccant agent is able to remove the hydroxyl groups and consequently the luminescence lifetimes of optically active dopants are prolonged. Moreover, the introduction of acetic acid led to elongation the luminescence lifetimes for SG3 samples compared to SG2.Relatively short lifetimes of the 5D0 excited state of Eu3+ in sol–gel samples before heat treatment are due to presence residual hydroxyl groups, which cause quenching the luminescence by non-radiative mechanism. Prolongation of lifetimes in sol–gel glass-ceramics after annealing is due to removal the hydroxyl groups and incorporation the optically active dopants into crystal phase with relatively low phonon energy.
Before heat treatment the decay curves for SG1–SG3 samples were well-fitted to a single-exponential function. But after heat treatment the decay curves were fitted to a double-exponential function with two different times of decay suggesting the presence of two centers with different probabilities of nonradiative decay (Table 1). Furthermore, after heat treatment for SG1 HT sample we observed the lifetime prolongation under UV excitation at λexc = 273 nm (τ1 = 0.47, τ2 = 2.75) in comparison to λexc = 393 nm (τ1 = 0.30, τ2 = 1.50). In result, excitation of Eu3+ ions through energy migration process leads to prolongation lifetime for the 5D0 excited state at about 2 times in comparison to direct way of excitation. These results demonstrate the beneficial effect of the energy transfer process on emission of Eu3+ ions after heat treatment process. Indeed, excitation of Eu3+ ions through energy transfer causes the lifetime prolongation both before and after annealing. Observed effect is a direct proof of beneficial impact of the energy transfer on optical properties of the studied sol–gel samples.
In the case of SG3 HT samples, the luminescence lifetimes of the 5D0 excited state are slightly longer upon λexc = 273 nm than λexc = 393 nm excitation and are equal to 1.11 ms and 0.90 ms, respectively. These results indicate that energy transfer process in this matrix exist, but the efficiency is lower than in SG1 HT samples.
It is worth to notice that the lifetime values of the 5D0 excited state of Eu3+ in polycrystalline samples studied by Zhong et al. in NaGd(PO3)4:Eu3+ (ref. 6) and H. T. Wong et al. in GdF3:Eu3+ nanocrystals30 are comparable regardless of studied excitation parameter. The 5D0 measured lifetime in SG1 samples is higher compared to the value obtained by Vergeer et al.50 Kondo et al.,17 and Lorbeer et al.,28 but is lower than the value obtained by Lepoutre et al. for LiGdF4:Eu3+ crystals.12
Structural characterization
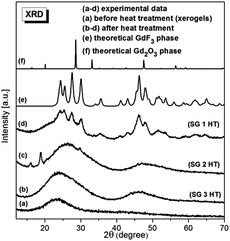
The discussed earlier changes in luminescence spectra and their decays are related to presence of crystalline phase, which were formed during the heat treatment process. In order to explain luminescence behavior of Eu3+ ions, the local structure around optically active dopants was examined using X-ray diffraction (Fig. 10), as well as Fourier transform infrared spectroscopy (FT-IR) (Fig. 11).The XRD patterns for prepared sol–gel materials before and after heat treatment process are presented in Fig. 10. All of prepared samples before annealing process were fully amorphous, without any crystallization peak (Fig. 10a). The greatest structural changes during heat treatment was observed for SG1 HT sample. Based on the theoretical XRD pattern the peaks were assigned to the GdF3 crystalline phase (Fig. 10e). The average grain size of formed GdF3 nanocrystalline phase was estimated based on Scherrer's formula and equaled to 6.3 nm. The results were re-examined with the Williamson–Hall method, which includes internal stress influence on the line broadening. The estimated particle size was 5.6 nm, which corresponds to the results obtained by Scherrer's method. The lattice deformation is about 0.00167%. A quite different situation is observed for SG2 HT sample (Fig. 10c). The registered peaks correspond to Gd2O3 crystalline phase. The average size of the crystallites from Scherrer's equation was estimated to about 21.8 ± 1.1 nm. The calculated particle size from Williamson–Hall formula was 26.8 ± 1 nm and the lattice deformation is about 0.15%. Due to greater divergences between calculated values of particle sizes (Gd2O3 phase) for SG2 HT sample the results were re-examined with the Cauchy–Gauss method. The average estimated nanocrystal size is equaled to 19.3 ± 0.5 nm and the lattice deformation is about 0.31%. In contrast to SG1 HT and SG2 HT samples the XRD pattern of SG3 HT sample contain broad diffraction lines without any narrow lines typical for crystalline samples. On the basis of these studies we can conclude, that structural changes observed after annealing depend strongly on the host composition and catalyst agent used during sample preparation.
In fact, the luminescence properties is highly dependent on the structural properties of the prepared sol–gel materials. Based on large increase of luminescent lifetimes of the 5D0 state of Eu3+ in SG1 HT glass-ceramic sample compared to SG1 xerogel (Table 1), we suppose that after heat treatment process part of Eu3+ ions were incorporated into formed GdF3 nanocrystalline phase with relatively low-phonon energy. This effect can be also confirmed by significant decrease in R-ratio values calculated for SG1 and SG1 HT sol–gel samples (Table 1). The relatively short emission lifetimes of the 5D0 excited state and high calculated R-ratio values for SG2 HT and SG3 HT samples are due to relatively high-phonon energy of amorphous environment around Eu3+ ions (Table 1). However, the slight increase of the 5D0 luminescence lifetimes of Eu3+ after annealing of SG2 HT and SG3 HT samples was observed. Considered effect can be explained by removal of residual hydroxyl OH− groups, which effectively quench the characteristic luminescence of lanthanides.51
In order to confirm this hypothesis the FT-IR spectra were also measured (Fig. 11). The FT-IR spectroscopy has been widely applied to investigate the microstructure of sol–gel derived materials. The characteristic groups of FT-IR bands can be observed in the 500–4000 cm−1 frequency region. The FT-IR spectra registered for samples before heat treatment reveals characteristic band in the 3000–3500 cm−1 frequency region, according to OH− groups stretching vibrations.52 It should be noted that in the case of SG2 and SG3 sol–gel silica samples considered bands are weaker compared to SG1 sample. This effect could be explained by introduction of N,N-dimethylformamide compound during preparation process. DMF is added to reduction of the hydroxyl groups.53 Furthermore, the small intensity of this band for studied sol–gel materials after heat treatment indicates the elimination of hydroxyl groups from the hosts composition.
Moreover, the peak corresponding to the O–H deformation vibration (about 1420 cm−1) was registered for all prepared xerogels, whereas it appears after conducted annealing process. Obviously, described spectral results confirm earlier speculations that prolongation of luminescence lifetime from the 5D0 excited state of Eu3+ is due to removal of water molecules from the sol–gel hosts. The peaks at about 1050 cm−1 (Si–O–Si stretching)54 frequency region were observed for all prepared SG1, SG2 and SG3 sol–gel samples. The bands become narrower after heat treatment, indicated a densification of SiO2 structure. The peaks at about 1200 cm−1,55 1100 cm−1 as well as 800 cm−1 (ref. 56) were also assigned to the Si–O–Si stretching. The next peaks at about 950 cm−1 and 720 cm−1 were ascribed to vibration of Si–O in Si–OH group and torsional vibrations modes of Si–O bond, respectively. However, the band at about 550 cm−1 (ref. 57) frequency region was observed for all obtained heat treated samples. This band could be assigned to cyclic structures in the silica network. The band arises around 550–640 cm−1 frequency region. As Yoshino et al.58 presented the fourfold siloxane rings are correlated to the presence of unreacted alkoxy groups. These groups thermally decompose at around 200–300 °C to give Si–OH species and simultaneously, the fourfold rings transformation to more open ring structures is carried out. On the other hand, the band registered at about 2800 cm−1 and 1530 cm−1 can be assigned to CH3–N stretching and C–N stretching, respectively, and appeared in spectra registered for SG2 and SG3 samples only due to addition of DMF. The band registered at 1645 cm−1 frequency region (C![[double bond, length as m-dash]](https://www.rsc.org/images/entities/char_e001.gif) O stretching) appeared in the FT-IR spectra for all xerogel samples SG1, SG2 and SG3 due to addition of CH3COOH, Gd(CH3COO)3 and Eu(CH3COO)3. It should be noticed that all of this analyzed peaks have not been registered for annealed samples, which means the evaporation of that volatile chemical components.
O stretching) appeared in the FT-IR spectra for all xerogel samples SG1, SG2 and SG3 due to addition of CH3COOH, Gd(CH3COO)3 and Eu(CH3COO)3. It should be noticed that all of this analyzed peaks have not been registered for annealed samples, which means the evaporation of that volatile chemical components.
Conclusions
In this paper, the sol–gel silica materials co-doped with Gd3+ and Eu3+ ions were successfully obtained and the pronounced effect of the matrix composition on the energy transfer process were confirmed. Optical properties of Eu3+ and Gd3+ co-doped sol–gel glasses and glass-ceramics were studied under different excitation wavelengths. Spectroscopic parameters of Gd3+–Eu3+ system were determined based on excitation and emission spectra as well as luminescence decay analysis. Qualitative compositions of the examined matrices with the same concentration of europium and gadolinium ions were varied, which was clearly marked by the changes in the photoluminescent properties. The studies demonstrated that the occurrence of energy transfer in Gd3+–Eu3+ spectroscopic system is also strictly dependent on the chemical composition of the examined matrices and the positive effect of Gd3+ ions on visible emission of Eu3+ has been confirmed. The obtained results suggest that quenching of the energy transfer in studied samples is related to use of nitric acid as a catalyst agent and introduction N,N-dimethylformamide as a drying agent. Before heat treatment, increase of the red emission originated from Eu3+ ions under λexc = 273 nm excitation is probably associated with the emission of Gd3+ ions in the visible light range. For the SG1 HT glass-ceramic sample the narrow and intense orange emission was observed. This is a result incorporation of the Eu3+ into the formed crystalline phase. The structure of prepared silica sol–gel materials was examined using X-ray diffraction measurements (XRD) and FT-IR spectroscopic techniques. The formation of GdF3 and Gd2O3 nanocrystalline phase was confirmed. Relatively intense red emission registered for SG2 HT glass-ceramic samples suggests low-effective incorporation of optically active dopants into crystal phase formed during heat-treatment process. The luminescence lifetime of the 5D0 excited state measured for SG1 HT sample under λexc = 273 nm excitation is much longer in comparison to the lifetime monitored upon λexc = 393 nm, what indicating efficient energy transfer process in this sample. It was observed the prolongation lifetime values of the 5D0 excited state of Eu3+ in glass-ceramic samples after annealing in comparison to results obtained for samples before heat treatment process. This is mainly due to removal of residual hydroxyl groups in glass-ceramics materials and change in surroundings around optically active dopant. Moreover, the occurrence of the energy transfer process beneficially impacts on optical properties of the SG1 sample, which could be a promising red phosphor under UV/VUV excitation. It allows to obtain novel materials with potential applications in PDPs and mercury-free fluorescent lamps considering its lower calcination temperature and high chemical stability at ambient conditions.References
- S. Fujihara, S. Koji and T. Kimura, J. Mater. Chem., 2004, 14, 1331 RSC.
- W. Xu, G. Zhu, X. Zhou and Y. Wang, Dalton Trans., 2015, 44, 9241 RSC.
- S. Fujihara and K. Tokumo, J. Fluorine Chem., 2009, 130, 1106 CrossRef CAS.
- M. Ding, D. Chen, Z. Wan, Y. Zhou, J. Zhong, J. Xi and Z. Ji, J. Mater. Chem. C, 2015, 3, 5372 RSC.
- T. Grzyb and S. Lis, J. Rare Earths, 2009, 27(4), 588 CrossRef.
- J. Zhong, H. Liang, Q. Su, J. Zhou, Y. Huang, Z. Gao, Y. Tao and J. Wang, Appl. Phys. B, 2010, 98, 139 CrossRef CAS.
- M. Banski, A. Podhorodecki, J. Misiewicz, M. Afzaal, A. Lutfi Abdelhady and P. O'Brien, J. Mater. Chem. C, 2013, 1, 801 RSC.
- M. Secu, C. E. Secu and C. Ghica, Opt. Mater., 2011, 33, 613–617 CrossRef CAS.
- S. Lepoutre, D. Boyer and R. Mahiou, J. Lumin., 2008, 128, 635 CrossRef CAS.
- S. Lepoutre, D. Boyer and R. Mahiou, Opt. Mater., 2006, 28, 592 CrossRef CAS.
- S. Lepoutre, D. Boyer, A. Potdevin, M. Dubois, V. Briois and R. Mahiou, J. Solid State Chem., 2007, 180, 3049 CrossRef CAS.
- S. Lepoutre, D. Boyer, S. Fujihara and R. Mahiou, J. Mater. Chem., 2009, 19, 2784 RSC.
- M. Karbowiak, A. Mech and W. Ryba-Romanowski, J. Lumin., 2005, 114, 65 CrossRef CAS.
- R. T. Wegh, H. Donker and A. Meijerink, Phys. Rev. B: Condens. Matter Mater. Phys., 1997, 56(21), 13841 CrossRef CAS.
- P. S. Peijzel, W. J. M. Schrama, M. F. Reid and A. Meijerink, J. Lumin., 2003, 102–103, 211 CrossRef CAS.
- Y. Zhang, X. Liu, X. Li, K. Li, H. Lian, M. Shang and J. Lin, Dalton Trans., 2015, 44, 7743 RSC.
- Y. Kondo, K. Tanaka, R. Ota, T. Fujii and Y. Ishikawa, Opt. Mater., 2005, 27, 1438 CrossRef CAS.
- R. T. Wegh, H. Donker, K. D. Oskam and A. Meijerink, J. Lumin., 1999, 82, 93 CrossRef CAS.
- R. T. Wegh, H. Donker, K. D. Oskam and A. Meijerink, Science, 1999, 283, 663 CrossRef CAS PubMed.
- R. Hua, J. Niu, B. Chen, M. Li, T. Yu and W. Li, Nanotechnology, 2006, 17, 1642 CrossRef CAS PubMed.
- T. Grzyb, R. J. Wiglusz, V. Nagirnyi, A. Kotlov and S. Lis, Dalton Trans., 2014, 43, 6925 RSC.
- Q. Y. Zhang and X. Y. Huang, Prog. Mater. Sci., 2010, 55, 353 CrossRef CAS.
- B. Liu, Y. Chen, C. Shi, H. Tang and Y. Tao, J. Lumin., 2003, 101, 155 CrossRef CAS.
- W. Liang and Y. Wang, Mater. Chem. Phys., 2010, 119, 214 CrossRef CAS.
- A. Szczeszak, T. Grzyb, B. Barszcz, V. Nagirnyi, A. Kotlov and S. Lis, Inorg. Chem., 2013, 52, 4934 CrossRef CAS PubMed.
- A. Szczeszak, T. Grzyb, S. Lis and R. J. Wiglusz, Dalton Trans., 2012, 41, 5824 RSC.
- A. P. de Moura, L. H. Oliveira, I. C. Nogueira, P. F. S. Pereira, M. S. Li, E. Longo, J. A. Varela and I. L. V. Rosa, Adv. Chem. Eng. Sci., 2014, 4, 374 CrossRef CAS.
- C. Lorbeer, J. Cybinska and A.-V. Mudring, Chem. Commun., 2010, 46, 571 RSC.
- D. Chen, Y. Wang, Y. Yu and P. Huang, J. Phys. Chem. C, 2008, 112, 18943 CAS.
- H.-T. Wong, H. L. W. Chan and J. H. Hao, Appl. Phys. Lett., 2009, 95, 022512 CrossRef.
- W. Ryba-Romanowski, S. Gołąb, G. Dominiak-Dzik and P. Solarz, Appl. Phys. A, 2002, 74, 581 CrossRef CAS.
- W. Park, R.-Y. Lee, C. J. Summers, Y. R. Do and H. G. Yang, Mater. Sci. Eng., B, 2000, 78, 28 CrossRef.
- T. Grzyb, M. Runowski and S. Lis, J. Lumin., 2014, 154, 479 CrossRef CAS.
- M. Runowski, S. Balabhadra and S. Lis, J. Rare Earths, 2014, 32(3), 242 CrossRef CAS.
- B. Szpikowska-Sroka, L. Żur, R. Czoik, T. Goryczka, M. Żądło and W. A. Pisarski, Opt. Lett., 2014, 39, 3181 CrossRef CAS PubMed.
- B. Szpikowska-Sroka, M. Żądło, R. Czoik, L. Żur and W. A. Pisarski, J. Lumin., 2014, 154, 290 CrossRef CAS.
- P. Solarz, M. Nikl, A. Kłos, R. Lisiecki, W. Ryba-Romanowski, A. Rzepka, S. Ganschow and A. Pajączkowska, Cryst. Res. Technol., 2007, 42(12), 1308 CrossRef CAS.
- A. C. Yanes, J. Del-Castillo, J. Mendez-Ramos, V. D. Rodrıguez, M. E. Torres and J. Arbiol, Opt. Mater., 2007, 29, 999 CrossRef CAS.
- S. Fujihara, C. Mochizuki and T. Kimura, J. Non-Cryst. Solids, 1999, 244, 267 CrossRef CAS.
- B. Szpikowska-Sroka, N. Pawlik, T. Goryczka and W. A. Pisarski, Ceram. Int., 2015, 41, 11670 CrossRef CAS.
- C. K. Jorgensen and B. R. Judd, Mol. Phys., 1964, 8, 281 CrossRef.
- C. Gőrller-Walrand and K. Binnemans, in Handbook on the Physics and Chemistry of Rare Earths, ed., K. A. Gschneidner Jr. and L. Eyring, North-Holland, Amsterdam, 1998, pp. 101–264 Search PubMed.
- J. Pisarska, J. Phys.: Condens. Matter, 2009, 21, 285101 CrossRef PubMed.
- W. A. Pisarski, J. Pisarska, M. Mączka, R. Lisiecki, Ł. Grobelny, T. Goryczka, G. Dominiak-Dzik and W. Ryba-Romanowski, Spectrochim. Acta, Part A, 2011, 79, 696 CrossRef CAS PubMed.
- W. A. Pisarski, J. Pisarska, L. Żur and T. Goryczka, Opt. Mater., 2013, 35, 1051 CrossRef CAS.
- V. Sudarsan, F. C. J. M. van Veggel, R. A. Herring and M. Raudsepp, J. Mater. Chem., 2005, 15, 1332 RSC.
- K. Linganna and C. K. Jayasankar, Spectrochim. Acta, Part A, 2012, 97, 788 CrossRef CAS PubMed.
- M. Irfanullah, D. Kumar Sharma, R. Chulliyil and A. Chowdhury, Dalton Trans., 2015, 44, 3082 RSC.
- K. Binnemans, Coord. Chem. Rev., 2015, 295, 1 CrossRef CAS.
- P. Vergeer, E. van den Pol and A. Meijerink, J. Lumin., 2006, 121, 456 CrossRef CAS.
- B. Szpikowska-Sroka, L. Żur, R. Czoik, T. Goryczka, A. S. Swinarew, M. Żądło and W. A. Pisarski, J. Sol-Gel Sci. Technol., 2013, 68, 278 CrossRef CAS.
- M. Sołtys, L. Żur, J. Pisarska and W. A. Pisarski, J. Rare Earths, 2014, 32, 213 CrossRef.
- M. Żądło, B. Szpikowska-Sroka, L. Żur, R. Czoik and W. A. Pisarski, J. Rare Earths, 2014, 32, 269 CrossRef.
- R. Campostrini, M. Ischia, G. Carturan and L. Armelao, J. Sol-Gel Sci. Technol., 2002, 23, 107 CrossRef CAS.
- D. Möncke, D. Palles, N. Zacharias, M. Kaparou, E. I. Kamitsos and L. Wondraczek, Phys. Chem. Glasses: Eur. J. Glass Sci. Technol., Part B, 2013, 54, 52 Search PubMed.
- C. Racles, A. Nistor and M. Cazacu, Cent. Eur. J. Chem., 2013, 11, 1689 CrossRef CAS.
- P. Innocenzi, J. Non-Cryst. Solids, 2003, 316, 309 CrossRef CAS.
- H. Yoshino, K. Kamiya and H. Nasu, J. Non-Cryst. Solids, 1990, 126, 68 CrossRef CAS.
| This journal is © The Royal Society of Chemistry 2015 |

