Influence of enolate/epoxy configuration, doping and vacancy on the catalytic activity of graphene

S. Sinthika and Ranjit Thapa*
SRM Research Institute, SRM University, Kattankulathur – 603203, Tamil Nadu, India. E-mail: ranjit.phy@gmail.com; ranjit.t@res.srmuniv.ac.in; Fax: +91-44-2745-6702; Tel: +91-44-2741-7918

Received 29th September 2015 , Accepted 24th October 2015

First published on 26th October 2015


Abstract

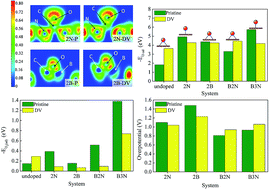
Using density functional theory based electronic structure analysis we substantiate that the bonding type of atomic oxygen (epoxide or enolate) and adsorption strength of molecular oxygen play vital roles in determining the overpotential of oxygen reduction reactions (ORR) of n and p doped graphene-based electrocatalysts. The presence of localized pz states influences the electron accepting and donating characteristics of the carbon atoms of the DV (555-777) defective graphene. We probe the origin of dopant-induced enolate and epoxide formation in both pristine and DV graphene based on the occupation of pz orbital of active site after doping. In spite of the slightly higher tendency of DV to adsorb molecular oxygen than pristine graphene, the enhancement in binding strengths of O2 with the introduction of dopants is higher in the pristine case when compared to the DV. The donation and back-donation interaction of dopant with nearby carbon atoms is inspected in detail. We examine the effects of boron and nitrogen co-doping and find that a doping configuration of a boron atom bonded to two nitrogen atoms (B2N) possesses moderate binding with atomic and molecular oxygen, suggesting it to be a better catalyst for oxygen reduction reaction with lowest overpotential among the systems considered. Moreover the possibility of CO poisoning has been tested for all the surfaces. The approach considered in this work is general and can be extended to understand the catalytic activity of other carbon/graphene based systems.

1. Introduction

The performance of low temperature fuel cells (LTFC) is limited by the slow kinetics of oxygen reduction reaction (ORR) on the cathode catalyst as compared to the hydrogen oxidation reaction at the anode.1 As cathode catalysts, Pt, Pd and Ru based materials have proven to be efficient in improving the ORR kinetics. However, the commercialization of LTFC is hindered because of the scarcity of these high cost noble metals, their susceptibility to CO poisoning2 and activation loss.3,4 Low cost, highly abundant, stable and CO tolerant graphene based materials have found to be a new class of ORR electrocatalysts.5–7 The governing parameters that define the efficiency of any electrocatalyst, viz. adsorption energies and the type of reaction intermediates, activation barriers and the reaction energies between intermediate steps are distinctly different on graphene based catalysts as compared to the transition metal based ones.8 The active sites, reaction mechanisms and potential determining steps are controversial even though exhaustive studies have been performed on graphene based catalysts.9 Hence further theoretical understanding is required to guide the experimentalists in the area of electrocatalyst.

Pristine graphene does not show appreciable potential as an ORR electrocatalyst, hence heteroatom doping is essential to utilize it as a high-performance electrocatalyst. In particular, doping of graphene with boron or nitrogen atoms has received remarkable attention as they enhance the chemical reactivity without distorting the graphene plane.10,11 Theoretical calculations by Boukhvalov et al. have revealed that the energy barriers of each step in N-graphene catalyzed ORR is lower than that on a Pt surface.12 Zhang et al. have studied the activity of N doped graphene and have attributed the high catalytic activity to the high positive spin density and asymmetric atomic charge density introduced by N dopants.13,14 Kong et al. have studied boron doped graphene and demonstrated that the strong electron withdrawing ability of boron dopant facilitates adsorption of oxygen molecules and hence enhances the ORR activity.15 In a recent work by Lazar et al., the electronic properties of B and N doped graphene was correlated with the workfunction (Φ) of the B/N doped surfaces.16 Several studies are also undertaken on B,N co-doped graphitic systems17,18 and the synergistic coupling of B and N dopants resulting in enhanced activity has been identified. But in most studies, the occupation of pz orbital of active sites has been overlooked. A systematic study on the pz orbital occupation is important as this will also provide details on the charge transfer to/from the dopant to the neighboring active site in graphene based materials.19,20 Structural defects are yet another parameter, which affects the electronic properties of graphene and consequently its catalytic activity. There is experimental and theoretical evidence that divacancy (DV) defects are thermodynamically favorable and can promote the adsorption of small molecules and clusters onto the graphene surface.21,22 Among the various possible configurations of DV defects such as 555-777 (three pentagons and three heptagons), 5-8-5 (two pentagons and one octagon), 5555-6-7777 (four pentagons, one hexagon and four heptagons), the 555-777 DV defect configuration is found to be the most stable.23

It has been observed that the binding affinity of O atom on the catalytic surface can be used as a measure of ORR activity in both metal-based24 and graphene-based5 catalysts. During ORR, the potential-limiting step that determines the overpotential may either be proton/electron transfer to adsorbed O2 or to adsorbed O or OH. In N doped graphene, the removal of adsorbed O is found to be the potential-limiting step.25 This suggests that the intermediate O atom plays a decisive role in ORR activity. Unlike in metals, where the O atom prefers atop, fcc or hcp sites, the adsorbed O atom forms epoxy groups on a pristine graphene surface.26 Interestingly, when the pristine graphene surface is modified by external dopants, dopant induced charge redistribution results in different adsorption behaviors for the O atom. The O atom may prefer to retain its epoxy type bonding or revert to an atop (henceforth named as enolate) type bonding, which may be unlikely to form on a pristine surface.

In this study, employing nitrogen and boron atom/s as dopants, we disclose the role of epoxy and enolate configuration on the overpotential and ORR activity. Our results reveal that the preferred configuration of oxygen atom adsorption onto the graphene sheet varies remarkably depending on whether the dopant is n-type or p-type. It has been observed that the enolate configuration on N doped graphene is highly stable and may contribute to catalyst poisoning. Throughout this work, we designate the notation 2N for two N atoms doping, 2B for two boron atoms doping, B2N for one boron and two nitrogen atoms doping and similar notation for all other cases of doping. The origin of adsorption behavior of oxygen atom on DV defect graphene has been rationalized based on presence of localized pz states in the defective region and the occupation of pz orbital of active site after doping. The synergetic effect of heteroatom doping and 555-777 DV defect on the activity of graphene as electrocatalyst is discussed in detail in a different perspective. We also demonstrate that co-doping of graphene surface with B and N can significantly alter the type of O-bonding and we establish that the B2N surface has significant potential as an ORR electrocatalyst.

2. Computational details

Theoretical calculations were performed using spin polarized density functional theory as implemented in the Vienna ab-initio simulation package (VASP).27 The generalized gradient approximation (GGA) and Perdew–Burke–Ernzerhof (PBE)28 functional was employed to describe the exchange and correlation effects and the potentials of the atoms were described by the projected augmented wave (PAW)29 method. In order to incorporate the effects of long-range van der Waals attraction, the Grimme's method (DFT-D2) was used along with PBE functional (denoted as PBE + D).30 For calculations involving constraint energy minimizations, the CASTEP code was employed.31 A 5 × 5 supercell of graphene containing 50 carbon atoms was used in all simulations. A 555-777 defect was modeled by removing two atoms from the supercell followed by a bond rotation. A vacuum thickness of 15 Å was used in the direction perpendicular to the graphitic plane to avoid interaction between periodic images. It was found that a plane wave cut off energy of 500 eV was sufficient to give well-converged results. Brillouin zone sampling was done using a 5 × 5 × 1 Monkhorst–Pack grid. All the structures were relaxed until the total energy converged to less than 10−5 eV per atom and the maximum force converged to lower than 0.001 eV Å−1. The adsorption energy of the reactants on the surface was calculated by subtracting the total energy of the molecule placed far from the surface (8 Å) from the total energy of the molecule adsorbed on the surface.

3. Results and discussion

3.1 Pristine/(555-777)DV graphene and doped surface electronic structure

Substitutional doping of graphene results in remarkable modification of its electronic properties, deeming it a suitable material for catalytic applications. A comparison of the band structures of pristine graphene and nitrogen and boron doped graphene is shown in Fig. S1 of ESI. From the plot of band structure, it is apparent that the states near the Fermi level (π and π*) arise from the contribution of pz orbitals of the carbon atoms in the lattice. When the graphene lattice is doped with two nitrogen atoms (2N-P), the Fermi level shifts to the conduction band, a case of n-type doping, accompanied by a slight opening of the band gap,32 while the 2B doped in pristine graphene (2B-P) shifts the Fermi level towards valence band, a case of p-type doping. When co-doping of the graphene lattice occurs, the Fermi level shifts either upward or downward depending on whether the concentration of N or B is high. The 555-777 DV defect supercell consists of pentagons and heptagons in addition to the hexagonal rings as found in pristine graphene. The Fermi level (EF) of the DV is shifted toward lower energy as compared to pristine graphene, which is similar to that observed in the case of p-type doping.33 Two localized states, one in the conduction band and one in the valence band arise due to the defects. The band structure projected onto the pz orbitals of five different carbon atoms shared by different type of rings are shown in Fig. 1. These carbon atoms are named as C1 – shared by the three heptagons, C2 – two heptagons and a pentagon, C3 – a heptagon, hexagon and a pentagon C4 – two hexagons and a heptagon, C5 – two hexagons and a pentagon. The defect-related localized state in the conduction band (acceptor level) arises mainly due to the central atom C1, while atom C2 contributes to the defect-related localized state in the valence band (donor level). Examination of Fig. 1 reveals a general trend in the contribution of defect atoms to the band structure: all atoms in a pentagonal ring (atoms C2, C3, C5) contribute mostly to the states in the valence band near to EF irrespective of whether the atoms are also shared by heptagons or hexagons. Atoms C1 and C4 are shared by heptagons and not by any pentagons and hence their contribution to the states near EF in the conduction band is higher. Doping DV with nitrogen (2N-DV) or boron (2B-DV) shifts EF towards higher energy or lower energy respectively as observed in pristine case. The numerous possibilities of doping the DV with boron or nitrogen and the resulting stabilities are discussed in a previous work.34 Highest stability were obtained for systems having more number of N atoms than B. We consider here for simplicity that 2N/2B doping occurs at meta positions to the carbon atom at the centre of the defect (C1) in order to investigate the dopant-induced changes that occur at atoms C1 and C2 that are the major contributors to the localized defect states in the conduction and valence band respectively. To consider the effects of co-doping, the simplest system chosen is B2N, with a B atom replacing the central carbon atom and two N atoms replacing adjacent C2s.
image file: c5ra20127f-f1.tif
Fig. 1 Orbital projected atomic band structure of five different carbon atoms in DV (555-777) (a) different kind of atoms in the defective region of a DV graphene. The circles indicate the carbon atoms with same bonding environment. Band structure of DV graphene projected onto the pz orbital of (b) atom C1, (c) atom C2, (d) atom C3, (e) atom C4 and (f) atom C5. The radii of blue solid circles in the band structures plot indicate the strength of contribution of pz orbital.

3.2 Adsorption of atomic oxygen on pure/doped graphene: enolate vs. epoxide

We first study the adsorption of atomic oxygen on pure and doped graphene, as adsorbed oxygen is a key intermediate during ORR taking place either via an associative or a dissociative mechanism.25 It is well known that an oxygen atom prefers an epoxide configuration in pristine graphene bridging two carbon atoms of the graphene lattice.35,36 The epoxide-type bonding can be understood as follows: each carbon atom in the graphene lattice shares three in-plane sp2 hybrid (σ) orbitals with its neighbouring carbon atoms. In addition each carbon atom has half-filled pz orbital (π state), which mainly helps in anchoring the adsorbate. The approaching oxygen atom has six valence electrons out of which two can contribute in bonding and four remain as lone pairs. Upon adsorption, the π electrons of two adjacent carbon atoms of the graphene lattice are shared with the oxygen atom resulting in the formation of an epoxide C–O–C bond. Further to understand the binding strength we perform constrained potential energy calculations37 shown in Fig. 2a. We have obtained adsorption energy of −2.15 eV/−2.22 eV using PBE/PBE + D functional.
image file: c5ra20127f-f2.tif
Fig. 2 Constraint potential energy curves of (a) epoxy configuration on pristine graphene sheet (b) enolate configuration on 2N graphene, (c) epoxy configuration on 2B graphene (d) epoxy configuration on B2N. The reaction coordinate (Z) is chosen to be the distance of O from the active site of each of the surfaces. The pink, blue, grey and red balls represent the boron, nitrogen, carbon and oxygen atoms respectively.

Interestingly, upon doping the graphene sheet with nitrogen and/or boron, the bonding type of O atom is different. Since the addition of a single dopant may not significantly enhance the reactivity of graphene toward ORR,38 we have considered a minimum of two-atom doping to investigate the dopant-dependent O-atom bonding behavior. Two nitrogen atoms (2N) or boron atoms (2B) were placed in the meta position. The constrained potential energy curves for an O atom approaching the 2N doped graphene is shown in Fig. 2b. The N dopant carries a negative charge, and the incoming oxygen atom interacts with the C atom adjacent to the N dopant, in an enolate-type bonding. The nitrogen atom has five valence electrons, out of which three are involved in forming σ bonds with neighboring in-plane carbon atoms. The remaining two electrons of nitrogen occupy the pz orbital. In order to maintain graphene's aromaticity, N atom donates electron from its pz orbital to the graphene lattice (back-donation interaction). The neighbouring carbon atom in particular acquires electrons from N and its pz orbital becomes more than half-filled. At the same time, because of the electronegativity difference between C and N, the nitrogen atom is negatively charged while the central carbon atom acquires a positive charge (donation interaction).19,39 Hence, although Bader charge analysis indicates that the net charge on N atom is −1.22e and that on the central carbon atom is +0.73e, there is a transfer of pz electrons from N atom to the neighbouring C atom which is clearly visible from the pz projected band structure, shown in Fig. S3. Comparison of pz projected band structures of a carbon atom far from the dopant (Fig. S3a) the central C atom (Fig. S3b) clearly indicates that after doping, the contribution from the central C atom to the occupied band (near the Fermi level) is higher, suggesting that the pz orbital occupancy of central C atom is higher than a far carbon atom. An approaching oxygen atom does not bind to nitrogen because of the electrostatic repulsive force between its lone pair and negatively charged N atoms.39 Since the pz orbital of carbon atom is now more than half-filled, the O atom solely shares its bonding electrons with the carbon atom resulting in a stronger enolate-type C–O bond. The strongest binding site in this case is the central carbon atom between the nitrogen dopants with Ead = −4.36/−4.39 eV,37 as obtained from the PE curve. The enolate-type bonding behavior is observed in the other nearest carbon atoms surrounding the nitrogen atoms also, albeit with a smaller binding energy (Ead = −3.64/−3.74 eV).37 But a point to be noted is that when an oxygen atom is preadsorbed at central C atom, it prevents any other oxygen atoms to adsorb in enolate form and only epoxide-type binding of the second oxygen atom is possible.

In the case of boron doped graphene, 2B, the oxygen atom prefers to adsorb in an epoxide configuration, bridging a boron atom and a carbon atom. The potential energy curve is shown in Fig. 2c, indicating an adsorption energy of −3.60/−3.67 eV.37 These results are consistent with previous results by Ferrighi et al., who observed a bridge-type configuration of O atom on boron doped graphene using PBE functional.40 In contrast to the nitrogen atom, the boron atom acts as an acceptor, withdrawing pz electrons from the surrounding carbon atoms (via back donation interaction). This feature is evident from the pz-projected band structure of the central carbon atom between boron atoms, shown in Fig. S4b. The contribution from the central carbon atom to the unoccupied pz is higher, implying that it has lost its pz electrons to the boron atoms. The pz orbital of boron, which was initially empty (the three valence electrons of boron are involved in in-plane sp2 bonding and pz is initially vacant) becomes partially occupied and so an approaching oxygen atom shares its two bonding electrons with B and C atoms, resulting in an epoxide type B–O–C configuration. The potential energy curve for O adsorption on co-doped B2N surface is shown in Fig. 2d. The preferred site for oxygen atom adsorption is the bridge site between the boron atom and a neighboring carbon atom with an adsorption energy of −3.24/−3.32 eV. The adsorption of atomic oxygen on B3N-P is again an enolate and is rather stronger binding. From now the adsorption energies of different systems are compared based on the VASP results for simplicity (given in Table 1).

Table 1 Oxygen atom adsorption energies on doped graphene surfaces calculated using PAW potential and PBE functional
System Ead (O) (eV)
PBE PBE + D
Pure graphene −1.74 −1.83
Undoped DV −3.57 −3.64
2N-P −4.82 −4.93
2N-DV −4.21 −4.28
2B-P −4.28 −4.38
2B-DV −4.19 −4.26
B2N-P −3.21 −3.31
B2N-DV −4.37 −4.45
B3N-P −5.63 −5.73
B3N-DV −4.11 −4.19


The interaction of atomic oxygen on undoped DV graphene is remarkably higher than pristine graphene. The adsorption energy is −3.57 eV/−3.64 eV (see Table 1) and the oxygen atom again prefers an epoxide-type bonding bridging atoms C1 and C2. As discussed earlier, atom C2 has filled localized states in the valence band and hence can readily transfer electrons to the O atom. The O atom is oriented slightly toward atom C2 with O–C1 distance being 1.47 Å and O–C2 distance being 1.44 Å. Bader charge analysis further confirms this with the charge on C1 after O adsorption being less positive (+0.38e) than on C2 (+0.42e). This is contrary to the case of atomic oxygen adsorption on pristine graphene, where two C atoms transfer almost equal amounts of charge to atomic oxygen adsorbed in case of pure graphene. The electron localization function (ELF) plots and isosurfaces of atomic oxygen adsorbed on pristine graphene and undoped DV are shown in Fig. S2. The isovalue is set at 0.62. Two carbon atoms of pristine graphene have the same tendency to interact with an incoming oxygen atom as is evident from the symmetrical nature of C–O–C ELF plot. In the case of undoped DV, the presence of higher ELF values between C2–O when compared to C1–O, indicates that C2's tendency to hybridize with O is higher. Even though the preferred configuration and sites for oxygen atom binding on 2N, 2B and B2N doped DV graphene are identical to the undoped case, there is a dramatic change in the trend of adsorption energies from the doped pristine graphene to doped DV graphene. The calculated adsorption energies using PBE functional and PAW potential of VASP are tabulated in Table 1. Interestingly, inspection of Table 1 reveals that the enhancement of oxygen atom binding energies on DV upon doping is not as prominent as in the pure case. The adsorption energy of O on 2N-DV is −4.21 eV/−4.28 eV, which is smaller than the adsorption energy of O on 2N-P. The elongated bonds in the central defective region results in a weaker interaction between the pz orbital of a nitrogen atom and a pz orbital of a neighboring C atom and hence the amount of charge transferred from N to the π* orbital of graphene sheet is less. Also because of electronegativity difference, the net charge transfer from the carbon atoms to nitrogen dopant (Bader charge on N = −0.83e and on C1 = +0.59e) but is lesser than in the 2N-P case. The acceptor level induced by C1 shifts down or the Fermi level goes up compared to the undoped case, but is not completely filled (see Fig. S3e for pz orbital projected band structure of C1) and hence O adsorption in an enolate configuration on C1 site, results in a weaker binding compared to the 2N-P case. ELF contours and isosurfaces of oxygen atom adsorption on 2N-P and 2N-DV are plotted and shown in Fig. S6. The isovalue is set to 0.62. The covalency of the C–O interaction can be seen clearly in both the surfaces from the presence of ELF maxima between C and O atoms and also from the bonding ELF lobe between C and O. The ELF value at the C–O bond is however greater in 2N-P than in 2N-DV, suggesting stronger covalency and hence higher C–O bond strength.

For 2B-DV graphene the adsorption energy of atomic oxygen is −4.19 eV/−4.26 eV with epoxy configuration. The epoxide type bonding on this surface implies that both C1 and boron atoms (now replacing C2) take part in bonding, resulting in the adsorption energy being only slightly smaller than the 2B-P case. The ELF contour of epoxide on 2B-P and 2B-DV are shown in Fig. S7(a) and (b) respectively. The presence of ELF maximum between both C,O and B,O signifies that both C and B atoms of the graphene lattice take part in bonding with O. The higher electronegativity difference between B and O as compared to B and C makes the boron atom transfer its charge to the incoming O atom and the in-plane B–C bond is subsequently weakened, as is evident from the ELF plot. The binding energy of atomic oxygen on co-doped B2N-DV system is −4.37/−4.45 eV. This enhanced binding energy when compared to B2N-P can be understood by comparing the ELF of these systems (shown in Fig. 3). The observation of very low ELF values in B2N-P between C and O signifies lesser contribution of C to the O atom binding, resulting in lesser adsorption energy. The B2N-DV however has stronger boron atom binding to the adsorbate, and together with the contribution from C2, the overall O atom binding energy is stabilized, amounting it to be −4.37/−4.45 eV. Bader charge analysis confirms this fact, with the oxygen atom gaining 1.12e from B2N-DV, while it acquires 1.07e from B2N-P. The pz-orbital projected band structure of atoms in B2N-P and B2N-DV are shown in Fig. S5. The lesser contribution to the overall pz from the boron and an adjacent carbon atom (see Fig. S5a and b) in the case of B2N-P may provide evidence to the reduction in the binding energy of atomic oxygen. The B2N-DV system, however has strong contribution from C2 to the overall pz states (see Fig. S5e), enhancing its binding ability. The B3N-DV system anchors the oxygen atom in an enolate configuration at the B site (now replacing C1) and the adsorption energy is −4.11/−4.19 eV, which is lesser than B3N-P. The ELF plots (see Fig. S8), however show almost the same degree of covalency for O atom binding, indicating that the ionicity plays a decisive role in determining the adsorption strength. In fact, the Bader charges, reveal that the charge transferred from B3N-P to O (−1.31e) is higher than that of B3N-DV to O (−1.24e), explaining the higher binding in the former case. Hence, from the results of B/N doped pristine and DV graphene it is evident that the strength of O adsorption is determined by the covalency and ionic binding with C and B atom and occupation of pz orbitals of active sites, and on the nature of localized states in the defective region.


image file: c5ra20127f-f3.tif
Fig. 3 Electron Localization Function (ELF) contours and isosurface (isovalue = 0.62) of epoxide configured O atom adsorbed on (a) B2N-P (b) B2N-DV surfaces.

3.3 Adsorption of molecular oxygen

The adsorption of molecular oxygen is a major step in ORR. Oxygen molecule physisorbs on the pristine graphene surface with an adsorption energy of −0.03/−0.15 eV as obtained using PBE/PBE + D functional. On DV graphene without dopants, the adsorption energy of O2 is −0.17/−0.29 eV. On 2N-P, O2 is adsorbed in an end-on fashion on the central C site with adsorption energy of −0.21 eV/−0.39 eV. In the case of 2N-DV, the adsorption energy of O2 on C1 is relatively weaker with Ead = 0.012/−0.089 eV. This is again unanticipated as defects in graphene have almost always been attributed to higher adsorption capacity.41 But it has to be noted that in the previous works, the higher binding affinities have been correlated with either the presence of dangling bonds (in the case of monovancies/simple divacancies) or with the positive spin density around the active sites (in the case of Stone–Wales defects).41,42 The lower O2 binding in 2N-DV is consistent with the discussion in the preceding section that the localized conduction band states at C1 enable it to be more electron withdrawing than donating. In order to gain further insight on the defect-induced lowering in binding energy of 2N-DV, the pz orbital projected density of states (DOS) of the central carbon atom and a neighboring nitrogen atom in 2N-P and 2N-DV before and after the adsorption of O2 are plotted and are shown in Fig. 4. The p orbital projected DOS of the incoming oxygen molecule are also shown to understand the nature of adsorption. Comparison of Fig. 4a & c and b & d, reveals that the nitrogen atom also plays a role in donating electrons to the oxygen molecule via the central C atom. Thus after adsorption, the nitrogen pz states of 2N-P shift towards the left relative to the Fermi level, is indicating charge depletion from the N atom. The amount of charge transferred is however lesser in the case of 2N-DV than in 2N-P. This is because the Fermi level lies at the slightly occupied π* states in the case of 2N-P (EF(2N-P)EF(pristine) = 0.69 eV), while it lies more or less at the Dirac cone in 2N-DV case, with EF(2N-DV)EF(pristine) = −0.03 eV (note that the Fermi level of DV without dopants lies at the left of Dirac cone i.e., EF(undoped-DV)EF(pristine) = −0.66 eV). A recent theoretical study also hints the possible dependence of the activity of doped carbon on the occupation of π* orbital of nitrogen dopant.38 In fact, Bader charge analysis confirms this fact, with the charge on each N atom of pristine 2N after O2 adsorption being −1.15e, which is +0.07e lesser than the charge on N without O2 adsorption and on 2N-DV being −0.83e, which is the same as the charge on N without O2 adsorption. The carbon pz states of 2N-P near the Fermi level hybridize with the p states of oxygen molecule, resulting in the broadening of O2 molecular states, and occupation of 2π* of oxygen. In the case of 2N-DV, however, the O2 molecule retains the discrete nature of peaks, suggesting that its molecular orbitals are almost unaffected. The central carbon atom of 2N-P becomes more positive by donating electrons, with its Bader charge being +1.02e and on the oxygen molecule is −0.91e, indicating the formation of a strong C–O bond.
image file: c5ra20127f-f4.tif
Fig. 4 Partial density of states of surface atoms and O2 molecule, (a) and (c) before and after O2 adsorption on 2N-P, (b) and (d) before and after O2 adsorption on DV-2N. The red and green shaded plots represent the pz orbital projected density of states of the central carbon atom and a neighboring nitrogen dopant respectively. The blue plot indicates the p states of the oxygen molecule.

Oxygen molecule adsorbs less strongly on both 2B-P and 2B-DV, with the adsorption energies being −0.028/−0.155 eV and 0.069/−0.07 eV respectively. This is consistent with previous theoretical estimates that the energy cost for the formation of adsorbed oxygen molecule is higher in B doped graphene than in N doped graphene.40 In the case of B2N, an oxygen molecule prefers to adsorb on a B site with an adsorption energy of −0.349/−0.516 eV in pristine case and 0.056/−0.096 eV in the DV case. The pz orbital projected DOS of the central boron atom and a neighboring nitrogen atom in B2N-P and B2N-DV and the p states of the incoming oxygen molecule before and after adsorption are shown in the Fig. S9. More importantly, the shift in the nitrogen pz states can be observed along with the hybridization of boron pz and O2 p states. Bader charge analysis indicates that the charge on each N atom of B2N-P after adsorption is −1.40e, which is +0.07e lesser than the charge on N without O2 adsorption and on B2N-DV is −1.15e, which is +0.05e lesser than the charge on N without O2 adsorption.

As a final case, we also test the adsorption of O2 on B3N, i.e. a boron atom surrounded entirely by nitrogen. The adsorption energy in B3N-P, with O2 molecule on B site is −1.19/−1.38 eV. In B3N-DV, the C1 site is replaced by B and the adjacent C2 sites are now nitrogen atoms. The adsorption energy is −0.58/−0.74 eV, which is again remarkably lesser than in the B3N-P case. The DOS before and after O2 adsorption is shown in Fig. S10. There is clear indication that the higher adsorption energy in B3N-P is due to the higher occupation of nitrogen pz states located near the Fermi level. The O2 molecular adsorption energies and Bader charges on active sites before and after O2 adsorption are summarized in Table 2. Based on the above discussions, it can be concluded that the nature of the localized defect state at the active site, the position of the π state of the nitrogen (dopant) relative to the Fermi level and hence its ability to transfer charge from its pz orbital (via the active site) to the adsorbate synergistically contribute in determining the adsorption of atomic and molecular oxygen.

Table 2 Bader charges on active sites of doped graphene before and after adsorption of molecular oxygen and oxygen molecule adsorption energies
System Site Bader charge (e) O2 adsorption energy (eV)
Before adsorption After adsorption PBE PBE + D
2N-P N −1.22 −1.15 −0.21 −0.39
C +0.73 +1.02
2N-DV N −0.83 −0.83 0.012 −0.089
C1 +0.59 +0.59
2B-P B +1.83 +1.83 −0.028 −0.155
C −1.18 −1.18
2B-DV B +1.29 +1.29 0.069 −0.07
C −1.83 −1.83
B2N-P B +1.97 +2.11 −0.349 −0.516
N −1.47 −1.40
B2N-DV B +1.95 +2.04 0.056 −0.096
N −1.20 −1.15
B3N-P B +2.10 +2.18 −1.19 −1.38
N 1.50 1.44
B3N-DV B +2.07 +2.12 −0.58 −0.74
N −1.26 −1.17


3.4 Catalytic capabilities-oxygen reduction reaction

The potential of the chosen graphene based materials as ORR electrocatalysts is studied for their applicability in fuel cells. The ORR free energy profiles of the chosen systems are plotted and shown in Fig. 5. Here, we adopt the method outlined by Nørskov et al.24 to obtain the free energies of the intermediates of the reaction. We assume that ‘H+ + e’ is in equilibrium with ½H2, at pH = 0 and 0 V vs. standard hydrogen electrode (SHE). Each reaction step involves the transfer of a coupled proton–electron pair (CPET) and the applied potential is considered through a shift in Fermi level of electrode.43 The free energy value for each intermediate step is shifted by −eU, where U is the applied potential. The calculations were performed assuming alkaline conditions, i.e., at pH = 14, making use the scheme described in the literature.44 The equilibrium potential, denoted as U0, is hence 0.40 V vs. SHE. The free energy of water in the liquid phase was estimated as
image file: c5ra20127f-t1.tif
where R is the gas constant, T = 298.15 K, p = 0.035 bar, p0 = 1 bar and GH2O(g) is the DFT free energy of an isolated water molecule. The free energy of O2(g) was obtained indirectly as GO2(g) = 2GH2O − 2GH2 + 4.92 eV in order to fix the total free energy of ORR at 4.92 eV. The free energy of OH ion was derived as
image file: c5ra20127f-t2.tif

image file: c5ra20127f-f5.tif
Fig. 5 Free energy profile considering ORR intermediates on doped pristine graphene (a) 2N-P, (b) 2B-P, (c) B2N-P and (d) B3N-P. The dotted lines are to guide the eye.

In alkaline conditions, the reduction of O2 occurs as O2 + 2H2O(l) + 4e → 4OH, with each coupled proton–electron transfer step being:

O2 + 2H2O(l) + 4e + * → OOH* + OH + H2O(l) + 3e

OOH* + OH + H2O(l) + 3e → O* + 2OH + H2O + 2e

O* + 2OH + H2O + 2e → OH* + 3OH + e

OH* + 3OH + e → * + 4OH
where * denotes the active free site available for a molecule or an intermediate to adsorb. In order to construct the free energy profile, the change in free energy profile between consecutive steps is taken to be ΔG = ΔETΔSneU where ΔE represents the change in enthalpy taken to be equivalent to the DFT total energy difference and ΔS is the change in the entropy. The change in entropy, ΔS was acquired from a physical chemistry table, assuming H2, and H2O in gaseous form at ordinary temperature and pressure.45 The entropy of the adsorbed state of the molecules is considered negligible compared to that of gas phase. We also emphasize here that the reaction intermediates considered in this study and the number of protons and electrons transferred in each step can be approximated to be similar in acidic medium. Thus, when referenced to the reversible hydrogen electrode (RHE) scale, the overpotential and operating potential are insensitive to the pH of the electrolytic medium.46

The ORR profile of doped pristine graphene is examined first in detail (see Scheme 1 for a schematic of the ORR steps). The strong tendency of 2N-P to adsorb O in enolate configuration is reflected clearly in the free energy profile (see Fig. 5a). At zero cell potential, the formation of OOH* and the reduction of O* to OH* are the most endothermic and compete in determining the onset potential, with the latter step being slightly more endothermic than the former. At equilibrium potential, the maximum free energy difference in the reaction pathway is considered to be a measure of the overpotential (η) and the corresponding step is the potential-determining step (PDS). At an equilibrium cell potential of 0.4 V, the formation of OOH* is endothermic by 1.07 eV and reduction of O* to OH* is uphill by 1.09 eV, hence η = 1.09 V, with O* to OH* conversion being the PDS. The potential at which all steps are downhill in energy (onset potential) is hence −0.69 V (0.14 V) vs. SHE (RHE). In the case of 2B (Fig. 5b), weak adsorption of O2 results in the first step being highly endothermic. Even at a cell potential of −0.83 V, the first step is endothermic by 0.25 eV, hinting that this surface may not be efficient in catalyzing the ORR, requiring a high overpotential (note that a higher dopant concentration or the presence of dispersed dopants may aid in reducing the barrier, but this is beyond the scope of the present work).


image file: c5ra20127f-s1.tif
Scheme 1 Reaction steps during four electrons ORR process. The brown slab represents the graphene surface. Oxygen and hydrogen atoms are denoted with red and blue spheres respectively.

Fig. 5c shows the free energy profile of ORR on B2N. Results from the preceding sections reveal that the binding of O2 and O are not too strong nor too weak as compared to the 2N and 2B cases. This results in all the ORR steps being less endothermic in energy when compared to the 2N and 2B, with the reduction of OH* to OH being the PDS, requiring the highest barrier of 0.81 eV at equilibrium cell potential of 0.40 V. The operating potential is hence −0.41 V (0.42 V) vs. SHE (RHE), which is the highest among the systems studied.

As a final case the ORR profile on the system having the highest O2 binding, viz. B3N is plotted and shown in Fig. 5d. The strong tendency to adsorb O is again manifested in the free energy profile, with the reduction of OOH* to O* being highly exothermic which makes the protonation of O* to OH* potential-limiting. The overpotential in this case can be identified to be 0.93 V, with the operating potential being −0.53 (0.29) V vs. SHE (RHE).

Now we examine the ORR profile of doped DV systems in detail. The constructed pathways are shown in Fig. 6. The lower binding affinities of DV systems toward O2 and O when compared to pure systems can be clearly understood from the free energy profiles. In the case of ORR on 2N-DV, shown in Fig. 6a, the lesser binding strength of oxygen atom in enolate configuration as compared to 2N-P makes the hydrogenation of OOH* to be the PDS. At U = 0 V, this step is thermodynamically endothermic by 0.643 eV. When the potential is corrected to U = 0.4 V, the maximum free energy difference in the reaction pathway is 1.04 eV and at an onset potential of −0.64 V (0.19 V) vs. SHE (RHE), all steps are downhill in energy. In the case of 2B-DV, the formation of OOH* intermediate requires the highest energy, and at U = 0 V, this step is uphill by 0.83 eV as evident from the free energy profile shown in Fig. 6b. At the equilibrium potential of 0.40 V, the formation of OOH* is the PDS, that is still uphill in energy by 1.23 eV. This implies that 2B-DV system's inability to bind O2 makes this system less efficient in catalyzing the ORR. ORR pathways on the B2N-DV surface at varying potentials are shown in Fig. 6c. The potential determining step is the formation of OOH*, requiring an overpotential of 0.94 V at U0 = 0.4 V. The ORR proceeds at an on-set potential of −0.54 V (0.28 V). The B3N-DV system on the other hand, binds O2 moderately and at U0 = 0.4 V, the first step is only slightly endothermic by 0.26 eV. But the removal of OH* from the surface is the PDS, requiring a relatively high barrier of 1.06 eV to be surmounted. Hence the overpotential is again high, limiting the ORR kinetics and an onset potential of −0.65 (0.17) V is required for all steps to become downhill and the ORR to proceed (see Fig. 6d). The potential-determining steps, overpotential and operating potential for ORR on the investigated graphitic systems are tabulated in Table 3.


image file: c5ra20127f-f6.tif
Fig. 6 Free energy profile considering ORR intermediates on doped pristine graphene (a) 2N-DV, (b) 2B-DV, (c) B2N-DV and (d) B3N-DV. U represents the applied potential. The dotted lines are to guide the eye.
Table 3 The potential-determining steps, overpotential and operating potential of the investigated graphitic systems
System PDS* Overpotential (V) Operating potential SHE (RHE) (V)
2N-P 3 1.1 −0.69 (0.14)
2N-DV 1 1.04 −0.64 (0.19)
2B-P 1 1.48
2B-DV 1 1.23
B2N-P 4 0.81 −0.41 (0.42)
B2N-DV 1 0.94 −0.54 (0.28)
B3N-P 3 0.93 −0.53 (0.29)
B3N-DV 4 1.06 −0.65 (0.17)


In addition to the 555-777 DV defect, the formation of other low energy defects may also be possible on a graphene sheet. Single vacancies (5–9 defects, henceforth named as SV) are one class of such defects, having formation energies in the range 7.1–7.4 eV (ref. 47). However, the presence of SV results in dangling sp2 bonds of the carbon atoms near the vacancy and unbalance between spin polarized π-orbitals.47,48 This would undoubtedly result in higher adsorption energies, as described in previous works.41 Our calculations confirm the same, with an oxygen molecule dissociating almost spontaneously upon adsorption on a SV defect. However, doping the SV with boron and nitrogen (B2N-SV) retains the associative adsorption of the O2 molecule, albeit with a strong adsorption energy (Ea = −2.82 eV). The optimized structure post O2 adsorption is shown in Fig. S11(a). The complete ORR profile is shown in Fig. S11(b). The strong adsorption of O2 makes the removal of adsorbed OH difficult implying that B2N-SV defect is less suited for ORR applications.

3.5 CO tolerance

We also test the capability of the graphitic systems to resist CO poisoning, as CO crossover and poisoning is one of the major hurdles faced by Pt-based catalysts. All the systems considered have very low binding affinities toward CO. This is in accordance with experimental observations that doped graphitic systems possess excellent resistance to CO crossover effects and catalyst poisoning.4,49 The calculated CO adsorption energies on chosen systems are tabulated in Table S2. The lack of transferring of charge from 2p orbital in graphene based systems indicates no interaction between COLUMO and the surface states, resulting in no back-bonding π interaction. The COHOMO on the other hand, lies deeper inside relative to the Fermi level, indicating that it cannot easily transfer the electrons to the surface. The partial density of states of CO molecule and B3N-P surface (which has the highest O2 adsorption energy) is shown in Fig. S12.

4. Conclusions

Our computational results reveal the important roles played by enolate and epoxy configuration on the overpotential of the ORR in fuel cells. Doping of graphene with boron and/or nitrogen alters the preferred adsorption configuration either enolate or epoxy of oxygen atom onto the graphene sheet. The enolate type binding is stronger compare to the epoxy with adsorption energy −4.82 eV/−4.93 eV in 2N-P. The enolate bonding have good degree of covalency with higher charge on O atom as confirmed by Bader charge analysis and ELF value in the C–O bonded region. We predict that enolate configuration may poison the catalytic surface contributing to a high overpotential of 1.1 V for the reduction of O* to OH*. We associate the origin of enolate and epoxy configuration based on the occupation of pz orbitals of active sites after doping. Investigation of the electronic structure at the vicinity of the DV defect reveals that the presence of localized pz state in the conduction band (valence band) at C1 (C2) reduces (enhances) its tendency to adsorb oxygen. The adsorption of molecular oxygen was also investigated in detail and the binding strengths were found to be lesser in the DV case. The B2N-P system has moderate atomic and molecular oxygen binding energies of −3.21/−3.31 eV and −0.34/−0.51 eV respectively. The ORR activities of the chosen systems were studied using the free energy profiles and a relationship is established between the presence of enolate/epoxy groups and the ORR overpotential. The B2N-P surface has the lowest overpotential (0.81 V) confirming experimental findings that B,N co-doping enhances the ORR activity.

Acknowledgements

RT and SS thank Science and Engineering Research Board (SERB), India for the financial support (Grant no. SB/FTP/PS028/2013). RT and SS also thank SRM Research Institute, SRM University for providing supercomputing facility.

References

  1. Y. Liang, Y. Li, H. Wang, J. Zhou, J. Wang, T. Regier and H. Dai, Nat. Mater., 2011, 10, 780–786 CrossRef CAS PubMed.
  2. D. Shin, S. Sinthika, M. Choi, R. Thapa and N. Park, ACS Catal., 2014, 4, 4074–4080 CrossRef CAS.
  3. R. Cao, R. Thapa, H. Kim, X. Xu, M. G. Kim, Q. Li, N. Park, M. Liu and J. Cho, Nat. Commun., 2013, 4, 2076 Search PubMed.
  4. L. Qu, Y. Liu, J.-B. Baek and L. Dai, ACS Nano, 2010, 4, 1321–1326 CrossRef CAS PubMed.
  5. Y. Li, W. Zhou, H. Wang, L. Xie, Y. Liang, F. Wei, J.-C. Idrobo, S. J. Pennycook and H. Dai, Nat. Nanotechnol., 2012, 7, 394–400 CrossRef CAS PubMed.
  6. Y. Zhang, J. Ge, L. Wang, D. Wang, F. Ding, X. Tao and W. Chen, Sci. Rep., 2013, 3, 2771 Search PubMed.
  7. J. Y. Cheon, J. H. Kim, J. H. Kim, K. C. Goddeti, J. Y. Park and S. H. Joo, J. Am. Chem. Soc., 2014, 136, 8875–8878 CrossRef CAS PubMed.
  8. J. Greeley, I. E. L. Stephens, A. S. Bondarenko, T. P. Johansson, H. A. Hansen, T. F. Jaramillo, J. Rossmeisl, I. Chorkendorff and J. K. Nørskov, Nat. Chem., 2009, 1, 552–556 CrossRef CAS PubMed.
  9. W. Liang, J. Chen, Y. Liu and S. Chen, ACS Catal., 2014, 4, 4170–4177 CrossRef CAS.
  10. S. Kattel, P. Atanassov and B. Kiefer, J. Mater. Chem. A, 2014, 2, 10273–10279 CAS.
  11. J. Dai, J. Yuan and P. Giannozzi, Appl. Phys. Lett., 2009, 95, 232105 CrossRef.
  12. D. W. Boukhvalov and Y.-W. Sona, Nanoscale, 2012, 4, 417–420 RSC.
  13. L. Zhang and Z. Xia, J. Phys. Chem. C, 2011, 115, 11170–11176 CAS.
  14. L. Zhang, J. Niu, L. Dai and Z. Xia, Langmuir, 2012, 28, 7542–7550 CrossRef CAS PubMed.
  15. X. Kong, Q. Chen and Z. Sun, ChemPhysChem, 2013, 14, 514–519 CrossRef CAS PubMed.
  16. P. Lazar, R. Zbořil, M. Pumerab and M. Otyepka, Phys. Chem. Chem. Phys., 2014, 16, 14231–14235 RSC.
  17. Y. Zheng, Y. Jiao, L. Ge, M. Jaroniec and S. Z. Qiao, Angew. Chem., 2013, 125, 3192–3198 CrossRef.
  18. X. Fan, W. T. Zhenga and J.-L. Kuob, RSC Adv., 2013, 3, 5498–5505 RSC.
  19. C. L. Muhich, J. Y. Westcott, T. C. Morris, A. W. Weimer and C. B. Musgrave, J. Phys. Chem. C, 2013, 117, 10523–10535 CAS.
  20. L. Yang, S. Jiang, Y. Zhao, L. Zhu, S. Chen, X. Wang, Q. Wu, J. Ma, Y. Ma and Z. Hu, Angew. Chem., Int. Ed., 2011, 50, 7132–7135 CrossRef CAS PubMed.
  21. B. Sanyal, O. Eriksson, U. Jansson and H. Grennberg, Phys. Rev. B: Condens. Matter Mater. Phys., 2009, 79, 113409 CrossRef.
  22. J. Kotakoski, C. Mangler and J. C. Meyer, Nat. Commun., 2014, 5, 3991 CAS.
  23. G.-D. Lee, C. Z. Wang, E. Yoon, N.-M. Hwang, D.-Y. Kim and K. M. Ho, Phys. Rev. Lett., 2005, 95, 205501 CrossRef PubMed.
  24. J. K. Nørskov, J. Rossmeisl, A. Logadottir and L. Lindqvist, J. Phys. Chem. B, 2004, 108, 17886–17892 CrossRef.
  25. L. Yu, X. Pan, X. Cao, P. Hu and X. Bao, J. Catal., 2011, 282, 183–190 CrossRef CAS.
  26. Z. Šljivančanin, A. S. Milošević, Z. S. Popović and F. R. Vukajlović, Carbon, 2013, 54, 482–488 CrossRef.
  27. G. Kresse and J. Furthmüller, Comput. Mater. Sci., 1996, 6, 15–50 CrossRef CAS.
  28. J. P. Perdew, K. Burke and M. Ernzerhof, Phys. Rev. Lett., 1996, 77, 3865–3868 CrossRef CAS PubMed.
  29. P. E. Blöchl, Phys. Rev. B: Condens. Matter Mater. Phys., 1994, 50, 17953–17979 CrossRef.
  30. S. J. Grimme, Comput. Chem., 2006, 27, 1787 CrossRef CAS PubMed.
  31. M. D. Segall, P. J. D. Lindan, M. J. Probert, C. J. Pickard, P. J. Hasnip, S. J. Clark and M. C. Payne, J. Phys.: Condens. Matter, 2002, 14, 2717–2744 CrossRef CAS.
  32. Z. Hou, X. Wang, T. Ikeda, K. Terakura, M. Oshima and M. Kakimoto, Phys. Rev. B: Condens. Matter Mater. Phys., 2013, 87, 165401 CrossRef.
  33. S. Chakrabarty, A. H. M. A. Wasey, R. Thapa and G. P. Das, AIP Adv., 2015, 5, 087163 CrossRef.
  34. D. Sen, R. Thapa and K. K. Chattopadhyay, ChemPhysChem, 2014, 15, 2542–2549 CrossRef CAS PubMed.
  35. S. Zhou and A. Bongiorno, Sci. Rep., 2013, 3, 2484 Search PubMed.
  36. L. R. Radovica, A. B. Silva-Tapiab and F. Vallejos-Burgos, Carbon, 2011, 49, 4218–4225 CrossRef.
  37. Constrained potential energy curves were obtained using CASTEP code by imposing nonlinear constraints. To obtain a point in the curve, the interatomic distance between the active site on the surface and the approaching atom was fixed and all other coordinates were relaxed. In Table 1 we provide the binding energies of O atom with all systems considered in this work, as calculated using VASP code.
  38. S. Ni, Z. Lia and J. Yang, Nanoscale, 2012, 4, 1184–1189 RSC.
  39. D. Kwak, A. Khetan, S. Noh, H. Pitsch and B. Han, ChemCatChem, 2014, 6, 2662–2670 CrossRef CAS.
  40. L. Ferrighi, M. Datteo and C. D. Valentin, J. Phys. Chem. C, 2014, 118, 223–230 CAS.
  41. X. Qi, X. Guo and C. Zheng, Appl. Surf. Sci., 2012, 259, 195–200 CrossRef CAS.
  42. L. Zhang, Q. Xu, J. Niua and Z. Xia, Phys. Chem. Chem. Phys., 2015, 17, 16733–16743 RSC.
  43. J. A. Keith and T. Jacob, Angew. Chem., Int. Ed., 2010, 49, 9521–9525 CrossRef CAS PubMed.
  44. Y. Jiao, Y. Zheng, M. Jaroniec and S. Z. Qiao, J. Am. Chem. Soc., 2014, 136, 4394–4403 CrossRef CAS PubMed.
  45. P. Atkins and J. Paula, in Atkins’ Physical Chemistry, W. H. Freeman and Company, New York, 8th edn, 2006, pp. 993–1001 Search PubMed.
  46. A. Holewinski, J. C. Idrobo and S. Linic, Nat. Chem., 2014, 6, 828–834 CrossRef CAS PubMed.
  47. R. Faccio, L. Fernández-Werner, H. Pardo, C. Goyenola, O. N. Ventura and Á. W. Mombrú, J. Phys. Chem. C, 2010, 114, 18961–18971 CAS.
  48. P. Francis, C. Majumder and S. V. Ghaisas, Carbon, 2015, 91, 358–369 CrossRef CAS.
  49. Z.-H. Sheng, H.-L. Gao, W.-J. Bao, F.-B. Wang and X.-H. Xia, J. Mater. Chem., 2012, 22, 390–395 RSC.

Footnote

Electronic supplementary information (ESI) available: Band structures and ELF plots for most of the systems are shown. pz orbital projected band structures of various systems are provided in detail. Full Bader charge analysis has been tabulated. CO adsorption analysis on various graphene based materials to apprehend possible poisoning. See DOI: 10.1039/c5ra20127f

This journal is © The Royal Society of Chemistry 2015