
 Open Access Article
 This Open Access Article is licensed under a
 Creative Commons Attribution 3.0 Unported Licence
Dual-compartment nanofibres: separation of two highly reactive components in close vicinity†
Ann-Christin
Bijlard
ab,
Anke
Kaltbeitzel
a,
Yuri
Avlasevich
a,
Daniel
Crespy
a,
Marc
Hamm
b,
Katharina
Landfester
a and
Andreas
Taden
 *ab
*ab
aMax Planck Institute for Polymer Research, Ackermannweg, 10, 55128 Mainz, Germany. E-mail: andreas.taden@henkel.com; taden@mpip-mainz.de
bHenkel AG & Co. KGaA, Henkelstr. 67, 40589 Düsseldorf, Germany
First published on 9th November 2015
Abstract
Dual-compartment nanofibres separating two highly reactive components in close vicinity are investigated. The study is intended as a non-classical approach for the control of reaction latency in colloidal systems. An epoxide resin and a hydrophobic polyamine which react readily at low temperatures are chosen as model compounds. Colloid electrospinning with PVA as the confining matrix is used for the immobilization of both in separate compartments. Uniform fibres are produced with a matrix/colloid weight ratio of 3/1. The internal fibre morphology was investigated via dual-colour stimulated emission depletion (STED) microscopy and TEM. The results show a statistical distribution of epoxy- and amine-containing compartments and indicate average particle–particle distances of <100 nm, which is supported by computations. The fibres are highly storage stable under ambient conditions and yet allow for efficient crosslinking and self-healing. The curing reaction can be initiated via thermal or mechanical stimuli, as demonstrated by electron microscopy and electrochemical testing of fibre containing coatings. The reactivity and latency for reaction is furthermore proven by calorimetric and chromatographic methods.
Introduction
Electrospinning is a versatile tool to fabricate all kinds of 1D micro- or nanostructures with possible applications ranging from tissue engineering to drug delivery, filters and energy applications.1–6 It is possible to encapsulate various loads like drugs, peptides or nanoparticles into such fibre structures.7,8 In many cases, the fibre matrix is used for triggered delivery through various stimuli. One method to add additional functionalities to the nanofibres is by assembling them into hierarchical 3D structures by crosslinking in situ and the resulting constructions can be used for protein adsorption or for separation of oil/water emulsions.9–11 Another option is colloid-electrospinning. Usually, the fibres are spun from a dispersion of the dissolved polymer which forms the fibre matrix and the colloids in water. Recent publications report the successful preparation of multi-compartment nanofibres with various incorporated functional nanoparticles.12,13 The advantages of the technique include high catalytic activity or supported functional nanoparticles.14,15 The incorporation of particles can not only add functionality to the fibres, but can also significantly alter their morphology and properties.16 For example, also Yuan et al. studied the morphology changes of PVA fibres as confining template for the assembly of polystyrene nanoparticles with different sizes and concentrations.17 With this technique, nanofibres can be used for protection of the load from environmental influences like oxygen due to improved barrier properties caused by the double encapsulation offered by the wall of the nanocapsules and the fibres matrix.18 Also, encapsulation of different payloads as separated domains as well as multi-agent delivery from nanofibres was shown.19,20However, in the above-mentioned examples, the encapsulated components were not reactive towards each other. In our approach, we tried to encapsulate two components that are highly reactive in one electrospun fibre. We aimed at separating the two compartments on the nanoscale by the polymeric fibre matrix and to immobilize them within this state. Upon stimuli-induced contact, both compartments shall immediately react. The possibility to create a high concentration of both components in close vicinity inside these dual-component fibres can provide very short diffusion distances for polymerization which can be very interesting for self-healing applications. Many examples of autonomous self-healing materials make use of two component systems that form thermosetting polymers either directly upon contact or by catalysis.21–25 One key issue is the dual challenge of providing a spatial separation of both components while at the same time facilitating their contact when the self-healing reaction is wanted.26–28 Often, mechanical stress or temperature increase is used as a trigger for the initiation of the crosslinking reaction.29,30 Epoxy–amine curing has already received much attention in this field because the high reactivity, dense crosslinking ability and strong adhesion properties of epoxy/amine-systems can provide significant advantages for self-healing.31–33 It would be beneficial to assemble and keep these two components in close vicinity and we demonstrate herein that this can be realized by the colloid-electrospinning approach. At the same time, it is mandatory to prevent premature crosslinking which may be accomplished by the surrounding fibre matrix, as investigated throughout this work. In theory, the nanoscale dimensions and a statistical distribution of both reagents provide a favourable stoichiometry for reaction and therefore enable efficient crosslinking. The self-healing reaction can be triggered either upon temperature increase or by mechanical stress. We chose a dispersible epoxide E and a room temperature-reactive amine as counterpart A for the encapsulation in polyvinyl alcohol (PVA) fibres as confining matrix (Fig. 1).
 | ||
Fig. 1 Schematic representation of the colloid electrospinning process and the statistical distribution of the epoxy and amine compartments in the obtained nanofibres on basis of the PVA–EA 3![[thin space (1/6-em)]](https://www.rsc.org/images/entities/char_2009.gif) :1 sample. PVA serves as matrix polymer which keeps the reactive colloidal domains separated. Furthermore, the simplified chemical structures of the epoxy and amine are displayed. :1 sample. PVA serves as matrix polymer which keeps the reactive colloidal domains separated. Furthermore, the simplified chemical structures of the epoxy and amine are displayed. | ||
Experimental
Materials
The phenalkamine NX5454 was kindly provided by Cardolite Corp. and purified by extracting 3 times with water (AHEW = 220 g eq.−1). The synthesis and properties of the epoxide surfactant used for emulsification can be found in our previous work.34 Ethylacetate (99%), calcium chloride sol. (3 M), Nafion per-fluorinated resin sol. (5 wt%), and glutaraldehyde (25% aq. sol.) were obtained from Sigma Aldrich, chloroform (99%) was obtained from Merck Chemicals, hexadecane (99%) from Acros Organics, the Jeffamine (D-400) from Huntsman, polyvinyl alcohol (PVA, Mw = 130000, 88 mol% hydrolysis) from Kuraray Europe, bisphenol A-diglycidylether (BADGE, EEW = 187 g eq.−1) from Dow Chemical were used as received.
Preparation of the hybrid EA dispersion
The dispersed phase contained 10 g of the amine or the epoxide and 400 mg hexadecane as ultrahydrophobe dissolved in 10 g of ethylacetate. For the STED experiments, 2 mg of the diphenylperylene (amine emulsion) or 2 mg of the BODIPY (epoxy emulsion) were added. The dispersed phase was slowly poured into an (0.83 wt%; 112.42 g) aqueous solution of the epoxide surfactant and pre-emulsified using an ultraturrax for 3 min. Miniemulsification was carried out under ice cooling by passing the emulsions 4 times through a M-100Y high pressure homogenizer (Microfluidics; M-100Y, interaction chambers H230Z 400 μm and H210Z 200 μm) at 10000 psi. Ethylacetate was removed with a rotary evaporator without affecting the stability of the emulsions. The samples were dialyzed for 24 h at RT to remove traces of the dyes in the aqueous phase. The EA dispersion was prepared by stoichiometrically mixing the two emulsions (10 g of amine emulsion and 8.42 g of epoxy emulsion) directly before the electrospinning.
15 wt% aqueous PVA solutions were prepared by slowly heating the mixture to 90 °C for 2 h until complete dissolution occurred. The EA dispersion was mixed with the PVA solution at different weight ratios based on dry weight (Table S1†). The fibres were spun with a commercial platform (ESIa, Electrospinz) with a positive electrode applied to a spinneret and an aluminium foil as counter electrode. The flow rate of the polymer solution was 0.2 mL h−1 and controlled with a syringe pump. The inner diameter of the spinning tip was 0.4 mm and was connected to a 5 mL syringe containing the solution via a silicon rubber tubing. The tip-collector distance was 8 cm. The electrospinning was carried out at RT. The optimum voltage applied was 10 kV.
For the quantification of the epoxide content, 9.47 mg PVA–EA fibres (equals 1.28 mg of epoxide) were cross-linked with glutaraldehyde. The latter also crosslinks the amine and it was therefore possible to extract the epoxide with chloroform for subsequent quantification with HPLC-UV. Extraction was performed by first rinsing the cross-linked fibres with water, freeze-drying, subsequent swelling of the fibres in CHCl3 (4.63 mL) for 18 h at RT under continuous shaking.
Instruments and characterization
Dynamic light scattering (DLS) measurements were carried out using a Malvern Zetasizer instrument at 25 °C with a scattering angle of 173°. Beforehand, the samples were diluted with deionized water. The Zav value was taken for analysis. SEM measurements were carried out on a Nova NanoSEM (Fei, USA). Samples were measured on the Al-template as spun and sputtered with Au prior to analysis. TEM measurements were performed on a Philips Tecnai 10 TEM operating at 100 kV. Samples were directly spun onto 400-mesh carbon coated copper grids and were stained in OsO4 vapour for 10 min prior to analysis.Dual-colour stimulated emission depletion microscopy (STED) (Leica TCS SP5) was used to visualize the distribution of both components within the nanofibres deposited on coverslips. A Leica HCX PL APO CS 1.4/100× oil-immersion objective was used. Both dyes were subsequently excited at λDiphenylperylene = 458 nm and λBODIPY = 514 nm with an argon-laser. The fluorescence was depleted at λ = 592 nm with a 1.5 W CW laser. Fluorescence was detected by a Leica HyD-Detector (diphenylperylene) and a Leica photomultiplier (BODIPY). The spectral position of the excitation wavelength, the detection ranges, and the stimulated depletion are visualized in Fig. 3c. STED images were deconvoluted using the Leica LASAF algorithm “signal energy”, a pseudo-inverse filter with stabilized signal energy and linear suppression of noise. The regularization parameter was 0.04 for both images in Fig. 3a and b, assuming a Lorentz PSF of 90 nm. The ratio and density of epoxy and amine compartments was estimated using Huygens (SVI) software on Fig. 3d. In a first step, deconvolution allowed for image restoration including noise reduction. Subsequent identification of the A&E compartments was performed by the ObjectAnalyzer module.
DSC measurements were carried out on a Netzsch 204 F1 Phoenix differential scanning calorimeter with heating rates of 10 K min−1 under N2 atmosphere in a temperature range from 0 to 180 °C. 5–15 mg samples were used for the measurements. To monitor the curing for the bulk references, the epoxy was first mixed with the PVA and the cooled amine was balanced into the crucible lid and both components were pressed together immediately prior to the measurement. HPLC measurements were performed on a Macherey Nagel Pyramid column (dimensions: 125/4 mm/5 μm) with CHCl3/CH3OH (95/5) as eluent with a flow rate of 1 mL min−1 at 20 °C and a UV detector at a detection wavelength of λ = 276 nm.
For the embedding of the fibres, 5 g BADGE and 3.075 g of Jeffamine D-400 were mixed and degased. The as-spun fibres on Al-foil (1 × 1 cm) were sealed with 100 mg of the mixture except for a small contact area on the backside for attaching the Au-electrode and left curing for one week at RT. The samples were cut with a razor blade and left at RT for 96 h prior to the measurements. Linear sweep voltammetry was carried out on a Metrohm Autolab Potentiostat (204 Potentiostat-Galvanostat) in a conventional three electrode setup. Samples were glued onto the Au working electrode with Nafion polymer to generate a conductive connection between the sample and the electrode. Pt wires served as reference and counter electrode. 3 M KCl solution was used as electrolyte. The potential was ramped from −0.5 V to 0.75 V.
Computations were performed using statistical analysis a script in R (details are given in the ESI†).35
Results and discussion
In order to encapsulate the epoxide and the amine (E&A) as distinct compartments, both need to be immiscible with the spinning solution and the fibre matrix itself and premature reaction needs to be suppressed. Therefore, at first, aqueous dispersions of A&E yielding similar particle sizes (∼150 nm) were prepared separately with all other parameters and concentrations kept constant. A reactive epoxy surfactant was used for the stabilization of both dispersions. We recently demonstrated that for the hydrophobic amine, the surfactant generates a thin stabilization layer due to an interfacial reaction with the amine, effectively stabilizing the colloids.34 This stabilization layer is not comparable to a densely cross-linked shell since the overall surfactant concentration is too low. A hybrid dispersion was prepared by stoichiometrically mixing the A&E colloids according to their amine hydrogen- and epoxy equivalent weight (AHEW and EEW). The calculated number concentration of amine and epoxy droplets is approximately 1.9:1 as displayed in Table S1.† The hybrid dispersion was colloidally stable for several hours, with neither noticeable premature epoxy/amine reaction, nor coagulation, nor phase separation taking place, and was directly mixed with an aqueous PVA solution for immediate colloid-electrospinning as shown in Fig. 1.
Fibre morphology
During the spinning process, various parameters influence the morphology of the nanofibres: jet thinning, water evaporation, increasing viscosity and possible reactions of both compartments play important roles. Depending on the concentration ratios of the PVA matrix to the colloids, the fibre morphology will either be dominated by the matrix or by the epoxy–amine colloids. Therefore, we varied the PVA–EA ratio from 6:1 to 1:1 based on dry weight in order to maximize the load of A&E while maintaining uniform fibres. The most important condition is that both compartments are kept separate, also under the rather harsh conditions during the spinning process. The SEM image in Fig. 2b shows the electrospun fibres at a ratio of 3:1, which appear smooth and uniform with 310 ± 50 nm thickness and with no unencapsulated material present, i.e. there are no free amine or epoxy nanoparticles. Lower ratios and pure PVA fibres (Fig. S1†) gave almost identical results. Fibre spinning with higher concentration of the dispersion yielded a more irregular morphology. In contrast, beads were formed due to decreased viscosity, converting the polymer jet into droplets.36 For the 1:1 ratio (Fig. 2d) also some free material was visible as particles on the substrate. It can be speculated that, at high particle concentrations, premature reaction of A&E partially takes place during the colloid-electrospinning. In fact, the 1:1 nanofibres appear partially fused, with a tendency to crosslink especially in the beaded regions, resulting in a morphology vaguely resembling nerve cells in the neural network. These in situ crosslinked morphologies will be subject of further studies. However, it is not possible to access the interior morphology of the fibres with SEM.
 | ||
| Fig. 2 SEM images of the dual compartment (PVA–EA) fibres with different matrix to colloid ratios (a) 6:1 (b) 3:1 (c) 2:1 (d) 1:1. | ||
Distribution of compartments within the fibres
To visualize the distribution of both components within the nanofibres, we utilized fluorescence labelling in combination with dual-colour stimulated emission depletion (STED) microscopy.37,38 This method was reported earlier to resolve and locate nanoparticles immobilized in nanofibres.39–41 Two hydrophobic dyes were synthesized for this purpose: a BODIPY and a bathochromically shifted perylene dye, since they provide high fluorescence quantum yield, photostability, STED suitability and large extinction coefficients.42 A detailed description of their synthesis and properties can be found in the ESI.† Their absorption and emission spectra are shown in Fig. 3c. The amine component was labelled in green (diphenylperylene), and the epoxy component in red (BODIPY). Both dyes were subsequently excited at λDiphenylperylene = 458 nm and λBODIPY = 514 nm with an Ar-laser. The fluorescence was depleted at 592 nm, which is suitable for both dyes.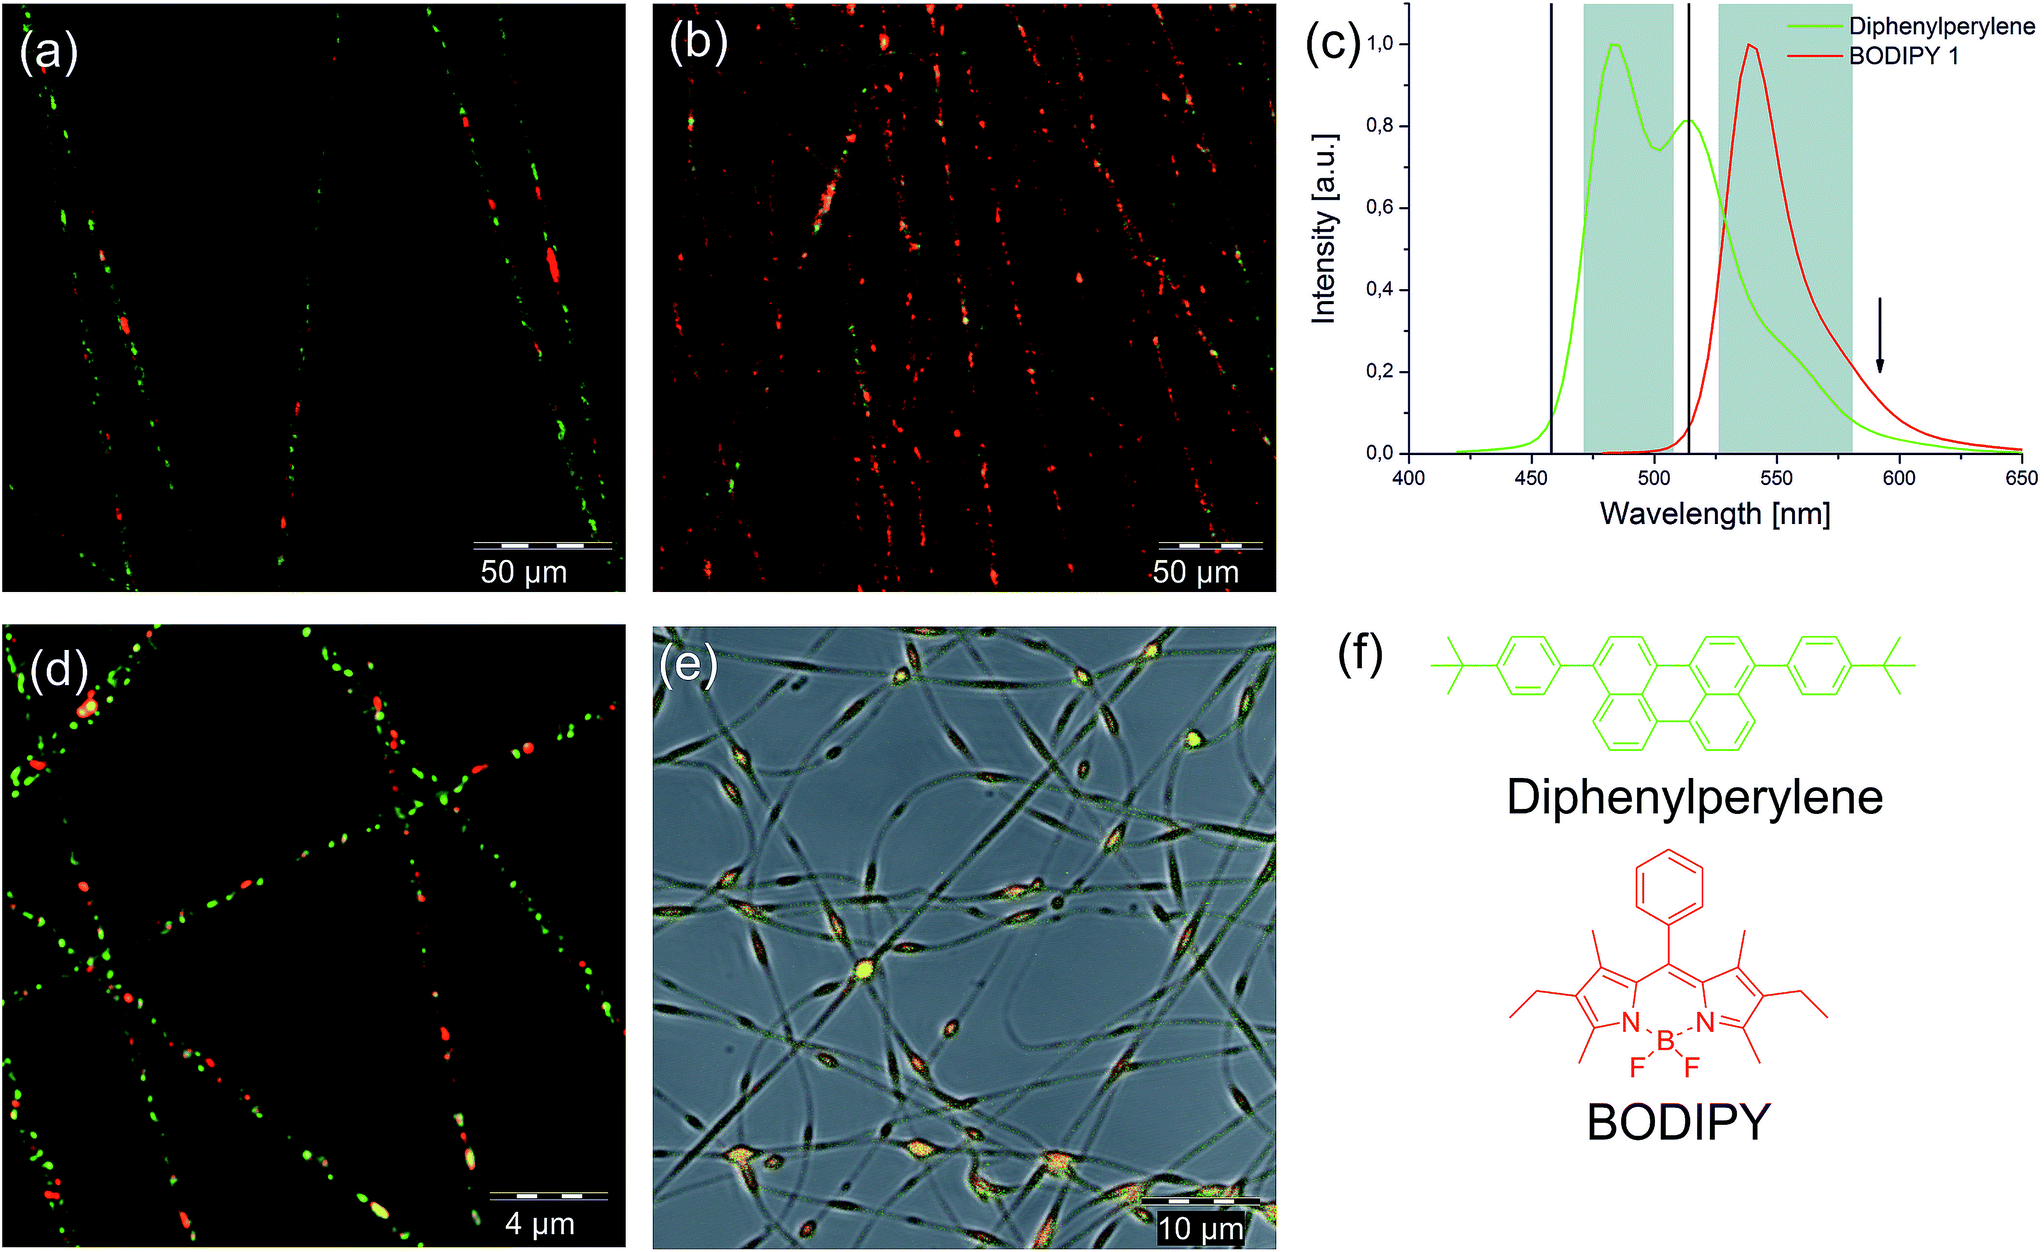 | ||
| Fig. 3 Characterization of the electrospun two component nanofibres. Dual-colour STED image (deconvoluted) of the PVA–EA 3:1 sample (a) at room temperature and (b) after thermal treatment (150 °C). (c) Emission spectra and detection windows (grey) for the STED imaging. Excitation wavelengths for both dyes are marked as black lines and the depletion wavelength with an arrow. (d) Confocal microscopy image (deconvoluted) of the PVA–EA fibres immersed in glycerol. (e) Confocal image of the PVA–EA 1:1 sample. (f) Chemical structure of the dyes used. | ||
Fig. 3a displays the PVA–EA 3:1 nanofibres as an overlay of the red and the green channel. A comparison of STED versus confocal imaging can be found in Fig. S4† showing the full width half maximum of both intensity profiles. With STED, a much better resolution was achieved. From the absence of background fluorescence, it can be concluded that the self-healing material is fully encapsulated within the PVA fibres. Due to the high hydrophobicity of the colloids, the PVA tends to assemble around the colloids which leads to a complete encapsulation after the spinning. Furthermore, both components are randomly distributed among the fibres with more “green” droplets present due to the differences in number concentration as calculated in Table S1.† Despite the nanoscale dimensions, the particles appear well separated from each other in almost all cases. Some of the “red” epoxy droplets seem elongated. We used glycerol as immersion fluid to swell the PVA matrix which displayed an increased average fibre diameter of about 670 nm (Fig. 3d). The image shows that at this stage, except from very few orange appearing spots, the red and green labelled compartments are still separated from each other, which supports the assumption that the PVA matrix at room temperature works as barrier. For further evaluation, we performed statistical analyses of both components. In total, 450 objects were analysed. It needs to be noted, that we are operating close to the detection limit which only allows a vague quantitative discussion. The analysis was performed using object recognition. In average, in a fibre volume of 1 μm3, 10 objects were found for the swollen state. In the non-swollen state, the concentration is about 4–5 times higher. The ratio of green/red was found 1.9:1 which is in good agreement with the theoretically calculated 1.91:1 number concentration. We found partial overlapping between the A&E compartments, which we could not resolve accurately due to the detection limit. Nevertheless, the analysed image is a 2D projection, so overlapping signals could also be a consequence of this projection.
Additionally, we had a closer look at the PVA–EA 1:1 sample. The confocal microscopy image shown in Fig. 3e shows a complete co-localization of the red and green dyes. As suspected, we also found an increased concentration of the dyes in the beaded regions, showing that crosslinking had likely taken place during the spinning process. In this sense, the intrinsic reactivity approach can be used for the generation of new structures and fibre morphologies, suitable for advanced material and tissue engineering, which will be subject of further studies. The focus of this contribution remains on dual-compartment fibres with a very close vicinity of A&E without significant reaction to enable for example enhanced self-healing. Therefore, the 3:1 ratio was used for all further investigations.
To estimate the particle–particle distances within the fibres, we firstly performed computations and secondly conducted TEM measurements. For the computation of the nearest neighbour particle–particle distances, the following assumptions were made: (a) the concentration ratios after the electrospinning equal the initial concentrations, (b) to simplify the model, no distinction between the A&E compartments was made, (c) the compartments were described as hard spheres and the confining fibre as cylinder and (d) the spheres perform a random walk on a cubic grid with a step size of 2.5 nm within the cylindrical confinement. We used RFibre = 175 nm and rEA = 75 nm. The term fEA = 0.28 represents the fraction of spheres compared to the overall amount of polymer (fibre + spheres) for the computation (see Table S3†). The nearest neighbour distribution is close to an exponential distribution, as one would expect for a uniform point distribution in one dimension.43 For the simulation, the spheres were located along the cylinder axis as initial scenario (Fig. 4c left). Starting from this conformation, the spheres were allowed to move within the confined space. The second cylinder shows their position after approximately 80000 moves.
 | ||
| Fig. 4 (a) The graph shows the probability density for the nearest neighbours as a function of the sphere centre to centre distance as a logarithmic plot. (b) TEM images of the PVA–EA 3:1 sample. (c) Computed model of the fibres showing the sphere-filled cylinder with a chosen initial conformation where all spheres (black) are located at the cylinder axis. The red spheres in the second cylinder represent their position after 80000 moves. (d) False coloured reproduction of image (b) showing the elongated particles. | ||
The depicted density allocation in Fig. 4a shows that the particle–particle distances are in the nanometre range. The distance (in units of rEA) between the majority of individual particles is even less than one which proves our method viable to assemble highly reactive components in very close vicinity to each other and also explains why, even with high resolution optics, it is difficult to prove their statistical distribution. Similar results were obtained by choosing a different starting scenario in which the spheres are located close to the cylinder wall.
The localization of nanoparticles in the fibres with TEM is usually difficult because of their low differences in electron density. It was possible to enhance the contrast with OsO4 staining (Fig. 4b). For better understanding, we false-coloured the particles (Fig. 4d). Also, in TEM, the particles seem elongated, a phenomenon which has already been described for colloid-electrospinning several times.44 The aspect ratio was 2.9 ± 1.0. The particle–particle distances are in the nanometre length scale with 91 ± 63 nm. Compared to the computed model, the centre-to-centre distances are higher. This could have several reasons: the model does not consider the observed anisotropic deformation of the particles and also the model disregards deviations in particle as well as fibre sizes. Another explanation might be that the concentration ratio before and after the electrospinning was not the same. However, we did neither observe any free, unencapsulated material in SEM nor in the STED measurements.
Reactivity and self-healing of the nanofibres
In a second step, we investigated the reactivity of the system. The curing of the epoxy–amine system in bulk at room temperature is very fast with a pot-life of about 12 min. At room temperature, the PVA is in its glassy-state, thus providing a suitable barrier to suppress premature reaction. We tried to quantify the amount of unreacted epoxy present in the virgin fibres by HPLC analysis. We therefore crosslinked the amine as well as the PVA fibres with glutaraldehyde and extracted the epoxide from the mixture by swelling the samples in chloroform. The extract was analysed with HPLC-UV (see Fig. S6†). Despite uncertainties like possible premature reaction during chemical fixation/solvent treatment or completeness of extraction, we found about 65% of unreacted epoxide, which means that the majority remains reactive and can be used for triggered reactions by temperature increase or mechanical stress. Heating the fibres above the Tg of the PVA allows chain-segment flexibility and diffusion of the reactants to initiate the crosslinking reaction. Since the epoxy–amine curing is an exothermic process, we carried out DSC measurements on the fibres. Firstly, we observed the pure epoxy–amine crosslinking in bulk, where we observed a very broad signal for the crosslinking with an enthalpy change per gram epoxide of about 230 J g−1 with a Tg of 103 °C (Fig. S5†). Thus, we compared the PVA reference fibres and the PVA–EA fibres and also found a broad exothermic peak for the latter, indicating that the curing reaction is possible within the nanofibres. To verify the results, we carried out several reference measurements which are summarized in the ESI (Fig. S5†). We looked into the temperature-induced curing in more detail by heating the samples to 150 °C for 5 h. The STED microscopy image in Fig. 3b shows that now both channels almost completely overlay and it is not possible to distinguish between the compartments anymore. Afterwards, the PVA matrix was removed by dissolution in water (Fig. 5a). The fibre morphology could be preserved, the fibres are partially fused together, probably due to crosslinking of the PVA with the epoxy and itself. Removal of the PVA at RT instead shows an inhomogeneous film covering the substrate. | ||
| Fig. 5 SEM images of the PVA–EA 3:1 nanofibres after the PVA matrix was removed at (a) 150 °C and (b) RT. | ||
To prove the approach viable for self-healing applications, the aluminum substrates with the electrospun fibres were coated with an amine-cured epoxy matrix as a protective topcoat. Afterwards, the samples were scribed with a razorblade as schematically shown in (Fig. 6a) to expose the substrate to the environment. Linear sweep voltammetry was performed 96 h after the samples were cut to demonstrate the self-healing reaction of the fibres. We used a three electrode cell with the Al foil glued onto an Au electrode and immersion of the sealed sample into a KCl electrolyte solution. The graph in (Fig. 6b) shows that, as expected for the virgin coating, no current was detected because the electrolyte solution is not in contact with the conductive substrate. In contrast, a significantly increased current was measured for the scribed coating which did not contain any fibres. Similar results were obtained for the pure PVA-fibre control sample which also should not display any self-healing capacity. In contrast, the PVA–EA fibres did not show an increase in current, but provided significant passivation of the substrate and hence an efficient self-healing. For further applications in the field of corrosion protection, the effect of different fibre matrices will be studied to tune the adhesive properties of the fibres and the substrate.
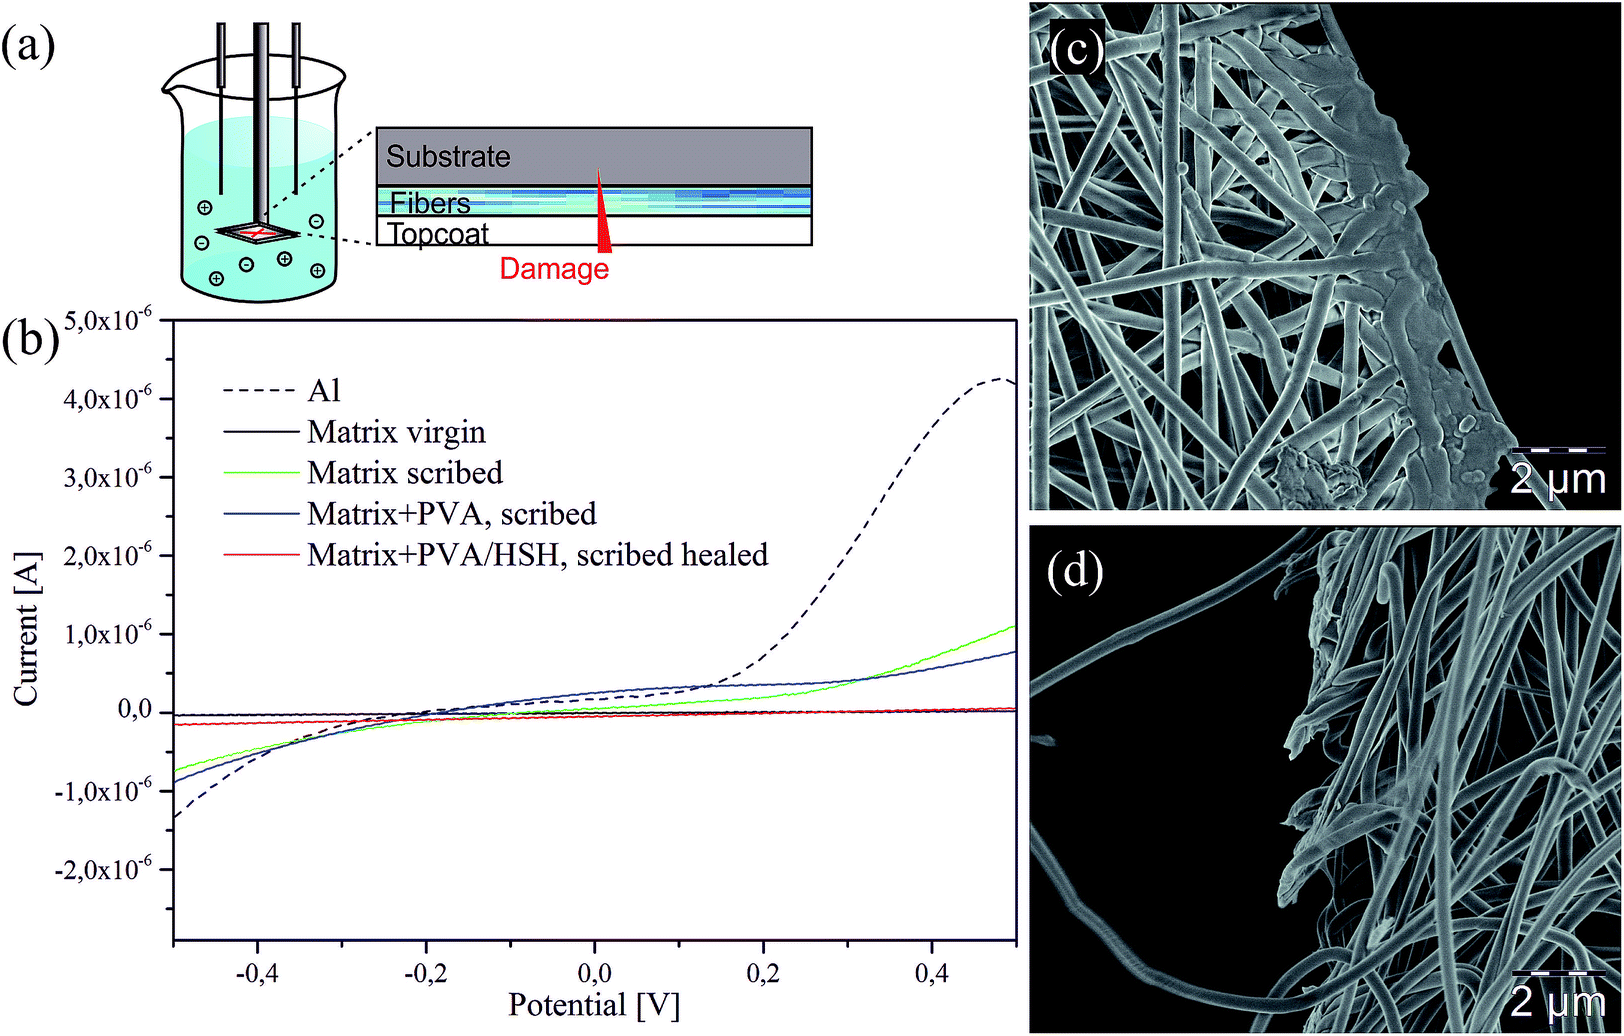 | ||
| Fig. 6 Self-healing ability of the PVA–EA 3:1 sample. (a) Schematic drawing of the setup for the voltammetry measurements. (b) Current versus potential curves comparing the virgin coating (black), the pure Al-foil (black, dashed) with the scribed non-healing (green and blue) and the self-healing coating (red). SEM image of the scribed (c) PVA–EA sample versus (d) the scribed PVA nanofibres. | ||
Finally, the reactivity and self-healing capability of the dual-compartment nanofibres are visualised in a simple fibre cutting experiment. Samples were scribed with a razor blade and left to heal at room temperature for 24 h. These investigations were made after 3 months of storing the fibres at RT, to prove the long-term stability and maintained reactivity of the system. (Fig. 6c and d) compares the pure PVA fibres and the PVA–EA fibres. The PVA–EA fibres are completely fused due to the release of both compartments and their subsequent crosslinking, whereas the PVA fibres remain ruptured.
Conclusions
In conclusion, dual-compartment nanofibres encapsulating epoxy and amine as two highly reactive components in one polyvinyl alcohol fibre are investigated. They are prepared by colloid-electrospinning from a hybrid dispersion which contains both compartments in different concentrations. Uniform fibres are produced using a ratio of 3:1, whereas higher epoxy–amine concentrations lead to a “neural network” fibre morphology which will be subject of further studies. Computations in combination with fluorescent labelling and high resolution microscopy methods confirm that well separated epoxy and amine domains in very close vicinity (<100 nm) are obtained. Despite their immediate proximity, premature reaction is efficiently suppressed. The fibre matrix is able to keep them separated over several months of storage. Crosslinking of the compartments can be initiated either upon temperature increase or mechanical damage. Self-healing at room temperature is achieved, as shown by electrochemical testing and scanning electron microscopy measurements. The concept represents a non-classical, colloidal approach to carefully adjust reaction latency. Additionally, extremely short diffusion distances for two component crosslinking polymerization offers fundamental advantages and new possibilities for self-healing systems and autonomous repair of material damage.
Acknowledgements
The authors would like to thank B. Eschen for SEM measurements, K. Zhang for help and discussion with the voltammetry measurements, B. Müller for the HPLC analysis and L. Lv for help and discussion with the electrospinning. Scientific Volume Imaging (http://svi.nl) is acknowledged for kindly providing us with a fully functional test license for the Huygens Professional software. Support by the IMB Core Facility Microscopy is gratefully acknowledged. We thank Laura Breucker for proofreading the manuscript.References
- W. E. Teo and S. Ramakrishna, Nanotechnology, 2006, 17, R89 CrossRef CAS PubMed.
- A. Greiner and J. H. Wendorff, Angew. Chem., Int. Ed., 2007, 46, 5670–5703 CrossRef CAS PubMed.
- C. Huang, S. J. Soenen, J. Rejman, B. Lucas, K. Braeckmans, J. Demeester and S. C. de Smedt, Chem. Soc. Rev., 2011, 40, 2417–2434 RSC.
- R. Sahay, P. S. Kumar, R. Sridhar, J. Sundaramurthy, J. Venugopal, S. G. Mhaisalkar and S. Ramakrishna, J. Mater. Chem., 2012, 22, 12953–12971 RSC.
- D. Li and Y. Xia, Adv. Mater., 2004, 16, 1151–1170 CrossRef CAS.
- J. Xie, M. R. MacEwan, A. G. Schwartz and Y. Xia, Nanoscale, 2010, 2, 35–44 RSC.
- S. Agarwal, J. H. Wendorff and A. Greiner, Polymer, 2008, 49, 5603–5621 CrossRef CAS.
- R. Gentsch, F. Pippig, S. Schmidt, P. Cernoch, J. Polleux and H. G. Börner, Macromolecules, 2011, 44, 453–461 CrossRef CAS.
- X. Wang, Q. Fu, X. Wang, Y. Si, J. Yu, X. Wang and B. Ding, J. Mater. Chem. B, 2015, 3, 7281–7290 RSC.
- Y. Si, Q. Fu, X. Wang, J. Zhu, J. Yu, G. Sun and B. Ding, ACS Nano, 2015, 9, 3791–3799 CrossRef CAS PubMed.
- Y. Si, J. Yu, X. Tang, J. Ge and B. Ding, Nat. Commun., 2014, 5, 5802 CrossRef PubMed.
- C.-L. Zhang and S.-H. Yu, Chem. Soc. Rev., 2014, 43, 4423–4448 RSC.
- D. Crespy, K. Friedemann and A.-M. Popa, Macromol. Rapid Commun., 2012, 33, 1978–1995 CrossRef CAS PubMed.
- N. Horzum, R. Muñoz-Espí, G. Glasser, M. M. Demir, K. Landfester and D. Crespy, ACS Appl. Mater. Interfaces, 2012, 4, 6338–6345 CAS.
- D. Joe, F. E. Golling, K. Friedemann, D. Crespy, M. Klapper and K. Müllen, Macromol. Mater. Eng., 2014, 299, 1155–1162 CrossRef CAS.
- A. Stoiljkovic, M. Ishaque, U. Justus, L. Hamel, E. Klimov, W. Heckmann, B. Eckhardt, J. H. Wendorff and A. Greiner, Polymer, 2007, 48, 3974–3981 CrossRef CAS.
- W. Yuan and K.-Q. Zhang, Langmuir, 2012, 28, 15418–15424 CrossRef CAS PubMed.
- C. Wohnhaas, K. Friedemann, D. Busko, K. Landfester, S. Baluschev, D. Crespy and A. Turshatov, ACS Macro Lett., 2013, 2, 446–450 CrossRef CAS.
- B. Dong, M. E. Smith and G. E. Wnek, Small, 2009, 5, 1508–1512 CrossRef CAS PubMed.
- E. Jo, S. Lee, K. T. Kim, Y. S. Won, H.-S. Kim, E. C. Cho and U. Jeong, Adv. Mater., 2009, 21, 968–972 CrossRef CAS.
- S. R. White, N. R. Sottos, P. H. Geubelle, J. S. Moore, M. R. Kessler, S. R. Sriram, E. N. Brown and S. Viswanathan, Nature, 2001, 409, 794–797 CrossRef CAS PubMed.
- S. Billiet, X. K. D. Hillewaere, R. F. A. Teixeira and F. E. Du Prez, Macromol. Rapid Commun., 2013, 34, 290–309 CrossRef CAS PubMed.
- P. A. Pratama, M. Sharifi, A. M. Peterson and G. R. Palmese, ACS Appl. Mater. Interfaces, 2013, 5, 12425–12431 CAS.
- S. H. Cho, S. R. White and P. V. Braun, Chem. Mater., 2012, 24, 4209–4214 CrossRef CAS.
- W. H. Binder, Self-healing polymers: from principles to applications, John Wiley & Sons, 2013 Search PubMed.
- J.-H. Park and P. V. Braun, Adv. Mater., 2010, 22, 496–499 CrossRef CAS PubMed.
- X. K. D. Hillewaere, R. F. A. Teixeira, L.-T. T. Nguyen, J. A. Ramos, H. Rahier and F. E. Du Prez, Adv. Funct. Mater., 2014, 24, 5575–5583 CrossRef CAS.
- M. W. Lee, S. An, C. Lee, M. Liou, A. L. Yarin and S. S. Yoon, J. Mater. Chem. A, 2014, 2, 7045–7053 CAS.
- N. K. Guimard, K. K. Oehlenschlaeger, J. Zhou, S. Hilf, F. G. Schmidt and C. Barner-Kowollik, Macromol. Chem. Phys., 2012, 213, 131–143 CrossRef CAS.
- Y. Chen, A. M. Kushner, G. A. Williams and Z. Guan, Nat. Chem., 2012, 4, 467–472 CrossRef CAS PubMed.
- H. Jin, C. L. Mangun, A. S. Griffin, J. S. Moore, N. R. Sottos and S. R. White, Adv. Mater., 2014, 26, 282–287 CrossRef CAS PubMed.
- D. A. McIlroy, B. J. Blaiszik, M. M. Caruso, S. R. White, J. S. Moore and N. R. Sottos, Macromolecules, 2010, 43, 1855–1859 CrossRef CAS.
- H. Jin, C. L. Mangun, D. S. Stradley, J. S. Moore, N. R. Sottos and S. R. White, Polymer, 2012, 53, 581–587 CrossRef CAS.
- A.-C. Bijlard, S. Winzen, K. Itoh, K. Landfester and A. Taden, ACS Macro Lett., 2014, 3, 1165–1168 CrossRef CAS.
- The R. Team, R: A Language and Environment for Statistical Computing, R Foundation for Statistical Computing, Vienna, Austria, 2015.
- H. Fong, I. Chun and D. H. Reneker, Polymer, 1999, 40, 4585–4592 CrossRef CAS.
- S. W. Hell, Science, 2007, 316, 1153–1158 CrossRef CAS PubMed.
- S. W. Hell and J. Wichmann, Opt. Lett., 1994, 19, 780–782 CrossRef CAS PubMed.
- K. Friedemann, A. Turshatov, K. Landfester and D. Crespy, Langmuir, 2011, 27, 7132–7139 CrossRef CAS PubMed.
- L. Meyer, D. Wildanger, R. Medda, A. Punge, S. O. Rizzoli, G. Donnert and S. W. Hell, Small, 2008, 4, 1095–1100 CrossRef CAS PubMed.
- D. Busko, S. Baluschev, D. Crespy, A. Turshatov and K. Landfester, Micron, 2012, 43, 583–588 CrossRef CAS.
- R. Sauer, A. Turshatov, S. Baluschev and K. Landfester, Macromolecules, 2012, 45, 3787–3796 CrossRef CAS.
- P. Hertz, Math. Ann., 1909, 67, 387–398 CrossRef.
- C. Herrmann, A. Turshatov and D. Crespy, ACS Macro Lett., 2012, 1, 907–909 CrossRef CAS.
Footnote |
| † Electronic supplementary information (ESI) available. See DOI: 10.1039/c5ra17750b |
| This journal is © The Royal Society of Chemistry 2015 |