Linping
Yu
ab,
Ting
Lei
a,
Bo
Nan
a,
Jiangang
Kang
a,
Yao
Jiang
*a,
Yuehui
He
a and
C. T.
Liu
c
aState Key Laboratory of Powder Metallurgy, Central South University, Changsha 410083, P.R. China. E-mail: jiangyao@csu.edu.cn; Fax: +86 73188836144; Tel: +86 73188836144
bSchool of Chemistry and Biology Engineering, Changsha University of Science & Technology, Changsha 410114, P.R. China
cCenter for Advanced Structural Materials, College of Science and Engineering, City University of Hong Kong, Hong Kong, China
First published on 21st September 2015
Molybdenum doped porous Ni–Cu cathodes are conveniently prepared by powder metallurgy in this work. The microporous structure of the porous Ni–Cu based cathodes has a certain correlation with the content of molybdenum, which consequently influences the electrocatalytic behavior as electrode materials. Electrocatalytic performance of the prepared cathodes has been investigated by hydrogen evolution reaction in 6.0 mol L−1 KOH solution. It is demonstrated that the Mo doped porous Ni–Cu cathodes exhibit a superior electrocatalytic activity for HER over a binary porous Ni–Cu cathode, among which the porous Ni–Cu with 6.0 wt% Mo shows the highest intrinsic activity and an ascendant stability during HER. Although the porous Ni–Cu (with 9.0 wt% Mo) expresses the highest activity, a gradual decline of the current density for HER in long-term operation is found, which is due to the dissolution of Mo from the porous skeleton in alkaline solution.
Taking cost into consideration, relatively inexpensive materials such as nickel (Ni),2 cobalt (Co),3 molybdenum (Mo),4,5 tungsten (W),6 and their alloys (Ni–Co,7 Ni–W,8 Ni–Mo8,9) have been subjects of intense researches due to their promising electro-catalytic performance. A common way to increase the integrated electro-catalytic behavior of these alloys is to introduce foreign elements (Mo,8,9 Fe,10 Cu,11,12etc.) or compounds (rare earths,13 hydroxides,14 sulfides,15,16 nitrides,17etc.) into the prior systems, for obtaining larger surface areas or higher intrinsic activity. Mo is usually selected as an additive in assisting the main source of catalytic activity, while the root cause for explaining the improvement on electro-catalytic properties are not always consistent.
Previous kinetic studies have claimed that the introduction of Mo into Ni or Ni based alloys and subsequent alkaline leaching of the superficial Mo leads to a course surface with enhanced activity for the HER.18,19 However, results from J. G. Highfield et al.20 have shown that the synergy is expressed in the Ni–Mo alloys down to remarkably low levels of Mo (<5 at%). Co–Mo films with low Mo contents have also been found significant synergistic effect as cathodes in water electrolysis, which is achieved by the combination of hyper d-electronic phase Co and hypo d-electronic phase Mo. 21Amorphous Ni–Fe–Mo alloys have presented good activity and stability for HER, after incorporating Mo with binary Ni–Fe alloy,22 due to the synergistic effect between Ni–Fe and Mo. Based on these researches, it can be suggested that a certain amount of Mo adding to binary or ternary metallic materials may tailor their desirable electro-catalytic properties.
Many porous multi-component alloys are fabricated by powder metallurgy, for different application purpose, which is considered as a low-cost and highly convenient way to prepare materials with three-dimensional porous structure.23–25 Careful design of the process (composition, sintering temperature, pore formers, etc.) allows to tune the porous morphology, the microstructure and phase constitution of the resulting material. The homogenous porous Ni/Cu (mass ratio Ni:
Cu = 2
:
1), with an open porosity ranging from 23.5% to 37.8% are obtained in previous works.26 Furthermore, numerous reports demonstrate the synergistic effect between Ni and Cu for Ni–Cu alloys applied as an electro-catalytic cathode for hydrogen evolution by water electrolysis.12,27,28 The stability of the porous structure for cathode material is also important during a long-term application. For most reported porous cathodes, it is hard to ensure the adherence of the electro-active layers with the substrate while maintaining the composition. Based on the precise control of constituents and the flexible guidance on porous structure by powder metallurgy, this study extends to fabricate active molybdenum doped Ni–Cu alloy cathodes for further enhancing the electro-catalytic activity and stability during HER. The effects of the molybdenum concentration on the chemical and the electrochemical properties of porous Ni–Cu based alloy cathodes are carefully studied in this research.
The compositions, microstructures of the obtained molybdenum doped porous Ni–Cu cathodes are characterized by X-ray diffraction (XRD), scanning electron microscopy (SEM), and mercury intrusion porosimetry (MIP) method. The electrochemical properties of porous Ni–Cu(Mo) are evaluated by linear sweep voltammetry (LSV), impedance spectroscopy (EIS) and cyclic voltammetry (CV) measurements. The chemical stability in potassium hydroxide solution is broadly analyzed by energy dispersive X-ray spectroscopy (EDS) and inductively coupled plasma atomic emission spectroscopy (ICP).
All the samples used for following tests were rinsed with deionized water in an ultrasonic cleaner for 30 min, then degreased in anhydrous alcohol, and finally dried up in vacuum oven at 75 °C for 2 hours prior to use.
Open porosity | Average pore size (μm) | N2 permeate flux (m3 m−2 kPa−1 h−1) | |
---|---|---|---|
S0 | 37.6% | 7.5 | 76.2 |
SI (3.0 wt%) | 37.4% | 6.7 | 75.1 |
SII (6.0 wt%) | 37.2% | 5.9 | 75.7 |
SIII (9.0 wt%) | 37.3% | 5.6 | 76.3 |
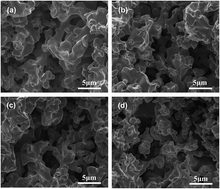
Studies on diffusion kinetics of Ni (Mo) systems have found that the interdiffusion coefficient varies very little when the composition of Mo below 25 at% at temperatures between 1050 to 1225 °C, which further indicates that there is not much difference in the vacancy concentration at different content of Mo incorporated to the Ni–Cu solid solution.31,32 It can well explain the nearly constant open porosity for Mo-doped porous Ni–Cu, although the Mo content is changed. Nevertheless, the Ni/Cu diffusion areas in the sintering compact can be divided into small pieces by the diffusion of Mo atoms, and spaces for existing large pores are partly occupied by the formed small pieces, thus decreases the average pore size of the porous Ni–Cu. As shown in Table 1, the average pore size of porous Ni–Cu(Mo) is decrease with Mo content increasing, the N2 permeate flux of the porous Ni–Cu(Mo) have not exhibited a corresponding decline as the Mo content increases.
The XRD spectrograms of porous Ni–Cu based alloys with different Mo contents are displayed in Fig. 2. The strong diffraction peaks of 2θ around 44.00°, 51.26° and 75.43° belong to Ni–Cu alloy substrate, and Mo atoms have diffused into the solid solution of Ni–Cu phase. With increasing content of Mo, the diffraction peaks slightly shift to lower diffraction angles. It is due to the lattice expansion caused by the dissolving Mo atoms, since the atomic radius of Mo is larger than that of Ni and Cu. For cathode SIII, the Mo phase has also been detected by its main peak at 2θ = 40.50°. The EBSD analysis in Fig. 3 confirms that not all the Mo particles have diffused into the Ni–Cu solid solution in cathode SIII (9.0 wt%), while the cathodes with lower content of Mo (S0, SI and SII) all present a homogenous single phase after sintering.
![]() | ||
Fig. 2 XRD patterns of sintered porous Ni–Cu based cathodes with different Mo content: S0 (0 wt% Mo), SI (3.0 wt% Mo), SII (6.0 wt% Mo) and SIII (9.0 wt% Mo). |
![]() | ||
Fig. 3 SEM-BSE images and EDS analysis of Mo doped porous Ni–Cu cathodes (cross section): (a) S0; (b) SI (3.0 wt%); (c) SII (6.0 wt%) and (d) SIII (9.0 wt%). |
Furthermore, the exact compositions of sample SI and SII are examined by ICP, after wholly dissolved with concentrated nitric acid. The Mo contents are measured to be 2.97 ± 0.03 wt% and 5.94 ± 0.02 wt%, respectively. Results certify that the Mo have completely dissolved into the Ni–Cu solid solution after sintering, thus can not be detected by XRD.
![]() | ||
Fig. 4 (a) The polarization curves and (b) corresponding Tafel plots of porous Ni–Cu based cathodes in 6.0 M KOH solution (scan rate 0.01 V s−1). |
Cathode | E onset (V) | Tafel slope (mV dec−1) | η 50 (mV) | j 0(app) (mA cm−2) | R f | j 0(int) (mA cm−2) |
---|---|---|---|---|---|---|
Flake Ni | −1.47 | 101 | 396 | 7.51 × 10⁻³ | 18.7 | 4.02 × 10⁻⁴ |
S0 | −1.39 | 197 | 241 | 0.96 | 385 | 2.49 × 10⁻³ |
SI (3.0 wt%) | −1.33 | 141 | 168 | 1.93 | 550 | 3.51 × 10⁻³ |
SII (6.0 wt%) | −1.30 | 112 | 135 | 2.57 | 637 | 4.03 × 10⁻³ |
SIII (9.0 wt%) | −1.25 | 125 | 127 | 2.76 | 715 | 3.86 × 10⁻³ |
As can be seen from Fig. 4a and Table 2, all Mo doped porous Ni–Cu alloys exhibit the enhanced activities for HER in terms of a more positive onset potential (Eonset) and much lower hydrogen over-potentials, in comparison to the porous Ni–Cu alloy. Among the four cathodes under study, the porous Ni–Cu (9.0 wt%-Mo) shows the highest activity, with an over-potential of nearly 0.127 V at 50 mA cm−2 and 25 °C.
In order to obtain information on the intrinsic activity of the investigated porous Ni–Cu based cathodes for the HER, the actual exchange current density j0(act) should be determined taking into account the real electrochemically active surface area. Taking that the average double layer capacitance of a smooth metal surface is 20 μF cm−2,33 the mean value of the double layer capacitance of the electrodes can be calculated as Cdl = ∂jdl,ave/∂sr (μF cm−2) (jdl,ave and sr represents the average of capacitive current and the scan rate, respectively), the roughness factor can be calculated as Rf = Cdl/20. Calculated roughness factor and the actual exchange current density for the investigated cathodes, are also presented in Table 2. Porous structure parameters in Table 1 indicate that different actual surface area will be provided by the cathodes. For porous materials, when the open porosity is constant, the actual surface area should be increase with average pore size deceasing. As shown in Table 2, the roughness factor for porous Ni–Cu cathode is approximately 20 times higher than dense Ni flake, and it continues to increase after incorporation of Mo. For cathode SIII (9.0 wt%), the Rf is nearly 1.86 times higher than that of S0. High roughness factor indicates a high volumetric density of active sites on the electrodes, and the increased number of electroactive surface sites greatly enhances the apparent electrocatalytic activity of the cathodes.34 From the calculated exchange current density j0, as well as the over-potential value under the same current density 0.05 A cm−2, cathode SIII (9.0 wt%) exhibits the best overall activity, while cathode SII (6.0 wt%) presents the highest intrinsic activity. The intrinsic j0 (exchange current density) for cathode SII (6.0 wt%) is about 4.02 × 10⁻³ A cm−2, which is 10 times higher than that for dense Ni flake at the same electrolysis condition, and 1.62 times higher than binary porous Ni–Cu.
Moreover, the Tafel curves recorded on Mo doped porous Ni–Cu cathodes (Fig. 4b) exhibit classical Tafel behavior, clearly indicating that the HER can be described using the Tafel equation.17 As shown in Table 2, the Tafel slopes for HER are found to be 141, 112 and 125 mV dec−1 for cathodes SI, SII and SIII, respectively. Mo doped porous Ni–Cu cathodes exhibit lower Tafel slopes and higher apparent exchange current densities compared with binary porous Ni–Cu. Obviously, the electrochemical behavior is related to the concentration of Mo incorporated to the Ni–Cu solution. Mo is completely resolved to the binary Ni–Cu solid in cathode SI, SII, and the solid solubility for Mo in cathode SIII is calculated to be 6.65 wt% after the designed sintering process. It indicates that the Tafel slope for the investigated cathodes can be minimized as the content of Mo to the binary Ni–Cu doped at 6.0 wt%, which can explain the relatively higher intrinsic exchange current density of HER on the cathode SII.
It follows that the primary contribution to the enhancement of the electrocatalytic activity of the Mo doped porous Ni–Cu cathode toward HER arises not only from the increase of the actual specific area, but also a significant synergism catalytic effect is present. The synergism is optimally expressed as the Mo content in porous Ni–Cu(Mo) solid solution reaches about 6.0 wt%, according to the results. The excessive Mo is effectively redundant for a critical lattice spacing of Ni–Cu(Mo), causing a progressive loss of synergism in the alloy cathodes.
About improvements in electrocatalytic performance regarding Ni base cathodes modificated by the third constituent with proper concentration, explanations in many reported studies are ultimately switched to the Brewer–Engel valence bond theory, initially introduced by Jaksic et al.35 According to this theory, Bocutti et al.36 interpret that the synergism exhibited on Ni–La (0.3 at% La in LaNi5/Ni) or Ni–Ce (0.9 at% Ce in MmNi3.4Co0.8Al0.8/Ni) combines the d8-orbital of Ni (which can promote the discharge of H2O) and the semi-empty d1-orbital of La or Ce (which can conciliate the step of hydrogen adsorption). Fotis Paloukis et al.34 also proposed that the strength of the metal–H and H2O–metal interactions plays an important role in the hydrogen evolution reaction, the latter should be strong enough to split H2O while the former interaction no need to be excessively strong, otherwise the hydrogen desorption would be restrained.18 Thus, the electrocatalytic activity of the investigated Mo doped porous Ni–Cu depends not only on the geometry of cathode, but also on the chemical composition. Additionally, Ni and Cu locate on the left side of the well-known “volcano plots”, while Mo on the right side. From this point of view, the incorporation of Mo element into the Ni–Cu solid solution will moderately enhance the H adsorption on the surface of metal electrode, which results in an intermediate metal–H interaction during the hydrogen evolution reaction. The comparatively lower onset potential and the smaller Tafel slope of Mo doped porous Ni–Cu than the binary Ni–Cu cathode demonstrate that the presence of Mo in the Ni–Cu lattice favors proton adsorption kinetics. The proper electronic interaction state between Ni–Cu and Mo turns out to be 6.0 wt% Mo in porous Ni–Cu(Mo) cathode.
Compared with multi-component cathode reported previously, the intrinsic activity for SII is superior than NiTi, which has an intrinsic j0 of 1.94 × 10⁻⁵ A cm−2 in 1.0 M NaOH at 25 °C;37 and also exceed the Ni–Co alloy powder electrode with the apparent j0 of 1.2–1.4 × 10⁻³ A cm−2 in 6.0 M KOH at 25 °C,38 as well as the electrodeposited Ni overlayers on Mo polycrystalline, which is reported as an apparent j0 for 0.9 × 10⁻³ A cm−2 in 0.1 M NaOH at 25 °C.34 Additionally, the activity of cathode SII is comparable to the electrodeposited Ni–W (the apparent j0 is 6.5 × 10⁻³ A cm−2 in 6.0 M KOH at 25 °C),39 and Ni–Co–Zn (the apparent j0 is 5.5–6.31 × 10⁻³ A cm−2 in 30 wt% KOH at 30 °C).40
The experimental complex-plane plots and the phase-frequency plots for three Mo-doped porous Ni–Cu cathodes obtained at various potentials are displayed in Fig. 5. The presented Nyquist and Bode spectra show the existence of two distinctive time constants for all cathodes, and the absence of Warburg impedance indicates that mass transport is rapid enough so that the reaction is kinetically controlled.15 The similarity among the response of all cathodes suggests a similar mechanism for hydrogen evolution. The two-time constant serial equivalent circuit model (2TS) presented in Fig. 5d shows the appropriate simulated result to the EIS response of three cathodes during HER.
According to this model, the resistance element Rs is attributed to the uncompensated solution resistance; the high-frequency time constant, independent of the potential, described by the Rp and Cp connected in parallel, is related to the porosity of electrode, whereas the potential dependent time constant is related to the kinetics of the HER (Rct and CPEct connected in parallel).9
The fitting curves are presented by the solid lines in the Fig. 5a–c, while the values of the impedance parameters for porous Ni–Cu based cathodes are listed in Table 3. As shown in Table 3, the charge transfer resistance (Rct) reduced greatly while the constant phase element (CPE) increases slightly with increasing Mo concentration in porous Ni–Cu based cathodes at the same electrolysis potential, which are related to the onset of faradaic reaction of HER, and also indicates the increasing electrocatalytic activity of the porous cathodes.
R s (Ω) | C (F cm−2) | R (Ω) | CPE (F cm−2) | n | R (Ω) | ||
---|---|---|---|---|---|---|---|
SI | −1.25 | 0.95 | 1.42 × 10⁻³ | 0.64 | 9.68 × 10⁻³ | 0.86 | 67.9 |
−1.30 | 0.96 | 1.20 × 10⁻³ | 0.71 | 8.45 × 10⁻³ | 0.89 | 21.9 | |
−1.35 | 0.95 | 6.63 × 10⁻³ | 0.66 | 3.97 × 10⁻³ | 0.82 | 1.3 | |
SII | −1.25 | 0.99 | 1.59 × 10⁻³ | 0.44 | 1.20 × 10⁻² | 0.84 | 41.0 |
−1.30 | 0.99 | 1.49 × 10⁻³ | 0.47 | 1.12 × 10⁻² | 0.85 | 16.3 | |
−1.35 | 0.99 | 1.36 × 10⁻³ | 0.50 | 1.03 × 10⁻² | 0.89 | 5.3 | |
SIII | −1.2 | 0.96 | 2.73 × 10⁻³ | 0.32 | 2.34 × 10⁻² | 0.84 | 56.3 |
−1.25 | 0.80 | 3.18 × 10⁻³ | 0.28 | 2.25 × 10⁻² | 0.88 | 19.0 | |
−1.30 | 0.81 | 3.30 × 10⁻³ | 0.27 | 2.13 × 10⁻² | 0.89 | 10.9 |
R ct decreases remarkably at higher potentials for all cathodes, and a lower value corresponds to a faster reaction rate, at E = 1.3 V, the Rct fall below 22 Ω for all cathodes. It often means that the charge transfer process dominates the impedance response as the potential increases and the hydrogen evolution reaction is controlled by Heyrovsky step.40 The values of n lower than 1.0 is most likely arise from the uneven charging of the double layer due to microscopic surface roughness,18 thus the CPE behaves as non-ideal capacitor in the present case. The fitted values for capacitance C′dl are also listed in Table 3. The C′dl values determined from EIS are all higher than the Cdl values determined from CV. This is an indication that the C′dl contains contributions from pseudo-capacitance, probably arising from the adsorption of hydrogen on the surface.15
As shown in Fig. 6a, after 800 CV cycles, the potential required to achieve current densities of 0.025 A cm−2 and 0.12 A cm−2 for three cathodes all decreased by less than 1 mV and 10 mV, respectively. While the values for binary porous Ni–Cu cathode and flake Ni is 9.5 mV (at 0.12 A cm−2) and 126.0 mV (at 0.025 A cm−2), respectively, as shown in Fig. 6b and c. The corresponding current density decays for different cathodes during 800 CV cycles are collected in Table 4. Results clearly indicate that the Mo doped porous Ni–Cu cathodes have maintained their porous structure, as well as the electro-catalytic activity during this process in an alkaline environment.
Potential (V) | Flake Ni | Porous Ni–Cu | SI | SII | SIII |
---|---|---|---|---|---|
−1.35 | 34.2% | 3.5% | 1.1% | 1.1% | 1.7% |
−1.52 | 35.5% | 3.7% | 1.6% | 1.9% | 2.1% |
−1.70 | 36.6% | 3.8% | 1.8% | 2.1% | 2.3% |
Fig. 7 shows the chronovoltammetry measurements of Mo doped porous Ni–Cu cathodes at the constant electrolysis potential of −1.6 V. After five hours, a nearly stationary state can be seen for the porous Ni–Cu cathodes containing low content of Mo (≤6.0 wt%) during the HER, which indicates that their reactivity are maintained along the observed period. Nevertheless, the current density of the dense Ni flake cathode shows a significant and sustained decline during the whole electrolysis, which has been generally attributed to the subsurface Ni hydride formed on Ni cathode,20 suppressing further adsorption between Ni and active hydrogen.
![]() | ||
Fig. 7 Chronovoltammetry measurements on different cathodes for more than 62 hours at a constant potential of −1.6 V. |
In addition, although the current density of cathode SIII is overall higher than that observed for the other cathodes with lower Mo content, a gradually dropping appears after 40 hours. The loss in catalytic activity for cathode SIII (9.0 wt%) must be due to the removal of Mo species when in contact with the potassium hydroxide solution, as suggested by ICP analysis (Table 5). As shown in Table 5, the Mo concentration in electrolyte solution after 62 hours electrolysis for cathode SIII (9.0 wt%) is measured to be 6.75 mg L−1, significantly higher than the dissolved Mo concentration of other two systems. Even though there appears the decay of electro-catalytic activity, the porous structure still remains the interconnected morphology after the long-term electrolysis, as shown in Fig. 8. It has exactly reflected the greatest advantage of the porous alloy cathodes fabricated by powder metallurgy.
Cathodes | Ni (mg L−1) | Cu (mg L−1) | Mo (mg L−1) |
---|---|---|---|
SI | — | — | 0.47 |
SII | — | — | 0.69 |
SIII | — | — | 6.75 |
![]() | ||
Fig. 8 SEM micrograph and EDS analysis of the skeleton for porous Ni–Cu (9 wt% Mo) cathode after 62 h electrolysis at −1.6 V in 6.0 mol L−1 KOH. |
It can be demonstrated that the Mo incorporated in Ni–Cu solid solution presents more conductive for maintaining the stability of electro-catalytic during HER. Although the moderate Mo doped to Ni–Cu solid solution has obviously improved the electro-catalytic activity owing to the synergism between Ni–Cu and Mo, and it can not be ruled out that the mixed Mo phase has synergistic effect with Ni–Cu phase in cathode SIII (9.0 wt%), and more research is needed to design for interpreting other underlying information.
Moreover, the incorporation of Mo with lower content (≤6.0 wt%) imparts higher stability in hydrogen evolution to the porous Ni–Cu alloy without compromising corrosion resistance in alkaline solution. A single-phase ternary Ni–Cu(Mo) can not be obtained for cathode SIII (9.0 wt%) under the same preparation technology, in which the un-dissolved Mo particles, uniformly dispersed in the porous Ni–Cu skeleton, accounting for a resultant loss of activity over a long-term electrolysis. This research will open new possibilities for the development of diverse electrodes for electrochemical applications. The following work is necessary to optimize the porous structure as well as to modify the surface to obtain further improvement in the HER activity.
This journal is © The Royal Society of Chemistry 2015 |