Two-dimensional FTIR correlation spectroscopy reveals chemical changes in dissolved organic matter during the biodrying process of raw sludge and anaerobically digested sludge

Xiaowei Li , Xiaohu Dai *, Lingling Dai and Zhigang Liu
State Key Laboratory of Pollution Control and Resources Reuse, National Engineering Research Center for Urban Pollution Control, School of Environmental Science and Engineering, Tongji University, 1239 Siping Road, Shanghai 200092, PR China. E-mail: daixiaohu@tongji.edu.cn; lixiaowei419@163.com

Received 8th July 2015 , Accepted 18th September 2015

First published on 18th September 2015


Abstract

Chemical changes in dissolved organic matter (DOM) during the biodrying of raw sludge (RS) and anaerobically digested sludge (ADS) were analyzed by various techniques, e.g., two-dimensional FTIR correlation spectroscopy (2D FTIR COS). The results showed that the RS and ADS matrices achieved the desired biodrying performance after 18 days. Biodrying caused a decrease in the dissolved organic carbon content and an increase in the molecular weight, aromaticity, and fluorescent intensity of DOM in the sludge matrices. Compared with the RS matrix, the organic matter of the ADS was more biostable, resulting in a lower biodrying performance. The asynchronous map of 2D FTIR COS analysis showed the changes in the heteropolysaccharide first, followed by the protein-like groups in the matrices during the biodrying process, which was contrary to the previous results from anaerobic digestion. They supply the first evidence for the complementarities of anaerobic and aerobic processes in sludge organic compound degradation. 2D FTIR COS analysis is a feasible technique to explore the degradation characteristics of individual organic matters during the sludge treatment.

1. Introduction

Currently, sewage sludge treatment and disposal is perhaps one of the most urgent problems related to water treatment plants,1 because it is regarded as a considerable source of secondary pollution in aquatic environments. As one of the most widely used processes, anaerobic digestion is capable of converting biodegradable substances of sewage sludge to biogas (60–70% of methane, CH4),2 and reduces the amount of final sludge solids for disposal, and is considered a major and essential part of a modern WWTP. However, the anaerobically digested sludge (ADS) usually possesses undesirable characteristics such as viscosity and high content of volatile fatty acids, which are phytotoxic,3 inhibiting its land or resource utilization, and thus post-treatment of the ADS is required. Researches showed that the aerobic composting is feasible process for the ADS post-treatment.4–6 However, chemical changes in the organic matter of the ADS during the aerobic composting (or biodrying) process have not been fully investigated up to now.

Biodrying, as a novel alternative method of composting to treat dewatered sludge,7 has been demonstrated to be a prospective method for sludge volume reduction and pre-stabilization, which benefits short-term storage, transportation, and incineration.8 Different from the main objectives of composting to produce the compost with largely stabilized and mature property, the main purpose of the biodrying is to remove moisture and yield refuse-derived fuel (RDF).7 The main mechanism of biodrying is that the heat generated during the aerobic degradation of organic substances evaporates water and reduces moisture.7,9 Moisture removal results in an increase in the lower calorific value and a decrease in the viscosity and odors of the sludge.10 Biodrying has been widely used for the treatment of raw sludge (RS),9–13 but few studies report the treatment for the ADS.4 Considerable changes occur in the properties of sewage sludge, such as high humidity and low organic matter content, after anaerobic digestion,14 which creates differences between RS and ADS biodrying process properties, e.g., organic matter degradation characteristics. Therefore, exploration of the differences in organic matter degradation between the RS and ADS during the biodrying process is highly important for extending this process to ADS treatment.

Dissolved organic matter (DOM) represents the most active fraction of organic sewage sludge and can reflect the overall biochemical alteration of the total organic matter in sludge.15 Thus, clarifying its chemical changes is a feasible and efficient approach to gain further information about the organic matter degradation of sewage sludge during the biodrying process. Thus far, many analyses, including dissolved organic carbon (DOC), specific ultra-violet absorbance at 254 nm (SUVA254), and fluorescent excitation–emission matrix (EEM), have been used to investigate the chemical properties of DOM.15,16 DOC can serve as a general descriptor of DOM, while SUVA254 has served as an indicator of the aromatic character of DOM. Fluorescent EEM combined with regional integration techniques can qualitatively and quantitatively represent the changes in the fluorescent compounds (e.g., protein- and humic-like groups), but this approach is not able to characterize the features of nonfluorescent substances in DOM.

Fourier transform infrared (FTIR) spectroscopy is a commonly used technique that distinguishes and quantifies the molecular structure of the main functional groups in DOM, both fluorescent and nonfluorescent.17 However, with a conventional one-dimensional (1D) approach, it remains difficult to detect substantial changes in DOM samples because of the extreme heterogeneity of organic matter in sludge. Recently, two-dimensional FTIR correlation spectroscopy (2D FTIR COS) techniques have been developed, which can greatly enhance the spectral resolution and resolve the overlapped peak problems of conventional 1D FTIR spectroscopy.18–21 By distributing spectral intensity trends within a data set collected as a function of the perturbation sequence (e.g., time, temperature, pressure change, chemical reaction) over a second dimension, 2D FTIR COS reveals cross-correlations that probe the relative directions and sequential order of band intensity changes (i.e., structural variations) at the molecular level.20,22 To the best of our knowledge, this study is the first application of this technique to the analysis of chemical changes of DOM from sewage sludge, especially ADS, during the biodrying process.

The objectives of this study were: (1) to reveal the differences in the biodrying performance of the RS and ADS mixed with wheat residues (WR); (2) to investigate the changes in the chemical characteristics of DOM from the RS and ADS matrices during biodrying by fluorescence EEM and 2D FTIR COS spectroscopy. The study provides in-depth knowledge about the mechanisms of organic matter degradation during the sludge biodrying process, which is beneficial information for improving the sludge biodrying performance for the both RS and ADS.

2. Material and methods

2.1. Experimental procedure

Biodrying experiments were performed in insulated reactors composed of insulated polystyrene foam material (Fig. S1 of the ESI). The lab-scale reactors were designed according to the previous studies,6,23,24 with the inner height of 45 cm, inner length of 25 cm, inner width of 18 cm, and wall thickness of 45 mm. The effective volume of the reactors was approximately 20 L. Although the reactor volume was relatively small, a heat balance analysis showed that the heat applied for evaporation was 54.64–55.49% of total energy consumption, similar to the previous results by the ref. 25 and indicating that the reactor properties were acceptable. A perforated baffle with 2 mm mesh was fixed above the bottom of the reactor to support the sludge material and facilitate aeration. An air inlet and outlet was installed at the bottom and on the top, respectively. The aeration rate was 250 L h−1, with a 10 min run/20 min stop cycle during the entire biodrying process.

Sewage sludge was procured from the Anting wastewater treatment plant (WWTP) in Shanghai, China. Primary and excess sludge was collected and dewatered by centrifuge with the addition of organic flocculating agents. The raw dewatered sludge, as RS, was anaerobically digested in a 12 L mesophilic reactor (35 °C) until the biogas production stopped (at about 25 days), becoming ADS at this point. The ADS, thus produced, was collected and dewatered with the aid of high-molecular flocculants. WR as bulking materials were obtained from a flour mill factory in a suburb of Shanghai, China. The characteristics of the three materials are outlined in Table S1 of the ESI.

Two trials of RS and ADS mixed with the WR were conducted at 5[thin space (1/6-em)]:[thin space (1/6-em)]1 ratios of sludge[thin space (1/6-em)]:[thin space (1/6-em)]WR (w/w, wet basis). This ratio of sludge[thin space (1/6-em)]:[thin space (1/6-em)]WR was chosen based on previous studies.9,10,26 The total weight of the bulking materials for each trial was about 4.2 kg. The materials were turned every 3 days to homogenize them. All the experiments were duplicated.

2.2. Sampling and analysis

During the biodrying process, matrix temperature was determined by thermometer (WMY-01C, Huachen Co., China), with sensors installed at the top and bottom of the reactors. Cumulative temperature increase (CTI, °C d) was estimated according to previous work.8,9 The temporal evolutions of average temperature (a) and temperature cumulation (b) in the matrixes during bio-drying process were shown in Fig. S2 of the ESI. Approximately 80 g of the substrate in each reactor was sampled from the top, middle, and bottom when turning the sludge every three days. The subsamples from all three locations were mixed together. The weight of the sampled materials was subtracted from the mass change of total materials in the reactors. Dry matter content was measured by drying the samples at 105 °C for 24 h, and the water content was estimated by a difference between the total and dry-matter weights. The content of volatile solids (VS) was determined by heating the sample at 600 °C for 1 h in a muffle furnace. Another portion of the mixed subsamples was freeze-dried and passed through a 0.15 mm sieve. C, N and H contents of the freeze-dried samples were measured by an element analyzer (Vario EL III, Elementar, Germany), and their calorific values were determined by a calorimeter (5E-AC/PL, Hunan province, China).

2.3. DOM extraction and analysis

DOM was extracted from the freeze-dried and 0.15 mm-sieved samples using deionized water (solid to water ratio of 1[thin space (1/6-em)]:[thin space (1/6-em)]20) for 24 h on a horizontal shaker at room temperature. The suspensions were then centrifuged at 104g for 10 min and filtered through a 0.45 μm Whatman® membrane filter.15
2.3.1. Bulking analysis of DOM. Values for pH and electrical conductivity (EC) were measured using a Mettler Toledo pH and EC meter (Switzerland). Dissolved organic carbon (DOC) and total nitrogen (DTN) contents of the filtrates were measured by TOC-VCPN analyzer (Shimadzu, Japan). Dissolved chemical oxygen demand (DCOD) was measured using a DRB 200 COD analyzer (Hach, United States).17 The absorption spectra of the samples were determined via a Photolab 6600 ultraviolet-visible spectrophotometry spectrophotometer (WTW, Germany). Specific UV absorption wavelengths (SUVA254) were measured by dividing the UV absorption at 254 nm by the concentration of DOC and then multiplying by a factor of 1000.27 The molecular weights of the DOM samples were evaluated by the spectral ratio of the 275–295 nm slope to 350–400 nm slope (K275–295/K350–400 ratio), determined according to the absorption spectra as reported by the ref. 28.
2.3.2. Fluorescence EEM regional integration technique. Fluorescence EEM spectra were measured using a Hitachi F-7000 fluorescence spectrometer (Hitachi High Technologies, Tokyo, Japan) at room temperature. EEM spectra were gathered by scanning electromagnetic (Em) spectra from 290 to 550 nm at 5 nm increments and by varying the excitation (Ex) wavelength from 240 to 450 nm at 5 nm increments. The spectra were obtained at a scan rate of 1200 nm min−1 using Ex and Em slit bandwidths of 5 nm. Surfer 8.0 software and FRI technique29,30 were used to analyze the fluorescence spectral data.
2.3.3. 1D FTIR and 2D FTIR COS. 1D FTIR spectra were recorded on pellets obtained by pressing a mixture of 1 mg of freeze-dried DOM together with 100 mg of potassium bromide (KBr, IR grada). This mixture was then ground and homogenized19,31,32 and measured with a Nicolet 5700 FTIR spectrometer.

The 2D FTIR COS was carried out according to the previous work.21 In this study, operation time was applied as an external perturbation and a set of time-dependent FTIR spectra was obtained. To illustrate this technique, consider an analytical spectrum S(x,t). The variable x is the index variable representing the FTIR spectra caused by the perturbation variable t. The variable x was intentionally used instead of the general notation used in conventional 2D correlation equations, which are based on the spectral index v. In this way, analytical spectrum S(x, t) at n evenly spaced points at t (between Tmin and Tmax) can be expressed by the following equation:

 
Sj(x) = S(x,tj), j = 1, 2, …, n(1)

A set of dynamic spectra can be denoted as follows:

 
[S with combining tilde](x,t) = S(x,tj) − [S with combining macron](x)(2)
where [S with combining macron](x) represents the reference spectrum, which is generally the average spectrum and is given as follows:
 
image file: c5ra13069g-t1.tif(3)

The synchronous correlation intensity can be directly obtained from the following dynamic spectra:

 
image file: c5ra13069g-t2.tif(4)

Asynchronous correlation can be gained as follows:

 
image file: c5ra13069g-t3.tif(5)

The term Mjk corresponds to the jth column and the kth raw element of the discrete Hibert–Noda transformation matrix, which is defined by the following equation:

 
image file: c5ra13069g-t4.tif(6)

The intensity of a synchronous correlation spectrum (δ(x1,x2)) denotes simultaneous changes in two spectral intensities determined at x1 and x2 during the interval between Tmin and Tmax. Conversely, an asynchronous correlation spectrum (δ(x1,x2)) covers out-of-phase or sequential changes in spectral intensities measured at x1 and x2.

Prior to 2D analysis, the FTIR spectra were normalized by summing the absorbance from 4000–400 cm−1 and multiplying by 1000. Subsequently, normalized FTIR spectra were analyzed using principal component analysis (PCA) to reduce the level of noise.33 Finally, 2D correlation spectroscopy was conducted using 2Dshige software (Kwansei-Gakuin University, Japan).

3. Results and discussion

3.1. Biodrying performance of the RS and ADS matrices

Table 1 outlines properties of the biodrying process for the RS and ADS matrices. After biodrying, moisture removal rates for the RS and ADS matrices were 99.4% and 66.4%, respectively, implying that both of the two matrices achieved the desired biodrying performance. Compared with the ADS matrix, the RS matrix had a higher moisture removal rate and CTI, showing that it achieved a higher biodrying performance than the ADS matrix. The results indicated that anaerobic digestion reduced the biodrying potential of sewage sludge. Further, the RS matrix had higher VS, C, N and H loss rates and combustion heats, indicating that the RS matrix had higher organic matter degradation and bio-generated heat. Since aerobic degradation of organic matter supplied the bio-generated heat for removing the moisture of the matrix, it was meaningful to explore the organic compound degradation mechanisms at work in the matrix. To this end, substrate DOM was extracted and changes in its chemical characteristics analyzed by bulk analyses (e.g., DOC content and SUVA254), fluorescence EEM, 1D FTIR, and 2D FTIR COS techniques to reveal the chemical profile of organic matter degradation in sewage sludge during the biodrying process.
Table 1 Biodrying performance of the raw sludge (RS) and anaerobically digested sludge (ADS) with wheat residues as the bulking agent
Parameters RS matrix ADS matrix
Moisture reduction rate (%) 91.4 66.4
Cumulative temperature increase (CTI, °C d) 167 117
Volatile solid (VS) loss rate (%) 57.7 45.9
C loss rate (%) 56.85 41.07
N loss rate (%) 52.09 23.12
H loss rate (%) 55.64 36.30
Combustion heat (MJ kg−1 BVS) 21.91 19.92


3.2. Bulk analysis of DOM samples

Fig. 1 represents the bulk change in DOM fractions extracted from the RS and ADS matrices during the biodrying process. The initial pH values of the ADS and RS matrices were slightly alkaline (8.07) and weakly acidic (6.16), respectively. As biodrying time progressed, the pH value first decreased and then increased in the ADS matrix. It increased from 6.16 to 7.72 in the RS matrix. Duan et al. reported that the ADS usually has high contents of ammonia nitrogen (1000–2500 mg L−1).34 Thus, the pH decrease probably resulted from mineralization of ammonia nitrogen to nitrites/nitrates,31 while the pH increase might be attributed to the loss of volatile acids (Fig. S3 of the ESI).35 Matrix EC increased with time, primarily attributed to the degradation of organic matter and the release of different mineral salts in available forms, such phosphate and potassium.31
image file: c5ra13069g-f1.tif
Fig. 1 Bulk analyses of dissolved organic matter (DOM) in the raw sludge (RS) and anaerobically digested sludge (ADS) matrices during the biodrying process.

DOC and DCOD contents tended to drop, while the SUVA254 showed an increasing trend in the RS and ADS matrices, indicating that the biodrying process caused aerobic degradation of organic matter and an increase in the aromaticity of the DOM.15,16 Compared with the RS matrix, the ADS matrix had lower DOC and DCOD contents and higher rates of reduction of DOC and DCOD after biodrying, which indicates that the organic matter in the ADS contained less of the active fraction and was more biostable than in the RS.26 A possible reason for this was that some biodegradable components of the sludge organic matter (approximately a total of 30–50%) had degraded and been transformed to biogas during anaerobic digestion,6 resulting in the organic matter remaining in the ADS having a high biological stability.

Biodrying caused a decrease in DTN content in the RS matrix; decreased DOC/DTN and K275–295/K350–400 ratios in the RS and ADS matrices; and a slight increase in DTN content in the ADS matrix (Fig. 1). The reduction of the DTN content in the RS matrix may have resulted from the degradation of organic nitrogen and the volatilization of ammonia nitrogen. Previous studies showed that decreases in the DOC/DTN ratio corresponded to increases in the degree of maturity of the studied organic material (e.g., compost, soil, and sewage sludge).15,36 Additionally, Helms et al. reported that the K275–295/K350–400 ratio decreased with increasing molecular size, as high-molecular-weight organic material exhibited stronger light absorption at longer wavelengths.28 In the light of these previous findings, results from this study imply that biodrying led to an increase in the degree of maturity and molecular weight of DOM from the two matrices. Compared with the final substrates in the RS matrix, the ADS matrix had a lower DOC/DTN ratio and a higher K275–295/K350–400 ratio, implying that the organic matter in the ADS matrix was coupled with a higher degree of maturity and lower molecular weight than that in the RS matrix after biodrying.

Overall, biodrying caused an increase in the biostability and maturation of organic matter in the matrices, particularly in the ADS matrix. The ADS matrix contained organic matter that was less easily biodegradable than the RS matrix. These results were complimented and confirmed by findings that the ADS matrix had lower VS, C, N, and H loss rates than the RS matrix during the biodrying process.

3.3. Fluorescence EEM analysis of DOM samples

Fig. 2 shows the fluorescence EEMs of DOM in the matrices before and after biodrying. In the fluorescence EEM spectra, four main peaks were identified, in which excitation–emission matrix maxima are outlined as shown in Table 2. According to Chen et al.,29 Peak 1 is associated with tryptophan and protein-like compounds, Peak 2 with fulvic acid-like groups, and Peaks 3 and 4 with humic acid-like materials. In the initial samples, two peaks were found in the ADS matrix (Peaks 1 and 2), while just one peak was found in the RS matrix (Peak 1). After biodrying for 18 days, Peak 4 was identified in both the ADS and the RS matrices, indicating the formation of humic acid-like materials in the two matrices. However, at this time point, Peak 3 was absent in the ADS matrix, but found in the RS matrix. These results indicate that the ADS matrix had less formation of humic acid-like groups (i.e., bio-stabilized matter) than the RS matrix after biodrying. Less formation of humic acid-like groups was possibly resulted from less degradation of organic matter during biodrying, implying that the ADS matrix contained less biodegradable organic matter than the RS matrix.
image file: c5ra13069g-f2.tif
Fig. 2 Fluorescence EEM spectra of DOM in the raw sludge (RS) and anaerobically digested sludge (ADS) matrices before (B) and after (A) the biodrying process.
Table 2 Excitation–emission matrix maxima of DOM from the mixtures before and after biodrying
DOM Peak 1 Peak 2 Peak 3 Peak 4
Ex/Ema SFIb Ex/Em SFI Ex/Em SFI Ex/Em SFI
a Excitation/emission wavelength pairs. b Specific fluorescence intensity. c Raw sludge matrix before biodrying. d Raw sludge matrix after biodrying. e Anaerobically digested sludge matrix before biodrying. f Anaerobically digested sludge matrix after biodrying.
RS-Bc 280/344 237[thin space (1/6-em)]313
RS-Ad 280/334 199[thin space (1/6-em)]041 250/452 184[thin space (1/6-em)]698 290/420 168[thin space (1/6-em)]109 340/426 181[thin space (1/6-em)]934
ADS-Be 280/340 274[thin space (1/6-em)]058 240/394 223[thin space (1/6-em)]163
ADS-Af 280/332 280[thin space (1/6-em)]141 250/452 132[thin space (1/6-em)]222 330/418 86[thin space (1/6-em)]863


Fluorescence EEM regional integration (FRI), a quantitative method proposed by Chen et al.,29 was introduced to divide the EEM spectra into five excitation–emission regions (region I: tyrosine-like organic compounds; region II: tryptophan-like organic compounds; region III: fulvic acid-like materials; region IV: soluble microbial byproduct-like materials; region V: humic acid-like materials).29,30 The normalized excitation–emission area volumes (Φi,n and ΦT,n, referring to the value of region i and entire region) were determined by normalizing the cumulative excitation–emission area volumes to relative regional areas. These data and the percent fluorescence response (Pi,n) are presented in Fig. 3.


image file: c5ra13069g-f3.tif
Fig. 3 Evolutions of normalized excitation–emission area volumes (a) and percent fluorescence response of the DOM (b) during the biodrying process of raw sludge (RS) and anaerobically digested sludge (ADS).

Φ i,n and ΦT,n of DOM from both matrices tended to increase as biodrying progressed, implying that biodrying causes an increase in the intensity of fluorescent materials from DOM, and the fluorescent groups belong to biorefractory compound during biodrying process. The possible reason was that some non-fluorescent materials (e.g., volatile fatty acids, Fig. S3 of the ESI) in the matrices were biologically degraded during the biodrying process. Compared with the RS matrix, the ADS matrix had a higher ΦT,n, implying that more fluorescent materials were present in DOMs of the ADS matrix. The P1,n, P2,n, and P4,n of DOMs tended to decrease. Conversely, the P3,n and P5,n show an increasing tendency in the both matrices as biodrying progressed, indicating a decrease in the protein-like groups and an increase in the humic-like groups from the DOM extracts. In addition, there was a significant difference between the ADS and RS matrices in the degree of change of the P4,n and P5,n. The degree of change in the ADS matrix was much lower than that in the RS matrix, implying that, compared with the ADS matrix, more protein-like materials were degraded and more humic-acid-like materials were formed in the RS matrix. These results complement other data and confirm the finding that the RS matrix had more organic matter degradation, while the ADS matrix had higher bio-stability as exhibited by VS loss rate and bulk analyses of DOM.

Generally, the biodrying process caused an increase in the fluorescence intensity, humification degree, and aromaticity of organic matter in the sludge. Compared with the RS matrix, the ADS matrix had less formation of humic acid-like materials and less degradation of organic matter, which compliments and confirms the findings from the bulk analyses of DOMs.

3.4. 1D FTIR spectroscopy of DOM samples

The 1700–900 cm−1 region of the FTIR spectra contains the main bands corresponding to amides, carboxylic acids, esters, aliphatic group, and carbohydrates,22 and thus changes in the FTIR region were mainly analyzed. Fig. 4 shows that the intensities of the bands at 1641, 1573, 1457, 1409, 1319 and 1273 cm−1 tended to decrease and those at 1186, 1105, and 1066 cm−1 tended to increase in the RS matrix with time during the biodrying process. The intensity of the bands at 1662, 1556, 1438, 1413 and 995 cm−1 tended to decrease and those at 1192, 1140 and 1103 cm−1 tended to increase in the ADS matrix. The results implied that the RS and ADS matrices had the similar changes in the intensity of the bands during biodrying process.
image file: c5ra13069g-f4.tif
Fig. 4 Changes in the relative intensities of specific absorption bands in the FTIR spectra of DOM samples during the biodrying process of the raw sludge (RS) and anaerobically digested sludge (ADS).

According to the ref. 17, 22 and 31, these bands were assigned as the followings: the band at 1651–1655 cm−1 to the COO stretching of amide I; 1540–1570 cm−1 to the N–H deformation of amine II; 1458–1456 cm−1 to the C–H stretching of aliphatic group; 1419–1439 cm−1 to the COO stretching of carboxylic acids; 1319 cm−1 to the C–N stretching of aromatic primary and secondary amines; 1273 cm−1 to the C–O stretching of carboxylic acids; 1191–1193 cm−1 to the C–O stretching of aryl ethers and phenols; 1140–1103 cm−1 to the C–OH stretching of aliphatic OH; 1066 to the C–O stretching of polysaccharide-like substances; 995 cm−1 to the C–H deformation of unsaturated hydrocarbons. Thus, the above results shows that biodrying led to a decrease in the amide I, amide II, carboxylic acids, and aliphatic group, and an increase in the aryl ethers and phenols, aliphatic OH and polysaccharide-like substances in DOMs of the sludge matrices.

According to the ref. 37, the 1700–900 cm−1 FTIR spectra could be also clustered three regions of 1700–1482 cm−1 (amide I and amide II region mainly related to protein structure conformation), 1482–1190 cm−1 (mainly associated with structural carbohydrates) and 1190–1000 cm−1 (mainly related to non-structural carbohydrates). The results also shows that the protein-like group and structural carbohydrates (e.g. cellulose) had a decreasing trend in the DOMs from the sludge matrices, but the non-structural carbohydrates (e.g. heteropolysaccharide) trended to increase in the DOMs from the matrices with time during the biodrying process, which corresponded to the results from the ref. 17. Additionally, the region of 1190–1000 cm−1 was also assigned to the C–OH groups (alcohols), and the formation of some of the C–OH groups might be related with the hydrolysis of biopolymeric organic matter. Thus, the increase in the intensity of the 1190–1100 cm−1 region from the DOM FTIR spectra during the biodrying process was partially resulted from the accumulation of some water-soluble and biorefractory hydrolysis-product in the DOMs.

Compared with the ADS matrix, the RS matrix had more remarkable decrease in the region of 1482–1190 cm−1, but less increase in the 1190–1100 cm−1 region. The results shows that the DOMs from the RS matrix had more decrease in structural carbohydrates (e.g. cellulose), but less increase in non-structural carbohydrates (e.g. heteropolysaccharide) than the DOMs from the ADS matrix during the biodrying process. They implied that there was more easily biodegradable organic matter (e.g. cellulose) in the RS matrix than in the ADS matrix, while the ADS matrix might contain more biorefractory compound, possibly severed as protective polysaccharide layer around bacterial cell,17 than the RS matrix.

3.5. 2D FTIR COS of DOM samples

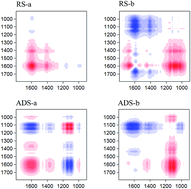
2D FTIR COS of the 1700–900 cm−1 region was implemented to investigate the degree and order of changes in the organic matter with time during biodrying.17,19Fig. 5 shows the synchronous and asynchronous maps of the RS and ADS matrices. The synchronous maps show that two and three main autopeaks occurred in the RS and ADS matrices, respectively (Fig. 5a). According to Noda and Ozaki,21 an autopeak in the synchronous maps denotes the overall susceptibility of the corresponding spectral region to changes in spectral intensity as external perturbations are applied to the system. The results show that the susceptibility of band intensity followed the order 1599 > 1406 cm−1 in the RS matrix and 1103 > 1144 > 1599 cm−1 in the ADS matrix. Correspondingly, the susceptibility of the organic matter to degradation with time during biodrying followed the order of the N–H deformation of amide II > the COO stretching of carboxylic acids in the RS matrix, and the C–OH stretching of aliphatic OH > the N–H deformation of amine II in the ADS matrix. In total, there were significant differences between the RS and ADS matrices in the susceptibility of the organic matter to degradation with time of biodrying. For example, the amide II (protein-like group) was the organic compound with the highest susceptibility in the RS matrix, but the aliphatic OH (heteropolysaccharide) were the most susceptible compound in the ADS matrix.
image file: c5ra13069g-f5.tif
Fig. 5 Synchronous (a) and asynchronous (b) 2D correlation maps generated from the 1000–1700 cm−1 regions of the DOM-FTIR spectra in the raw sludge (RS) and anaerobically digested sludge (ADS) matrices during the biodrying process. Red represents positive correlations and blue represents negative correlations; higher color intensity indicates a stronger positive or negative correlation.

Off-diagonal peaks (cross-peaks) in the synchronous map display correlated signals.17 A crosspeak expresses simultaneous or coincidental changes in spectral intensities at two different spectral variables.19 One main crosspeak at (1595, 1406) cm−1 in the RS matrix and three main crosspeaks at (1599, 1458), (1599, 1375), and (1599, 991) cm−1 in the ADS matrix were positively correlated. In addition, two main crosspeaks at (1595, 1153) and (1595, 997) cm−1 in the RS matrix and six main crosspeaks at (1599, 1193), (1599, 1144), (1599, 1103), (1375, 1144), (1375, 1103) and (1144, 991) cm−1 in the ADS matrix were negatively correlated. These correlations, combined with the results of 1D FTIR spectra, revealed that the signals from amide II and carboxylic acid were decreasing but the aliphatic OH and heterocyclic aromatic compounds were increasing with biodrying time in the RS matrix. Simultaneously, signal intensity from the amide II, carboxylic acid, cellulose and unsaturated hydrocarbon were decreasing but the aliphatic OH, and aryl ethers and phenols were increasing with time in the ADS matrix during the biodrying process. Totally, they show that the RS and ADS matrices had similar tendencies of change in some organic groups, such as amide II, carboxylic acid, aliphatic OH; yet there are some differences in changes of some other organic groups, e.g. heterocyclic aromatic compounds were found to increase in the RS matrix, while aryl ethers and phenols in the ADS matrix.

An asynchronous map can supply useful information about the sequential order of change (or degradation) of different organic materials during the biodrying process.19 Ten and eight main crosspeaks were found in the asynchronous maps of the RS and ADS matrices, respectively (Fig. 5b). On the basis of the findings of Noda and Ozaki,21 changes in bands of DOM from the RS matrix followed the specific sequence: (1026, 1103 and 1146) → (1668 and 1446) → 1406 → 1593 cm−1 and (1381 and 1547) → 1591 cm−1. These results show that the changes in the polysaccharide-like substances and aliphatic OH occurred before the amide I and aliphatic group, followed by the carboxylic acids, and amide II; the changes in the cellulose happened before the amide II in the DOMs from the RS matrix. Meanwhile, changes in the bands of DOM from the ADS matrix followed the sequential order: (1103 and 1142) → 1435 → 1668 → 1587 cm−1 and (1103 and 1142) → (991 and 1041) cm−1. These results show that changes in the aliphatic OH occurred before carboxylic acids, followed by amide I and amide II; the changes in the aliphatic OH happened before the polysaccharide-like substances and unsaturated hydrocarbons in the DOMs from the ADS matrix. In total, the ADS matrix had a similar order of change in different organic materials as the RS matrix.

According to the ref. 19 and 37, the results also show that the non-structural carbohydrates (e.g. heteropolysaccharide) degraded firstly, followed by the structural carbohydrates (e.g. cellulose), and the protein-like groups in the two matrices. This corresponds to the results of Yu et al.19 regarding changes in DOMs during the aerobic composting of swine manure, but differs from the findings of Li et al.17 during the anaerobic digestion of sewage sludge. Li et al.17 speculated that there were possibly two factors affecting changing order of DOMs with time during the treatment process, i.e., treatment conditions (aerobic or anaerobic) and substrate property (sludge or manure). Results from the present study show that the treatment condition was possibly a more important factor than substrate property in influencing the DOM degradation characteristics. The possible reason was that aerobic and anaerobic microbes had different biodegradation property for different organic matter in the sludge, causing that there were different order of degradation for sludge organic matter between the anaerobic and aerobic conditions.

3.6. The significance of the study

Characteristics of organic matter degradation are some of the most important points to study in sludge biodrying, as the heat generated during the aerobic degradation of organic substances in sewage sludge is the main driving force of the process. Exploring the chemical changes in DOM is desired to reveal the mechanisms of organic matter degradation during the sludge biodrying process. Additionally, although the results from the study of biodrying performance implied that the anaerobic digestion reduced the sludge biodrying potential through the comparison of the RS and ADS matrices, it is unclear how anaerobic digestion to affect the chemical changing characteristics of sludge DOMs during post-biodrying process.

Bulk analysis of DOMs showed that biodrying led to a decrease in the DOC and DCOD contents and an increase in the molecular weight and aromaticity of DOM from the sludge matrices. Fluorescence EEM analysis revealed that the fluorescent groups (e.g. humic-like groups and microbial by-product) in DOM of the sludge matrices enriched with time during biodrying process. 1D FTIR and the synchronous maps of 2D FTIR COS demonstrated that the protein-like group tended to decrease, but the heteropolysaccharide had an increasing tendency in the DOMs of the sludge biodrying process. Thus, these results implied that these easily biodegraded organic matters appear with the characteristics of low-molecular-weight, non-aromaticity and non-fluorescent property in the sludge matrices during biodrying process, some of which seemed belong to the protein-like group.

Many researches showed that anaerobic and sequential aerobic sludge treatment (digestion or composting) could more significantly improve the solid reduction, dewatering properties and phytotoxicity, compared with anaerobic treatment alone.4–6,38–40 Novak and Park41 proposed that organic compounds in sludge have many fractions. Banjade et al. speculated that each anaerobic and aerobic digestion of sludge can degrade only some fractions of the sludge, and thus the combination of both of these types of digestion can be complementary to each other in that it can be capable of degrading more fractions in the sludge using both anaerobic and aerobic environments.40 However, it is absent of direct data (or evidence) to explore the degradation characteristics of different organic groups in anaerobic or aerobic conditions. In the present study, the asynchronous map of 2D FTIR COS showed that the changes in carbohydrate-like groups (e.g. heteropolysaccharide) occurred before the protein-like groups during sludge biodrying process. On the contrary, the previous study revealed that the changes in the protein-like groups happened before the carbohydrate-like groups during sludge anaerobic digestion process.17 The results implied that the degradation of protein-like and carbohydrate-like groups of sludge in aerobic condition (biodrying) might be complementary to their degradation in anaerobic condition. Thus, the 2D FTIR COS analysis firstly provided the direct evidence for the complementarities of anaerobic and aerobic process in organic compound degradation. The further investigation needs to do why the degradation of protein-like and carbohydrate-like group are different in the anaerobic and aerobic conditions.

Compared with the RS matrix, the ADS matrix had lower DOC and DCOD content, and more fluorescent groups, and further less degradation of organic matter (e.g. protein and cellulose) and formation of humic-like materials and more enrichment of biorefractory organic matter (e.g. heteropolysaccharide) during biodrying process, implying that the organic matter of the ADS matrix was more biostable than the RS matrix. They compliment and confirm the findings of lower biodrying performance in the ADS matrix versus the RS matrix. Thus, we speculated that ADS matrix might need a shorter treatment time, and then requires less land occupation for biodrying or aerobic stabilization due to the presence of less biodegradable organic matter, compared with the RS matrix.

4. Conclusions

Biodrying improved the biostability and maturity of organic matter in the two sludge matrices. The ADS matrix had more biostable organic matter than the RS matrix, causing less biodrying performance, implying that it might require shorter time for the biostabilization. During the biodrying process, the protein-like groups seemed more easily biodegraded than aliphatic OH substances, but the change of aliphatic OH (e.g. heteropolysaccharide) occurred before the protein-like groups. 2D FTIR COS technique supplied new insights about the changing characteristics of individual organic fractions during sludge biodrying process at a molecular level. The difference in the chemical changes of organic matter between the aerobic and anaerobic condition supplied the evidence for the presence of their complementarities in organic matter degradation. However, the further study needs to do why the degradations of protein-like and carbohydrate-like groups are different in the anaerobic and aerobic conditions.

Acknowledgements

This work was financially supported by the National Natural Scientific Foundation of China (51408423), Key Program of National Natural Science of China (51538008), National Water Pollution Control, Management Technology Major Projects (2013ZX07315003), International Cooperation and Exchange Program of Shanghai Committee of Science and Technology (2012DFG91380) and Postdoctoral Science Foundation of China (2013M541545, 2015T80452).

References

  1. S.-J. Yuan and X.-H. Dai, Appl. Catal., B, 2014, 154–155, 252–258 CrossRef CAS PubMed.
  2. Y. Cao and A. Pawłowski, Renewable Sustainable Energy Rev., 2012, 16, 1657–1665 CrossRef CAS PubMed.
  3. M. Bustamante, J. Alburquerque, A. Restrepo, C. de la Fuente, C. Paredes, R. Moral and M. Bernal, Biomass Bioenergy, 2012, 43, 26–35 CrossRef CAS PubMed.
  4. X. W. Li, X. H. Dai, S. J. Yuan, N. Li, Z. G. Liu and J. W. Jin, Bioresour. Technol., 2015, 175, 245–253 CrossRef CAS PubMed.
  5. M. Negre, C. M. Monterumici, D. Vindrola and G. Piccone, J. Environ. Sci. Health, Part A: Environ. Sci. Eng., 2011, 46, 509–517 CrossRef CAS PubMed.
  6. K. Nakasaki, L. T. H. Tran, Y. Idemoto, M. Abe and A. P. Rollon, Bioresour. Technol., 2009, 100, 676–682 CrossRef CAS PubMed.
  7. C. Velis, P. J. Longhurst, G. H. Drew, R. Smith and S. J. Pollard, Bioresour. Technol., 2009, 100, 2747–2761 CrossRef CAS PubMed.
  8. D.-Q. Zhang, P.-J. He, T.-F. Jin and L.-M. Shao, Bioresour. Technol., 2008, 99, 8796–8802 CrossRef CAS PubMed.
  9. L. Zhao, W.-M. Gu, P.-J. He and L.-M. Shao, Water Res., 2010, 44, 6144–6152 CrossRef CAS PubMed.
  10. L. Zhao, W.-M. Gu, P.-J. He and L.-M. Shao, Water Res., 2011, 45, 2322–2330 CrossRef CAS PubMed.
  11. L. Cai, T.-B. Chen, D. Gao, G.-D. Zheng, H.-T. Liu and T.-H. Pan, Water Res., 2013, 47, 4767–4773 CrossRef CAS PubMed.
  12. L. Cai, D. Gao, T.-B. Chen, H.-T. Liu, G.-D. Zheng and Q.-W. Yang, Bioresour. Technol., 2012, 117, 13–19 CrossRef CAS PubMed.
  13. S. Navaee-Ardeh, F. Bertrand and P. R. Stuart, Bioresour. Technol., 2010, 101, 3379–3387 CrossRef CAS PubMed.
  14. T. Gea, R. Barrena, A. Artola and A. Sánchez, Waste Manag., 2007, 27, 1108–1116 CrossRef CAS PubMed.
  15. M. Xing, X. Li, J. Yang, Z. Huang and Y. Lu, J. Hazard. Mater., 2012, 205, 24–31 CrossRef PubMed.
  16. Z.-H. Shao, P.-J. He, D.-Q. Zhang and L.-M. Shao, J. Hazard. Mater., 2009, 164, 1191–1197 CrossRef CAS PubMed.
  17. X. Li, X. Dai, J. Takahashi, N. Li, J. Jin, L. Dai and B. Dong, Bioresour. Technol., 2014, 159, 412–420 CrossRef CAS PubMed.
  18. J. Hur and B.-M. Lee, Chemosphere, 2011, 83, 1603–1611 CrossRef CAS PubMed.
  19. G.-H. Yu, Z. Tang, Y.-C. Xu and Q.-R. Shen, Environ. Sci. Technol., 2011, 45, 9224–9231 CrossRef CAS PubMed.
  20. W. Chen, C. Qian, X.-Y. Liu and H.-Q. Yu, Environ. Sci. Technol., 2014, 48, 11119–11126 CrossRef CAS PubMed.
  21. I. Noda and Y. Ozaki, Two-dimensional correlation spectroscopy: applications in vibrational and optical spectroscopy, John Wiley & Sons, 2005 Search PubMed.
  22. H. A. Abdulla, E. C. Minor and P. G. Hatcher, Environ. Sci. Technol., 2010, 44, 8044–8049 CrossRef CAS PubMed.
  23. M. A. Chowdhury, A. de Neergaard and L. S. Jensen, Environ. Technol., 2014, 35, 220–231 CrossRef CAS PubMed.
  24. J. Ge, G. Huang, Z. Yang, J. Huang and L. Han, Environ. Sci. Technol., 2014, 48, 5043–5050 CrossRef CAS PubMed.
  25. H. Ahn, T. Richard and H. Choi, Process Biochem., 2007, 42, 215–223 CrossRef CAS PubMed.
  26. V. Banegas, J. Moreno, J. Moreno, C. Garcia, G. Leon and T. Hernandez, Waste Manag., 2007, 27, 1317–1327 CrossRef CAS PubMed.
  27. H. Xu and H. Jiang, Water Res., 2013, 47, 6506–6515 CrossRef CAS PubMed.
  28. J. R. Helms, A. Stubbins, J. D. Ritchie, E. C. Minor, D. J. Kieber and K. Mopper, Limnol. Oceanogr., 2008, 53, 955 CrossRef.
  29. W. Chen, P. Westerhoff, J. A. Leenheer and K. Booksh, Environ. Sci. Technol., 2003, 37, 5701–5710 CrossRef CAS.
  30. X. Li, M. Xing, J. Yang, L. Zhao and X. Dai, J. Hazard. Mater., 2013, 261, 491–499 CrossRef CAS PubMed.
  31. X. Li, M. Xing, J. Yang and Z. Huang, J. Hazard. Mater., 2011, 185, 740–748 CrossRef CAS PubMed.
  32. G.-H. Yu, M.-J. Wu, G.-R. Wei, Y.-H. Luo, W. Ran, B.-R. Wang, J. c. Zhang and Q.-R. Shen, Environ. Sci. Technol., 2012, 46, 6102–6109 CrossRef CAS PubMed.
  33. H. Babamoradi, F. van den Berg and Å. Rinnan, Chemom. Intell. Lab. Syst., 2013, 120, 97–105 CrossRef CAS PubMed.
  34. N. Duan, B. Dong, B. Wu and X. Dai, Bioresour. Technol., 2012, 104, 150–156 CrossRef CAS PubMed.
  35. E. Romero, C. Plaza, N. Senesi, R. Nogales and A. Polo, Geoderma, 2007, 139, 397–406 CrossRef CAS PubMed.
  36. J. Polak, W. Sułkowski, M. Bartoszek and W. Papież, J. Mol. Struct., 2005, 744, 983–989 CrossRef PubMed.
  37. I. Gamage, A. Jonker, X. Zhang and P. Yu, Spectrochim. Acta, Part A, 2013, 118, 407–421 CrossRef PubMed.
  38. J. T. Novak, S. Banjade and S. N. Murthy, Water Res., 2011, 45, 618–624 CrossRef CAS PubMed.
  39. N. Kumar, Master degree, Virginia Polytechnic Institute and State University, 2006.
  40. S. Banjade, Master degree, Virginia Polytechnic Institute and State University, 2008.
  41. J. T. Novak and C. Park, Water Sci. Technol., 2004, 49, 73–80 CAS.

Footnote

Electronic supplementary information (ESI) available: Table S1 showing the characteristics of the raw materials; Fig. S1 showing the schematic diagram of the biodrying system; Fig. S2 showing that temporal evolutions of average temperature (a) and temperature cumulation (b) in the matrixes during bio-drying process; Fig. S3 showing the contents of volatile fatty acids in the DOMs during the biodrying process of RS and ADS matrices. See DOI: 10.1039/c5ra13069g

This journal is © The Royal Society of Chemistry 2015
Click here to see how this site uses Cookies. View our privacy policy here.