Fractionation of carboxylate anions from aqueous solution using chitosan cross-linked sorbent materials
M. H.
Mohamed
a,
I. A.
Udoetok
a,
L. D.
Wilson
*a and
J. V.
Headley
b
aDepartment of Chemistry, University of Saskatchewan, 110 Science Place, Saskatoon, Saskatchewan S7N 5C9, Canada. E-mail: lee.wilson@usask.ca; Fax: +1-306-966-4730; Tel: +1-306-966-2961
bWater Science and Technology Directorate, Environment Canada, 11 Innovation Boulevard, Saskatoon, Saskatchewan S7N 3H5, Canada
First published on 21st September 2015
Abstract
The sorptive uptake properties are reported for chitosan and cross-linked chitosan-glutaraldehyde (CG) polymers with single component carboxylic acids (surrogates; Si, i = 1–4). The single component surrogates are treated as model compounds to represent traditional naphthenic acids (NAs) with variable hydrogen deficiency (z) and carbon number (C), as follows: 2-hexyldecanoic acid (z = 0 and C = 16; S1), trans-4-pentylcyclohexanecarboxylic acid (z = −2 and C = 12; S2), dicyclohexylacetic acid (z = −4; C = 14; S3) and 2-ethyl hexanoic acid (z = 0 and C = 8; S4). Cross-linked polymers were synthesized at variable C![[thin space (1/6-em)]](https://www.rsc.org/images/entities/char_2009.gif) :
:![[thin space (1/6-em)]](https://www.rsc.org/images/entities/char_2009.gif) G mole ratios (i.e. 1
G mole ratios (i.e. 1![[thin space (1/6-em)]](https://www.rsc.org/images/entities/char_2009.gif) :
:![[thin space (1/6-em)]](https://www.rsc.org/images/entities/char_2009.gif) 400, 1
400, 1![[thin space (1/6-em)]](https://www.rsc.org/images/entities/char_2009.gif) :
:![[thin space (1/6-em)]](https://www.rsc.org/images/entities/char_2009.gif) 700, and 1
700, and 1![[thin space (1/6-em)]](https://www.rsc.org/images/entities/char_2009.gif) :
:![[thin space (1/6-em)]](https://www.rsc.org/images/entities/char_2009.gif) 1000) and characterized using FTIR and TGA. The uptake studies were evaluated at pH 6.00 and 9.00 in aqueous solution. Corresponding equilibrium uptake parameters were evaluated by several isotherm models (Sips, Freundlich, and Langmuir). The Freundlich model provided the “best-fit” for S1, S2 and S3. The Sips isotherm model gave the “best-fit” results for S4. The Freundlich sorption affinity constant (KF; L mg g−1) and the Sips monolayer adsorption capacity (Qm; mg g−1) for the sorbent systems was estimated. The parameters for each Si vary as the C
1000) and characterized using FTIR and TGA. The uptake studies were evaluated at pH 6.00 and 9.00 in aqueous solution. Corresponding equilibrium uptake parameters were evaluated by several isotherm models (Sips, Freundlich, and Langmuir). The Freundlich model provided the “best-fit” for S1, S2 and S3. The Sips isotherm model gave the “best-fit” results for S4. The Freundlich sorption affinity constant (KF; L mg g−1) and the Sips monolayer adsorption capacity (Qm; mg g−1) for the sorbent systems was estimated. The parameters for each Si vary as the C![[thin space (1/6-em)]](https://www.rsc.org/images/entities/char_2009.gif) :
:![[thin space (1/6-em)]](https://www.rsc.org/images/entities/char_2009.gif) G mole ratio increases (KF, S1: 0.00800–6.65, S2: 1.41–2.45, S3: 1.29–2.93 and Qm, S4: 28.4–33.5). Differences in the uptake of Si species by the sorbents were attributed to steric effects between Si with ring systems (z < 0) versus linear alkyl fragments (z = 0). Fractionation of equimolar mixtures of Si reveal that the sorbents display unique and variable binding affinity with remarkable molecular selective uptake (given in parentheses; L mg g−1): S1 (4–30) > S2 (4–10) > S3 (3–9). The fractionation efficacy of Si species is attributed to molecular sieving effects due to the tunable micropore sites of the cross-linked polymer, in accordance with the variable cross-linker content of the chitosan framework. Regeneration studies revealed the utility of these materials in cyclic adsorption–desorption processes.
G mole ratio increases (KF, S1: 0.00800–6.65, S2: 1.41–2.45, S3: 1.29–2.93 and Qm, S4: 28.4–33.5). Differences in the uptake of Si species by the sorbents were attributed to steric effects between Si with ring systems (z < 0) versus linear alkyl fragments (z = 0). Fractionation of equimolar mixtures of Si reveal that the sorbents display unique and variable binding affinity with remarkable molecular selective uptake (given in parentheses; L mg g−1): S1 (4–30) > S2 (4–10) > S3 (3–9). The fractionation efficacy of Si species is attributed to molecular sieving effects due to the tunable micropore sites of the cross-linked polymer, in accordance with the variable cross-linker content of the chitosan framework. Regeneration studies revealed the utility of these materials in cyclic adsorption–desorption processes.
1. Introduction
Aquatic environments are exposed to anthropogenic activities that result in the uncontrolled production and release of wastewater effluent.1,2 This has resulted in environmental regulations by various bodies such as the World Health Organization (WHO), Environmental Protection Agency (EPA) and the Government of Canada in attempts to control the release of deleterious substances into aquatic environments.3 In Northern Alberta, Canada, persistent organic pollutants known as naphthenic acids represent a class of chemical by-products that are enriched from the processing of bitumen from the oil sands extraction via the Clark hot water extraction process.4The resulting saline wastewater stream obtained from the Clark process (oil sands process water, OSPW) contains a complex mixture of organic compounds. OSPW contains an organic acid fraction referred to as naphthenic acids (NAs), comprised of a broad range of polar organics which include S and N heteroatom species along with classical NAs defined by the conventional formula, CnH2n+zO2, where “z” represents the “hydrogen deficiency” and is a negative even integer value.5–9 For the classical NAs, many isomers exist for a given z-value and the carboxylic acid group is often linked to an aliphatic side chain, rather than directly to the alicyclic ring. The molecular weights differ by 14 amu (CH2) between n-series and by 2 amu (2H) between z-series.10 Naphthenic acids (CnH2n+zO2) may exist as naphthenate anions at alkaline conditions and are known to be toxic to aquatic organisms, algae, and mammals.7,11–16 Reports indicate that exposure of fish to mixtures of NAs, either commercially sourced or diluted levels (0.3–9.0 mg L−1) of OSPW, cause changes in the steady state blood components and carbon metabolism. NAs are known to have toxicological effects that lead to the disruption of cell membrane function, spinal deformations, tissue hemorrhaging, reduction in testosterone and estradiol levels, and growth reduction. OSPW levels (25 mg L−1) result in impaired reproduction. Changes in gill and liver histopathology occur at 0.9–1.7 mg L−1; whereas, levels between 1.4–7.5 mg L−1 cause developmental toxicity. Endocrine disruption and modulation of the normal endocrine processes in fish and amphibians are associated with exposure to mixtures containing NAs, according to recent studies.17–19 These results emphasize the need to develop an understanding of the relative toxicity of NAs and suitable processes for the controlled removal of NAs to environmentally safe levels.
The sorptive removal of waterborne contaminants using organic polymer materials was reviewed by Crini et al. for a wide range of organic dyes.20 The host–guest chemistry of β-cyclodextrin (β-CD) and its polymeric forms possess unique physicochemical properties when compared with conventional organic polymers, as evidenced in a recent review by Wilson et al.21 The incorporation of β-CD into cross-linked polymers affords materials with unique molecular selective uptake properties because the inclusion site of β-CD acts as the primary sorption domain of the polymer framework, while the cross-linker sites present secondary sorption sites.22–24
Macromolecular polysaccharides such as chitosan and cellulose are of considerable interest as sorbent materials for large-scale and industrial applications due to their low cost, relative abundance, and sustainable supply. Cellulose and chitosan differ according to their chemical structure and reactivity due to the functionalization at carbon-2 (OH versus NHR where R = H or COCH3) of the glucopyranosyl moiety. Chitosan contains a mixture of D-glucosamine and N-acetyl D-glucosamine units of variable composition depending on the hydrolysis reaction conditions employed for chitin. In contrast to β-CD polymers, there are sparse reports of the adsorption behaviour of chitosan with carboxylic acids or their anions.25–28 A unique series of cross-linked chitosan polymers were developed by Wilson and Xue as novel sorbent materials for the uptake of urea,29 along with some binary and ternary chitosan-based polymers for the removal of arsenate anions.30,31 A unique feature of chitosan–glutaraldehyde (CG) polymer materials is their enhanced uptake properties toward diverse types of hydrophilic adsorbates such as urea, arsenate, and p-nitrophenolate, as compared with unmodified chitosan.30,31 There is a need for development of new types of alternative biopolymer materials with improved uptake properties toward organic anions, cross-linked and modified chitosan may address this need due to their synthetic versatility and tunable properties.29–31 There are recent reports20,32–35 that describe the sorption of chitosan with dyes and other organic species, however; there are sparse examples for the sorption of carboxylate anions with chitosan or its modified polymers. Herein, we report the preparation and characterization of chitosan–glutaraldehyde (CG) polymers and a systematic study describing their adsorption properties with a series of single-component naphthenic acids in aqueous solution at two pH values (pH = 6 and 9). The results of this study highlight the first example of chitosan and its cross-linked materials for the uptake of single components and fractionation of complex mixtures of alkyl carboxylates in aqueous solution. This study contributes a greater understanding of the molecular level details of the adsorption properties for chitosan and its cross-linked materials. An improved understanding of cross-linking effects will contribute to the development of alternative low-cost chitosan-based sorbent materials which are suitable for large-scale controlled sequestration of NAs in aquatic environments.
2. Experimental
2.1 Materials
Low molecular weight chitosan with ∼75–85% deacetylation, sodium hydroxide, aqueous ammonia, glutaraldehyde, 2-hexyldecanoic acid (S1), trans-4-pentylcyclohexylcarboxylic acid (S2), 2,2-dicyclohexylacetic acid (S3) and 2-ethyl hexanoic acid (S4), were obtained from Sigma-Aldrich Canada Ltd (Oakville, ON). HPLC grade methanol was obtained from Fisher scientific, NJ, USA, whereas, ACS grade glacial acetic acid was obtained from EMD chemicals, NJ, USA. Samples were stored in 2 mL HPLC amber vials with screw-cap perforated Teflon-lined septa from Canadian Life Sciences. All the materials used for the synthesis were used as received without further purification.2.2 Synthesis of cross-linked chitosan
The synthesis of the cross-linked chitosan (chitosan–glutaraldehyde, CG-1![[thin space (1/6-em)]](https://www.rsc.org/images/entities/char_2009.gif) :
:![[thin space (1/6-em)]](https://www.rsc.org/images/entities/char_2009.gif) 700) was adapted from the work of Poon36 as follows: 6 g of low molecular weight chitosan was stirred in 600 mL of 5% v/v glacial acetic acid in a 1 L beaker until complete dissolution was achieved. To the resulting light yellow chitosan solution at pH 3.8, 6.3 mL of glutaraldehyde was added drop-wise over a one minute period with stirring at 550 rpm. The initial yellow solution gradually turned to dark yellow after stirring for 12 h. Complete gelation was achieved as evidenced by the gel inversion test.37 1 M NaOH solution was added gradually to the gel with vigorous stirring using a spatula followed by magnetic stirring, until the gel was mechanically broken and the mixture was raised to pH 7 where a brown coloured precipitate formed. The precipitate was separated from the supernatant by vacuum filtration and washed with several generous portions of cold Millipore water, followed by drying at ∼50 °C with grinding intermittently with a mortar and pestle. The resulting product was washed in a Soxhlet extractor with HPLC grade methanol followed by drying in a vacuum oven at 56 °C for 12 h. The polymer was ground in a mortar and pestle and then passed through a 40-mesh sieve. A similar procedure was adopted for the synthesis of other cross-linked materials with variable amounts of glutaraldehyde (cf.Table 1).
700) was adapted from the work of Poon36 as follows: 6 g of low molecular weight chitosan was stirred in 600 mL of 5% v/v glacial acetic acid in a 1 L beaker until complete dissolution was achieved. To the resulting light yellow chitosan solution at pH 3.8, 6.3 mL of glutaraldehyde was added drop-wise over a one minute period with stirring at 550 rpm. The initial yellow solution gradually turned to dark yellow after stirring for 12 h. Complete gelation was achieved as evidenced by the gel inversion test.37 1 M NaOH solution was added gradually to the gel with vigorous stirring using a spatula followed by magnetic stirring, until the gel was mechanically broken and the mixture was raised to pH 7 where a brown coloured precipitate formed. The precipitate was separated from the supernatant by vacuum filtration and washed with several generous portions of cold Millipore water, followed by drying at ∼50 °C with grinding intermittently with a mortar and pestle. The resulting product was washed in a Soxhlet extractor with HPLC grade methanol followed by drying in a vacuum oven at 56 °C for 12 h. The polymer was ground in a mortar and pestle and then passed through a 40-mesh sieve. A similar procedure was adopted for the synthesis of other cross-linked materials with variable amounts of glutaraldehyde (cf.Table 1).
| Reaction conditions | CG-1![[thin space (1/6-em)]](https://www.rsc.org/images/entities/char_2009.gif) : :![[thin space (1/6-em)]](https://www.rsc.org/images/entities/char_2009.gif) 400 400 |
CG-1![[thin space (1/6-em)]](https://www.rsc.org/images/entities/char_2009.gif) : :![[thin space (1/6-em)]](https://www.rsc.org/images/entities/char_2009.gif) 700 700 |
CG-1![[thin space (1/6-em)]](https://www.rsc.org/images/entities/char_2009.gif) : :![[thin space (1/6-em)]](https://www.rsc.org/images/entities/char_2009.gif) 1000 1000 |
|---|---|---|---|
| Glutaraldehyde content (mL) | 3.8 | 6.3 | 9 |
| Mass of chitosan (g) | 6 | 6 | 6 |
2.3 Characterization
![[thin space (1/6-em)]](https://www.rsc.org/images/entities/char_2009.gif) :
:![[thin space (1/6-em)]](https://www.rsc.org/images/entities/char_2009.gif) 10 followed by grinding in a small mortar and pestle. The DRIFT (Diffuse Reflectance Infrared Fourier Transform) spectra was operated in reflectance mode at room temperature with a resolution of 4 cm−1 over the 400–4000 cm−1 spectral range. Multiple scans were recorded and corrected relative to a background of pure KBr.
10 followed by grinding in a small mortar and pestle. The DRIFT (Diffuse Reflectance Infrared Fourier Transform) spectra was operated in reflectance mode at room temperature with a resolution of 4 cm−1 over the 400–4000 cm−1 spectral range. Multiple scans were recorded and corrected relative to a background of pure KBr.
![[thin space (1/6-em)]](https://www.rsc.org/images/entities/char_2009.gif) :
:![[thin space (1/6-em)]](https://www.rsc.org/images/entities/char_2009.gif) 1000, CG-1
1000, CG-1![[thin space (1/6-em)]](https://www.rsc.org/images/entities/char_2009.gif) :
:![[thin space (1/6-em)]](https://www.rsc.org/images/entities/char_2009.gif) 1000/NH3(aq) and various CG-1
1000/NH3(aq) and various CG-1![[thin space (1/6-em)]](https://www.rsc.org/images/entities/char_2009.gif) :
:![[thin space (1/6-em)]](https://www.rsc.org/images/entities/char_2009.gif) 1000/carboxylate anion systems were acquired using a TA Q20 thermal analyzer over a temperature range of 40–400 °C. A scan rate of 5 °C min−1 and dry nitrogen gas was used to regulate the sample temperature and sample compartment gas purging. The air dried samples were analyzed in hermetically sealed aluminum pans with a sample mass that ranged between 1.69 to 3.72 mg.
1000/carboxylate anion systems were acquired using a TA Q20 thermal analyzer over a temperature range of 40–400 °C. A scan rate of 5 °C min−1 and dry nitrogen gas was used to regulate the sample temperature and sample compartment gas purging. The air dried samples were analyzed in hermetically sealed aluminum pans with a sample mass that ranged between 1.69 to 3.72 mg.
![[thin space (1/6-em)]](https://www.rsc.org/images/entities/char_2009.gif) :
:![[thin space (1/6-em)]](https://www.rsc.org/images/entities/char_2009.gif) 1000 with 3 mL aqueous solution of 100 ppm surrogate 4 (S4) in a 2 dram vial. The sample mixture was equilibrated at room temperature on a horizontal shaker for 24 h. The desorption of the adsorbate was achieved by washing the polymer/S4 system with 7 mL Millipore water and the water removed from the vial leaving only the polymer complex. This was followed by the addition of 7 mL of acetone and agitation in a horizontal shaker for 30 min. The acetone-surrogate solution was removed from the vial and the polymer air-dried for 12 h. The analytical concentrations for the surrogates were measured before (Co) and after (Ce) uptake at equilibrium using a ThermoScientific LTQ Orbitrap Elite mass spectrometer. This procedure was repeated for two additional cycles of adsorption–desorption.
1000 with 3 mL aqueous solution of 100 ppm surrogate 4 (S4) in a 2 dram vial. The sample mixture was equilibrated at room temperature on a horizontal shaker for 24 h. The desorption of the adsorbate was achieved by washing the polymer/S4 system with 7 mL Millipore water and the water removed from the vial leaving only the polymer complex. This was followed by the addition of 7 mL of acetone and agitation in a horizontal shaker for 30 min. The acetone-surrogate solution was removed from the vial and the polymer air-dried for 12 h. The analytical concentrations for the surrogates were measured before (Co) and after (Ce) uptake at equilibrium using a ThermoScientific LTQ Orbitrap Elite mass spectrometer. This procedure was repeated for two additional cycles of adsorption–desorption.
2.4 Sorption studies
Fixed amounts (10 mg) of the powdered and sieved cross-linked or pristine chitosan (20 mg) were mixed with 3 mL of surrogate solutions in 2 dram vials at variable concentration. Samples were equilibrated at room temperature on a horizontal shaker table for 24 h. The analytical concentrations for the surrogates were measured before (Co) and after (Ce) uptake at equilibrium using a ThermoScientific LTQ Orbitrap Elite mass spectrometer. The samples were centrifuged to remove any residual polymer material prior to ESI-MS analysis. Uptake of S1, S2, or S3 was determined from the difference between Co and Ce values described by eqn (1).
 | (1) |
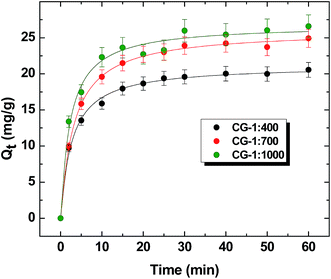
Batch uptake kinetics were studied for S1 with the three polymers and pristine chitosan, respectively. Approximately 10 mg of cross-linked polymer or ∼20 mg for pristine chitosan was placed in 2 dram vials followed by addition of 5 mL of S1. Each vial was shaken for specific time intervals (2, 5, 10, 15, 20, 30, 40, 50 and 60 min). The aliquots were quantified using mass spectrometry after phase separation of the solid polymer, as described above. Uptake of S1 at each time interval (t) where Co and Ct refer to the surrogate concentration at t = 0 and variable t values, according to eqn (2).
 | (2) |
![[thin space (1/6-em)]](https://www.rsc.org/images/entities/char_2009.gif) 000 while a full-scan mass spectrum was collected between m/z 100 and 600. Samples were quantified by extracting the mass range of the analyte of interest. For example, S3 was quantified by extraction of the mass range (m/z 223.16716–223.17398) and comparing the response area with a calibration standard. The electrospray ionization (ESI) interface was set to negative ionization mode. Mass spectrometer conditions were optimized by the transmission of m/z 112.98563. Parameters for the heated ESI interface (HESI) were as follows: source heater temperature (53 °C); spray voltage (2.86 kV); capillary temperature (275 °C); sheath gas flow rate (25 L h−1); auxiliary gas flow rate (5 L h−1); and spray current (5.25 μA).
000 while a full-scan mass spectrum was collected between m/z 100 and 600. Samples were quantified by extracting the mass range of the analyte of interest. For example, S3 was quantified by extraction of the mass range (m/z 223.16716–223.17398) and comparing the response area with a calibration standard. The electrospray ionization (ESI) interface was set to negative ionization mode. Mass spectrometer conditions were optimized by the transmission of m/z 112.98563. Parameters for the heated ESI interface (HESI) were as follows: source heater temperature (53 °C); spray voltage (2.86 kV); capillary temperature (275 °C); sheath gas flow rate (25 L h−1); auxiliary gas flow rate (5 L h−1); and spray current (5.25 μA).
 | (3) |
| Qe = KFCe1/nF | (4) |
 | (5) |
 | (6) |
Eqn (7) is the imprinting factor44 and is defined according to the ratio of the KF values (cf.eqn (4)) or the Qm values obtained from data fitting of the cross-linked polymer relative to that of unmodified chitosan for a given adsorbate system.
 | (7) |
Isotherms obtained under kinetic conditions were plotted as Qtvs. t (cf.eqn (2)) and analyzed using the pseudo-first order (PFO) and the pseudo-second order (PSO) kinetics models (cf.eqn (8) and (9)). Similar to the equilibrium isotherms, the SSE (cf.eqn (6)) was used as a criterion of the “best-fit” between theoretical and experimental values.
| Qt = Qe(1 − e−k1t) | (8) |
 | (9) |
3. Results and discussion
3.1 FT-IR characterization of cross-linked chitosan–glutaraldehyde polymers
The FT-IR spectra of chitosan, CG-1![[thin space (1/6-em)]](https://www.rsc.org/images/entities/char_2009.gif) :
:![[thin space (1/6-em)]](https://www.rsc.org/images/entities/char_2009.gif) 400, CG-1
400, CG-1![[thin space (1/6-em)]](https://www.rsc.org/images/entities/char_2009.gif) :
:![[thin space (1/6-em)]](https://www.rsc.org/images/entities/char_2009.gif) 700 and CG-1
700 and CG-1![[thin space (1/6-em)]](https://www.rsc.org/images/entities/char_2009.gif) :
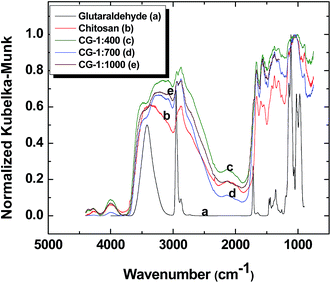
:![[thin space (1/6-em)]](https://www.rsc.org/images/entities/char_2009.gif) 1000, along with glutaraldehyde are shown in Fig. 1. The spectra show general features characteristic of different functional groups such as a broad band at ∼3000–3500 cm−1 due to the stretching of OH groups, ∼2800–3000 cm−1 attributed to C–H stretching, a vibrational band ∼1660 cm−1 indicative of adsorbed water, several bands ∼1000–1200 cm−1 which indicate C–O–H, C–O–C and C–N–H asymmetric stretching, and N–H bending that correspond to bands ∼1550–1640 cm−1. The spectra of the polymer materials bear similar features, in agreement with other reports of cross-linked chitosan.31,45 Comparison of the vibrational bands present in chitosan and glutaraldehyde with those for the cross-linked materials indicate that the amine and aldehyde groups responsible for these vibrational bands undergo cross-linking, as evidenced by an attenuation of their IR band intensity. The reduced IR band signature for glutaraldehyde confirms that cross-linking occurred between glutaraldehyde and chitosan45 due to the appearance of an imine bond (∼1604 cm−1). The absence of bands at 1715 cm−1 reveals that free glutaraldehyde is absent in the cross-linked chitosan. The vibrational bands ∼1000–1200 cm−1 in the FT-IR spectrum for glutaraldehyde indicate that it may exist as a cyclic aldehyde form.45,46
1000, along with glutaraldehyde are shown in Fig. 1. The spectra show general features characteristic of different functional groups such as a broad band at ∼3000–3500 cm−1 due to the stretching of OH groups, ∼2800–3000 cm−1 attributed to C–H stretching, a vibrational band ∼1660 cm−1 indicative of adsorbed water, several bands ∼1000–1200 cm−1 which indicate C–O–H, C–O–C and C–N–H asymmetric stretching, and N–H bending that correspond to bands ∼1550–1640 cm−1. The spectra of the polymer materials bear similar features, in agreement with other reports of cross-linked chitosan.31,45 Comparison of the vibrational bands present in chitosan and glutaraldehyde with those for the cross-linked materials indicate that the amine and aldehyde groups responsible for these vibrational bands undergo cross-linking, as evidenced by an attenuation of their IR band intensity. The reduced IR band signature for glutaraldehyde confirms that cross-linking occurred between glutaraldehyde and chitosan45 due to the appearance of an imine bond (∼1604 cm−1). The absence of bands at 1715 cm−1 reveals that free glutaraldehyde is absent in the cross-linked chitosan. The vibrational bands ∼1000–1200 cm−1 in the FT-IR spectrum for glutaraldehyde indicate that it may exist as a cyclic aldehyde form.45,46
3.2 Thermal gravimetric analysis (TGA) characterization
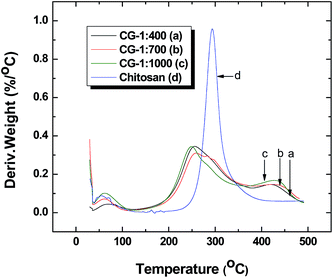
Thermal analysis provides information on polymer composition and evidence of host–guest interactions that provide complementary structural support typically obtained by NMR spectroscopy.22,47 TGA results for chitosan and the CG polymers are shown in Fig. 2. The main thermal event is characterized by a decomposition event for the materials between 200 to 400 °C. By contrast, pristine chitosan decomposes near 300 °C while the CG polymers decompose at lower temperatures (<300 °C), in agreement with other reports.29,31 The attenuated decomposition temperature range for cross-linked chitosan was attributed to the changes in thermal stability due to the cross-linking of chitosan and glutaraldehyde. The latter effect was affirmed by the attenuated IR band intensities, as described above. The event at ∼460 °C occurs within the thermal decomposition range anticipated for the glutaraldehyde cross-linker domains of the polymer materials. Thermal transitions that occur below 100 °C are attributed to the loss of water and/or residual solvents.29,303.3 Nitrogen adsorption
The nitrogen adsorption/desorption isotherm results for the CG-1![[thin space (1/6-em)]](https://www.rsc.org/images/entities/char_2009.gif) :
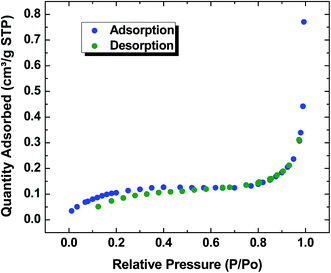
:![[thin space (1/6-em)]](https://www.rsc.org/images/entities/char_2009.gif) 1000 material is presented in Fig. 3. The shape of the isotherm corresponds to type II system according to the International Union of Pure and Applied Chemistry (IUPAC) designation. Type II describes adsorption on non-porous powders or on powders with pore diameter larger than micropores.47 The results obtained from this study show the completion of an adsorbed monolayer at low relative pressure (p/po) ∼ 0.2, with a BET surface area of 0.436 m2 g−1 and a pore width in the range of 4 to 17 nm. The isotherm displays low uptake of nitrogen up to a greater relative pressure (p/po ∼ 0.8), whereas; greater adsorption occurs at higher p/po (>0.8) due to adsorption at the outer surface of the polymer.48,49 Based on Fig. 3, ca. 90% of the gas is adsorbed on the grain boundaries while remainder occurs within the micropores of the polymer solid. The absence of hysteresis may be due to capillary evaporation and condensation which occurs reversibly at the same relative pressure.50,51 The effect may occur due to the collapse of the polymer framework which is magnified by the quantity of desorbed gas being lower than the quantity of adsorbed gas when p/po < 0.6.48,49
1000 material is presented in Fig. 3. The shape of the isotherm corresponds to type II system according to the International Union of Pure and Applied Chemistry (IUPAC) designation. Type II describes adsorption on non-porous powders or on powders with pore diameter larger than micropores.47 The results obtained from this study show the completion of an adsorbed monolayer at low relative pressure (p/po) ∼ 0.2, with a BET surface area of 0.436 m2 g−1 and a pore width in the range of 4 to 17 nm. The isotherm displays low uptake of nitrogen up to a greater relative pressure (p/po ∼ 0.8), whereas; greater adsorption occurs at higher p/po (>0.8) due to adsorption at the outer surface of the polymer.48,49 Based on Fig. 3, ca. 90% of the gas is adsorbed on the grain boundaries while remainder occurs within the micropores of the polymer solid. The absence of hysteresis may be due to capillary evaporation and condensation which occurs reversibly at the same relative pressure.50,51 The effect may occur due to the collapse of the polymer framework which is magnified by the quantity of desorbed gas being lower than the quantity of adsorbed gas when p/po < 0.6.48,49
3.4 Particle size
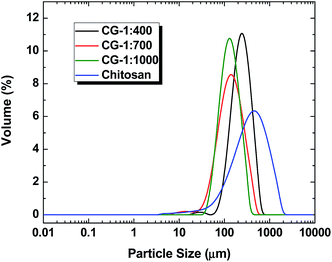
The particle size distribution (PSD) of chitosan and its cross-linked forms is presented in Fig. 4 and Table 2, where d(4.3) represent the volume of mean diameter; d(3.2), area of mean diameter; and d(0.1), d(0.5), and d(0.9) are number of particles in the materials that are smaller (i.e. 10%, 50%, and 90%) than the average particle size of the sample, respectively.52| Parameters | Chitosan | CG-1![[thin space (1/6-em)]](https://www.rsc.org/images/entities/char_2009.gif) : :![[thin space (1/6-em)]](https://www.rsc.org/images/entities/char_2009.gif) 400 400 |
CG-1![[thin space (1/6-em)]](https://www.rsc.org/images/entities/char_2009.gif) : :![[thin space (1/6-em)]](https://www.rsc.org/images/entities/char_2009.gif) 700 700 |
CG-1![[thin space (1/6-em)]](https://www.rsc.org/images/entities/char_2009.gif) : :![[thin space (1/6-em)]](https://www.rsc.org/images/entities/char_2009.gif) 1000 1000 |
|---|---|---|---|---|
| Specific surface area (m2 g−1) | 0.2290 | 0.0280 | 0.0545 | 0.0484 |
| Volume mean diameter (μm) | 631 | 274 | 171 | 153 |
| Surface mean diameter (μm) | 262 | 214 | 110 | 124 |
| d(0.1) | 167 | 134 | 64 | 74 |
| d(0.5) | 548 | 252 | 147 | 138 |
| d(0.9) | 1229 | 450 | 315 | 255 |
The results in Table 2 show a decrease in the specific surface area, volume and surface mean diameters with increased level of cross-linking. The results also show that the respective percentage of particles (i.e. 10%, 50% and 90%) that are smaller than the average particle size of the samples also decrease as cross-linker content increases. However, the irregularity noticed in the trend of specific surface area may be due to higher cross-linking density for the CG-1![[thin space (1/6-em)]](https://www.rsc.org/images/entities/char_2009.gif) :
:![[thin space (1/6-em)]](https://www.rsc.org/images/entities/char_2009.gif) 1000 polymer. The above results indicate that cross-linking of chitosan with glutaraldehyde results in an increased surface area and internal pore volume as the particle size decreases according to the level of cross-linking (cf.Scheme 1).
1000 polymer. The above results indicate that cross-linking of chitosan with glutaraldehyde results in an increased surface area and internal pore volume as the particle size decreases according to the level of cross-linking (cf.Scheme 1).
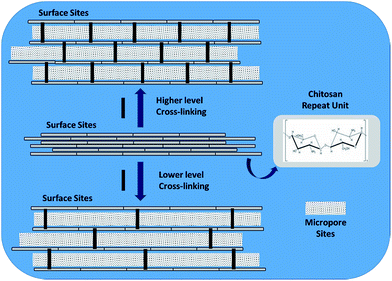 | ||
| Scheme 1 High vs. Low cross-linking level according to cross-linker content for chitosan–glutaraldehyde cross-linked materials. | ||
In Fig. 4, a salient feature of the width of the band shapes at full width half maximum (fwhm) seen in the particle distribution plot are noted for cross-linked chitosan versus chitosan. The greater size distribution of chitosan is attributed to its greater tendency to undergo aggregation due to favourable inter-chain hydrogen bonding for chitosan. The reduced fwhm for the cross-linked material is attributed to reduced aggregation. The variability in sharp vs. broad size distributions likely relates to differences in surface charge (zeta-potential) of the polymer and colloidal stability, in agreement with the observed size distribution in Fig. 4.
3.5 Scanning electron microscopy (SEM)
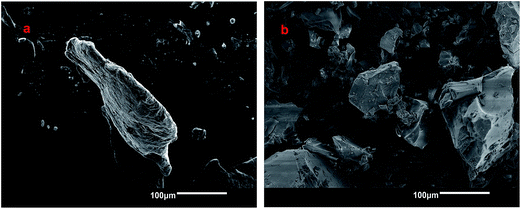
In Fig. 5, the SEM images of chitosan and one of the cross-linked polymers (CG-1![[thin space (1/6-em)]](https://www.rsc.org/images/entities/char_2009.gif) :
:![[thin space (1/6-em)]](https://www.rsc.org/images/entities/char_2009.gif) 700) are presented. The images show that crosslinking of chitosan with glutaraldehyde reveal a difference in morphology between chitosan and its cross-linked form. The SEM image of chitosan reveals a layered structure whereas the CG polymer does not reveal any layering. The differences in micropore structure for these materials are not readily discernable at this level of magnification but the layered structure of chitosan and amorphous nature of the CG polymer is illustrated by Scheme 1. The foregoing results are in agreement with microscopy results from other related studies.53,54
700) are presented. The images show that crosslinking of chitosan with glutaraldehyde reveal a difference in morphology between chitosan and its cross-linked form. The SEM image of chitosan reveals a layered structure whereas the CG polymer does not reveal any layering. The differences in micropore structure for these materials are not readily discernable at this level of magnification but the layered structure of chitosan and amorphous nature of the CG polymer is illustrated by Scheme 1. The foregoing results are in agreement with microscopy results from other related studies.53,54
3.6 Differential scanning calorimetry (DSC)
The DSC results of CG-1![[thin space (1/6-em)]](https://www.rsc.org/images/entities/char_2009.gif) :
:![[thin space (1/6-em)]](https://www.rsc.org/images/entities/char_2009.gif) 1000, CG-1
1000, CG-1![[thin space (1/6-em)]](https://www.rsc.org/images/entities/char_2009.gif) :
:![[thin space (1/6-em)]](https://www.rsc.org/images/entities/char_2009.gif) 1000/NH3(aq) and various CG-1
1000/NH3(aq) and various CG-1![[thin space (1/6-em)]](https://www.rsc.org/images/entities/char_2009.gif) :
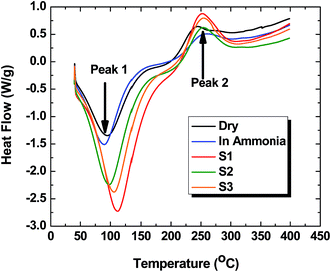
:![[thin space (1/6-em)]](https://www.rsc.org/images/entities/char_2009.gif) 1000/carboxylate anion systems are presented in Fig. 6. The thermograms show an endotherm (peak 1) at ∼100 °C attributed to dehydration transitions. An exotherm (peak 2) at 250 °C is attributed to an overlapping dual transition due to decomposition of the polymer framework along with loss of the bound adsorbate for various CG-1
1000/carboxylate anion systems are presented in Fig. 6. The thermograms show an endotherm (peak 1) at ∼100 °C attributed to dehydration transitions. An exotherm (peak 2) at 250 °C is attributed to an overlapping dual transition due to decomposition of the polymer framework along with loss of the bound adsorbate for various CG-1![[thin space (1/6-em)]](https://www.rsc.org/images/entities/char_2009.gif) :
:![[thin space (1/6-em)]](https://www.rsc.org/images/entities/char_2009.gif) 1000/carboxylate anion systems. Peaks 1 and 2 have variable intensity and temperature values at the peak maxima (Tmax) listed in Table 5 for the various CG-1
1000/carboxylate anion systems. Peaks 1 and 2 have variable intensity and temperature values at the peak maxima (Tmax) listed in Table 5 for the various CG-1![[thin space (1/6-em)]](https://www.rsc.org/images/entities/char_2009.gif) :
:![[thin space (1/6-em)]](https://www.rsc.org/images/entities/char_2009.gif) 1000/Si systems. The intensity variation for peak 1 reveals that the degree of hydration and Tmax increase markedly if one compares CG-1
1000/Si systems. The intensity variation for peak 1 reveals that the degree of hydration and Tmax increase markedly if one compares CG-1![[thin space (1/6-em)]](https://www.rsc.org/images/entities/char_2009.gif) :
:![[thin space (1/6-em)]](https://www.rsc.org/images/entities/char_2009.gif) 1000 in the absence and presence of added guest (i.e. NH3(aq) and each Si). Similarly, the magnitude of the enthalpy for peak 2 and the Tmax values are greater for the various CG-1
1000 in the absence and presence of added guest (i.e. NH3(aq) and each Si). Similarly, the magnitude of the enthalpy for peak 2 and the Tmax values are greater for the various CG-1![[thin space (1/6-em)]](https://www.rsc.org/images/entities/char_2009.gif) :
:![[thin space (1/6-em)]](https://www.rsc.org/images/entities/char_2009.gif) 1000/carboxylate anion systems. The greater hydration of CG polymer/Si systems provide evidence that the carboxylate anions are bound to the CG polymer. The greater enthalpy contributions for peak 2 for the CG polymer/Si complexes are consistent with the enthalpy of stabilization for host–guest interactions as compared with the unbound guest (Si). The above observations parallel the changes in hydration and thermal stability observed for cyclodextrin/guest systems by Karoyo et al.47 The DSC results provide confirmatory support that CG polymer/adsorbate complexes are formed at the surface and micropore sites of the sorbent, in agreement with the uptake results as described in Sections 3.7 and 3.8 below.
1000/carboxylate anion systems. The greater hydration of CG polymer/Si systems provide evidence that the carboxylate anions are bound to the CG polymer. The greater enthalpy contributions for peak 2 for the CG polymer/Si complexes are consistent with the enthalpy of stabilization for host–guest interactions as compared with the unbound guest (Si). The above observations parallel the changes in hydration and thermal stability observed for cyclodextrin/guest systems by Karoyo et al.47 The DSC results provide confirmatory support that CG polymer/adsorbate complexes are formed at the surface and micropore sites of the sorbent, in agreement with the uptake results as described in Sections 3.7 and 3.8 below.
3.7 Sorption studies
 | ||
| Fig. 7 Equilibrium sorption isotherms of chitosan and cross-linked CG polymers at pH 9 and 295 K with carboxylates; (a) S1, (b) S2, (c) S3 and (d) S4. | ||
In the case of S1 (cf.Fig. 7a), greater uptake is supported by the offset in magnitude of Qevs. Ce between pristine chitosan and the CG polymer materials. In Fig. 7a, the Freundlich model provided the “best-fit”. The Freundlich constant (KF) is an indicator of the uptake affinity for each sorbent with S1, as follows: chitosan (0.0800), CG-400 (3.42), CG-700 (4.46) and CG-1000 (6.65). The uptake values indicate an improved uptake of S1 as the glutaraldehyde content of the CG polymers increase. The exponent term (1/n) in eqn (3) is a measure of the intensity of adsorption.42 Based on the 1/n value, the sorptive uptake is favoured for S1 relative to the other surrogates. According to Table 2, the best-fit values of 1/n are given in parentheses: chitosan (0.980), CG-400 (2.14), CG-700 (2.23) and CG-1000 (2.30). As the level of glutaraldehyde content increases, the sorptive uptake and the overall binding affinity for S1 increased.
The sorptive uptake of S2 (cf.Fig. 7b) shows a more gradual increase between Qe and Ce as compared with the results for S1 (cf.Fig. 7a). The reduced binding affinity between the CG polymers with S2 is evidenced by the KF value for each sorbent material in parentheses: CG-400 (1.41), CG-700 (1.93) and CG-1000 (2.45). According to Table 3, the best-fit values for 1/n are given in parentheses: CG-400 (2.83), CG-700 (3.61) and CG-1000 (3.16). By comparison with the results for S1, the sorptive uptake of S2 is lower for the CG polymers even at the highest glutaraldehyde content. This trend may be due to the steric effects arising from the cyclohexyl ring unit (z = −2) as compared with surrogates such as S1 or S4 (z = 0) with linear alkyl fragments.
| Carboxylate | Isotherm models | Parameters | Sorbent materials examined in this study | |||
|---|---|---|---|---|---|---|
| Chitosan | CG-1![[thin space (1/6-em)]](https://www.rsc.org/images/entities/char_2009.gif) : :![[thin space (1/6-em)]](https://www.rsc.org/images/entities/char_2009.gif) 400 400 |
CG-1![[thin space (1/6-em)]](https://www.rsc.org/images/entities/char_2009.gif) : :![[thin space (1/6-em)]](https://www.rsc.org/images/entities/char_2009.gif) 700 700 |
CG-1![[thin space (1/6-em)]](https://www.rsc.org/images/entities/char_2009.gif) : :![[thin space (1/6-em)]](https://www.rsc.org/images/entities/char_2009.gif) 1000 1000 |
|||
| S1 | Freundlich | K F (L mg g−1) | 0.0800 | 3.42 | 4.46 | 6.65 |
| 1/nF | 0.980 | 2.14 | 2.23 | 2.30 | ||
| SSE | 1.12 | 1.61 | 1.93 | 2.54 | ||
| S2 | Freundlich | K F (L mg g−1) | N/A | 1.41 | 1.93 | 2.45 |
| 1/nF | 2.83 | 3.61 | 3.16 | |||
| SSE | 1.11 | 1.07 | 1.26 | |||
| S3 | Langmuir | Q m (mg g−1) | N/A | 4.21 | 4.86 | 9.50 |
| K L (L mg−1) | 0.359 | 0.358 | 0.508 | |||
| SSE | 0.522 | 0.731 | 0.717 | |||
| Sips | Q m (mg g−1) | 4.32 | 5.45 | 9.25 | ||
| K S (L mg−1) | 0.331 | 0.244 | 0.566 | |||
| n S | 0.930 | 0.779 | 1.10 | |||
| SSE | 1.07 | 1.13 | 0.613 | |||
| Freundlich | K F (L mg g−1) | 1.29 | 1.45 | 2.93 | ||
| 1/nF | 3.06 | 2.98 | 3.01 | |||
| SSE | 0.586 | 1.03 | 3.48 | |||
| S4 (pH 6) | Sips | Q m (mg g−1) | N/A | N/A | N/A | 28.4 |
| K S (L mg−1) | 0.0357 | |||||
| n S | 1.07 | |||||
| SSE | 0.527 | |||||
| S4 (pH 9) | Sips | Q m (mg g−1) | N/A | N/A | N/A | 33.5 |
| K S (L mg−1) | 0.0272 | |||||
| n S | 1.13 | |||||
| SSE | 0.691 | |||||
In the case of S3 (cf.Fig. 7c), the sorptive capacity falls in a similar range as for S2, however; the uptake of S3 reaches saturation at lower concentration (∼10 mg L−1). The trends for S2 and S3 provide support that steric effects influence the binding at the sorbent surface, especially at the micropore adsorption sites. Unlike S1 and S2, the Langmuir isotherm yields a reasonable “best-fit” for CG-400 and CG-700 while the Sips model provides a better description of the uptake behaviour for the CG-1000 polymer. The Langmuir and Sips models afford comparable best fit parameters due to the composite nature of the Sips isotherm. The adsorption behaviour of S3 is well-described by the Langmuir model which suggests that the CG polymers possess homogeneous adsorption sites with relatively low uptake. The results for S3 parallel the uptake properties observed for S2.
The sorption of S4 by the CG polymers at pH 9 (cf.Fig. 7d) show similar uptake compared to S1. The similar trends in uptake properties of S4 and S1 may relate to reduced steric effects for n-alkyl surrogates (z = 0), as supported by an independent study.25 The isotherms for S4 were studied at pH 6 to evaluate surface charge effects on the adsorptive uptake for this system. Due to the solubilisation of chitosan at lower pH values (below pH 5.5), the results for chitosan and the cross-linked polymer (CG-1000) are shown for comparison. The Sips model provided the “best-fit” with Qm values of 28.4 mg g−1 (pH 6) and 33.5 mg g−1 (pH 9). A comparison of the results obtained pH 6 and pH 9 indicate that lower pH conditions do not contribute significantly variable uptake. It follows that van der Waals interactions and hydrophobic effects may provide the driving force for uptake of this polymer/surrogate system. The slightly greater value of Ks (0.0375 L mg−1) at pH 6 relative to the value (0.0272 L mg−1) at pH 9 may reflect secondary charge contributions when the amine groups of chitosan become protonated and contribute to favourable ionic interactions with the carboxylate headgroup in the sorption process.
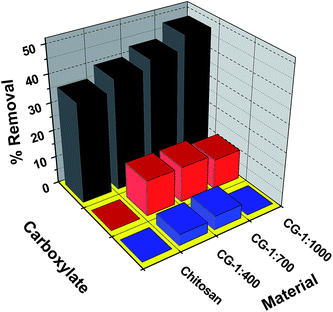
The sorption isotherm results for the surrogates show that the uptake properties of S1 and S4 are similar but exceed the uptake of S2 and S3. The trend in uptake does not parallel the variation in relative lipophilic character of the various surrogates; however, there is a trend in uptake according to the degree of unsaturation (ring structures) of the surrogate species. The results in Fig. 5 show that the uptake is greater for cross-linked chitosan relative to the pristine material, further supporting the important role of micropore domains that drive the uptake properties of such chitosan materials. The variable uptake properties for the surrogates described above is related to the nature of alkyl fragments, aliphatic chains versus ring systems. The surrogates with ring systems (S2 and S3) appear to have lower uptake relative to the aliphatic surrogates (S1 and S4). Since the micropore domains are likely the principal adsorption sites, the difference in uptake among the surrogates is supported according to steric effects since S2 and S3 have greater cross-sectional diameter than linear aliphatic surrogates (S1 and S4). The trends in relative uptake according to the level of cross-linking of chitosan reveals the importance of micropore adsorption sites, in agreement with the steric effects for surrogates with linear (z = 0) versus ring systems (z < 0) and the positive contribution of micropores to surface area of the sorbent. Based on the similar uptake values for saturated (S1 and S4) versus unsaturated (S2 and S3) surrogates, it is likely that van der Waals interactions and hydrophobic effects are the primary driving forces for the adsorptive interactions, in agreement with the reduced uptake for C3–C5 fatty acids (0.13–0.19 mg g−1)25 and the greater hydrophilic character of such lower molecular weight species. The role of steric effects that result from differing numbers of ring systems and LSA values of the surrogates are supported by the results in Table 3. Ion–dipole interactions between the carboxylate head group and the hydrophilic domains of chitosan likely contribute to the sorptive uptake and binding affinity of the various Si species; however, such electrostatic interactions appear to play a secondary role according to the trends in Fig. 4, in agreement with the low uptake results reported by Shamov et al.25 To gain a more detailed molecular level understanding of the sorption process, a kinetic uptake study was carried out to complement this equilibrium study.
![[thin space (1/6-em)]](https://www.rsc.org/images/entities/char_2009.gif) :
:![[thin space (1/6-em)]](https://www.rsc.org/images/entities/char_2009.gif) 400: 22.5 mg g−1, CG-1
400: 22.5 mg g−1, CG-1![[thin space (1/6-em)]](https://www.rsc.org/images/entities/char_2009.gif) :
:![[thin space (1/6-em)]](https://www.rsc.org/images/entities/char_2009.gif) 700: 25.2 mg g−1 and CG-1
700: 25.2 mg g−1 and CG-1![[thin space (1/6-em)]](https://www.rsc.org/images/entities/char_2009.gif) :
:![[thin space (1/6-em)]](https://www.rsc.org/images/entities/char_2009.gif) 1000: 27.0 mg g−1). As well, the rate of uptake (k2; g mg−1 min−1) listed in parentheses for S1 parallels the behaviour for the Qe values, as follows: (chitosan, 0.07836; CG-1
1000: 27.0 mg g−1). As well, the rate of uptake (k2; g mg−1 min−1) listed in parentheses for S1 parallels the behaviour for the Qe values, as follows: (chitosan, 0.07836; CG-1![[thin space (1/6-em)]](https://www.rsc.org/images/entities/char_2009.gif) :
:![[thin space (1/6-em)]](https://www.rsc.org/images/entities/char_2009.gif) 400, 0.00957; CG-1
400, 0.00957; CG-1![[thin space (1/6-em)]](https://www.rsc.org/images/entities/char_2009.gif) :
:![[thin space (1/6-em)]](https://www.rsc.org/images/entities/char_2009.gif) 700, 0.0125; and CG-1
700, 0.0125; and CG-1![[thin space (1/6-em)]](https://www.rsc.org/images/entities/char_2009.gif) :
:![[thin space (1/6-em)]](https://www.rsc.org/images/entities/char_2009.gif) 1000: 0.0148). The uptake properties for the systems are presented in Fig. 6. The pseudo-first order (cf. PFO; eqn (8)) and pseudo-second order (cf. PSO; eqn (9)) kinetic models were used to evaluate the uptake results. The PSO model provided the best overall fit for the data in agreement with the presence of surface and micropore adsorption sites of the adsorbent.56,57 Based on the estimated k2 values, pristine chitosan had the fastest rate of uptake while CG-1
1000: 0.0148). The uptake properties for the systems are presented in Fig. 6. The pseudo-first order (cf. PFO; eqn (8)) and pseudo-second order (cf. PSO; eqn (9)) kinetic models were used to evaluate the uptake results. The PSO model provided the best overall fit for the data in agreement with the presence of surface and micropore adsorption sites of the adsorbent.56,57 Based on the estimated k2 values, pristine chitosan had the fastest rate of uptake while CG-1![[thin space (1/6-em)]](https://www.rsc.org/images/entities/char_2009.gif) :
:![[thin space (1/6-em)]](https://www.rsc.org/images/entities/char_2009.gif) 400 had the lowest value. The attenuated rate of the cross-linked polymers relative to unmodified chitosan is attributed to uptake within the micropore domains of the sorbent. CG-1000 displayed the largest value of k2 among the cross-linked materials and is related to the variable number of adsorption sites due to its greater cross-linker content. The surface chemistry and textural properties of the materials vary according to the level of cross-linker content, in agreement with other studies.36,58
400 had the lowest value. The attenuated rate of the cross-linked polymers relative to unmodified chitosan is attributed to uptake within the micropore domains of the sorbent. CG-1000 displayed the largest value of k2 among the cross-linked materials and is related to the variable number of adsorption sites due to its greater cross-linker content. The surface chemistry and textural properties of the materials vary according to the level of cross-linker content, in agreement with other studies.36,58
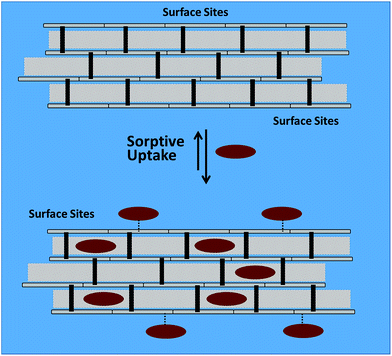
Ion–dipole interactions between the carboxylate headgroup and the sorbent surface are likely of secondary importance for the systems studied herein, due to the strong hydration of the carboxylate head group57 (cf. ΔG°(hydration) in Table 4). The observed variation in uptake of the components in the surrogate mixture (S1–S4) agree with the steric effects between alicyclic vs. aliphatic units of the surrogates due to the role of the micropore adsorption sites described above. The role of ion–dipole interactions for chitosan-based materials is supported by anion recognition behaviour reported elsewhere.60Scheme 2 is a generalized view of the surface and micropore sorption sites of cross-linked chitosan that govern the uptake of the carboxylate anions (Si).
| Carboxylate anion | Lipophilic surface areaa (LSA) | Dipole momenta (Debye) | ΔG°a (hydration) (kJ mol−1) | CMCb (M) |
|---|---|---|---|---|
| a Lipophilic surface area, dipole moments and solvation energy values were obtained using Spartan '08 V1.2.0 from Hartree–Fock SCF calculation performed using Pulay DIIS + Geometric Direct Minimization. The basis set used was 3-21G(*). b Critical micelle concentration (CMC) obtained from surface tension results (cf.ref. 55). | ||||
| S1 | 327 | 5.99 | −13.4 | 3.56 × 10⁻⁵ |
| S2 | 222 | 6.43 | −17.2 | 5.45 × 10⁻⁴ |
| S3 | 233 | 5.24 | −16.0 | 4.71 × 10⁻³ |
CG-1![[thin space (1/6-em)]](https://www.rsc.org/images/entities/char_2009.gif) : :![[thin space (1/6-em)]](https://www.rsc.org/images/entities/char_2009.gif) 1000 1000 |
Peak 1 (J g−1), Tmax (°C) | Peak 2 (J g−1), Tmax (°C) |
|---|---|---|
| Solvent free | 345, 94.7 | 106, 244 |
| NH3(aq) (no surrogate) | 489, 89.7 | 95.6, 260 |
| S1 | 463, 112 | 126, 252 |
| S2 | 472, 98.4 | 122, 254 |
| S3 | 497, 107 | 141, 255 |
| Adsorbent (physical state) | Adsorbate | pH | Sorption capacity (mg g−1) | Ref. |
|---|---|---|---|---|
| Chitosan powder | Reactive red 141 | 11 | 68 | 62 |
| Chitosan flake | Reactive black 5 | 9 | 19.9 | 63 |
| CG polymers | Anionic PNP | 9 | 43–80 | 64 |
| Chitosan flake | Eosin Y | 8 | 79 | 65 |
| Chitosan & cross-linked chitosan powders | Fatty acids (C3–C5) | 7 | 0.13–0.19 | 25 |
| Chitosan powder | Alkyl carboxylates | 9 | <5 | This study |
| CG polymers | Alkyl carboxylates | 6, 9 | 9.5–33.5 | This study |
3.8 Regeneration studies
Regeneration of the CG-polymers was studied by a study of the adsorption–desorption behaviour for the CG-1![[thin space (1/6-em)]](https://www.rsc.org/images/entities/char_2009.gif) :
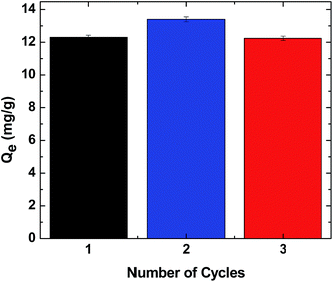
:![[thin space (1/6-em)]](https://www.rsc.org/images/entities/char_2009.gif) 1000/S4 system. The uptake was evaluated by measurement of the surrogate concentration before and after adsorption using esi-ms, while desorption of S4 was achieved by eluting the surrogate with Millipore water and acetone. The results in Fig. 10 demonstrate the reusability of the CG-polymer/S4 system according to the reversible adsorption–desorption of S4 (Qevs. number of cycles) and for wastewater treatment applications.
1000/S4 system. The uptake was evaluated by measurement of the surrogate concentration before and after adsorption using esi-ms, while desorption of S4 was achieved by eluting the surrogate with Millipore water and acetone. The results in Fig. 10 demonstrate the reusability of the CG-polymer/S4 system according to the reversible adsorption–desorption of S4 (Qevs. number of cycles) and for wastewater treatment applications.
4. Conclusion
Controlled cross-linking of chitosan with glutaraldehyde at variable cross-linker content affords sorbent materials with tunable textural properties and surface chemistry. The materials were characterized and their adsorption properties with several single components and mixtures of alkyl carboxylate anions were studied at pH 6 and 9 in aqueous solutions. The study reported herein highlights the first example that outlines the use of chitosan and its cross-linked materials for the uptake of single components and complex mixtures of alkyl carboxylate species in aqueous solution. Cross-linked chitosan materials display unique molecular selective uptake according to their glutaraldehyde content, in accordance with the formation of micropore and surface sites. Variable binding affinity and uptake of single component surrogates also depend on the z-value (hydrogen deficiency or the number of ring systems), as follows: S4 ≈ S1 > S2 > S3. The uptake properties are consistent with steric effects due to the presence of ring systems versus aliphatic chains due to “molecular sieving” effects. Cross-linking of chitosan enables molecular selective uptake (S1 > S2 > S3) of equimolar surrogate mixtures by preferential adsorption within the micropore sites of the CG polymer framework. In the case of the CG polymer/carboxylate anion systems, the imprinting factor ranges from 43- to 83-fold, and is notably greater than pristine chitosan. Cross-linking of chitosan contributes to imprinting and formation of preorganized binding sites (micropores) where the primary sorptive interactions are driven by hydrophobic effects and secondary interactions between the polymer and the carboxylate headgroup of the surrogate (cf.Scheme 2). This study highlights a versatile green strategy for the design of chitosan-based materials with tunable adsorption properties suitable for the fractionation of waterborne contaminants. The results presented herein will contribute to future advances in materials and environmental science as evidenced by the development of tunable biomaterial adsorbents for the controlled removal of waterborne pollutants from the environment.61Acknowledgements
The authors are grateful to the University of Saskatchewan and Environment Canada for supporting this research. Louis Poon and Chen Xue are acknowledged for assistance during synthesis of the materials and provision of SEM results respectively. Mr Jonathan Bailey is also acknowledged for his expert technical assistance with the mass spectrometry studies. Dr Russell K. Hynes at Agriculture and Agri-Food Canada (Saskatoon, SK) is acknowledged for providing access to the light scattering facility to enable particle size analysis measurements.References
- Council of Canadian Academies, Water and Agriculture in Canada: Towards Sustainable Management of Water Resources, The Expert Panel on Sustainable Management of Water in the Agricultural Landscapes of Canada, Ottawa, Canada, 2013 Search PubMed.
- S. D. Richardson and T. A. Ternes, Anal. Chem., 2011, 83, 4614–4648 CrossRef CAS PubMed.
- Ministry of Justice, Fisheries Act, http://laws.justice.gc.ca/eng/F-14/FullText.html, accessed 13th February 2014, 2012.
- P. A. Chastko, Developing Alberta's Oil Sands: From Karl Clark to Kyoto, University of Calgary Press, Calgary, 2004 Search PubMed.
- I. Dzidic, A. C. Somerville, J. C. Raia and H. V. Hart, Anal. Chem., 1988, 60, 1318–1323 CrossRef CAS.
- T. P. Fan, Energy Fuels, 1991, 5, 371–375 CrossRef CAS.
- D. C. L. Wong, R. van Compernolle, J. G. Nowlin, D. L. O'Neal and G. M. Johnson, Chemosphere, 1996, 32, 1669–1679 CrossRef CAS.
- W. P. St John, J. Rughani, S. A. Green and G. D. McGinnis, J. Chromatogr. A, 1998, 807, 241–251 CrossRef CAS.
- C. S. Hsu, G. J. Dechert, W. K. Robbins and E. K. Fukuda, Energy Fuels, 1999, 14, 217–223 CrossRef.
- D. Herman, P. M. Fedorak, M. D. MacKinnon and J. W. Costerton, Can. J. Microbiol., 1994, 40, 467–477 CrossRef CAS.
- V. V. Rogers, K. Liber and M. D. MacKinnon, Chemosphere, 2002, 48, 519–527 CrossRef CAS.
- J. V. Headley, B. Crosley, F. M. Conly and E. K. Quagraine, J. Environ. Sci. Health, Part A: Toxic/Hazard. Subst. Environ. Eng., 2005, 40, 1–27 CrossRef CAS PubMed.
- E. K. Quagraine, J. V. Headley and H. G. Peterson, J. Environ. Sci. Health, Part A: Toxic/Hazard. Subst. Environ. Eng., 2005, 40, 671–684 CrossRef CAS PubMed.
- J. S. Clemente and P. M. Fedorak, Chemosphere, 2005, 60, 585–600 CrossRef CAS PubMed.
- V. Nero, A. Farwell, L. E. J. Lee, T. van Meer, M. D. MacKinnon and D. G. Dixon, Ecotoxicol. Environ. Saf., 2006, 65, 252–264 CrossRef CAS PubMed.
- L. E. Peters, M. MacKinnon, T. van Meer, M. R. van den Heuvel and D. G. Dixon, Chemosphere, 2007, 67, 2177–2183 CrossRef CAS PubMed.
- P. R. Kannel and T. Y. Gan, J. Environ. Sci. Health, Part A: Toxic/Hazard. Subst. Environ. Eng., 2012, 47, 1–21 CrossRef CAS PubMed.
- R. J. Kavanagh, R. A. Frank, K. D. Oakes, M. R. Servos, R. F. Young, P. M. Fedorak, M. D. MacKinnon, K. R. Solomon, D. G. Dixon and G. van Der Kraak, Aquat. Toxicol., 2011, 101, 214–220 CrossRef CAS PubMed.
- K. E. Tollefsen, K. Petersen and S. J. Rowland, Environ. Sci. Technol., 2012, 46, 5143–5150 CrossRef CAS PubMed.
- N. Morin-Crini and G. Crini, Prog. Polym. Sci., 2013, 38, 344–368 CrossRef CAS PubMed.
- L. D. Wilson, M. H. Mohamed and J. V. Headley, Rev. Environ. Health, 2014, 29, 5–8 CAS.
- M. H. Mohamed, L. D. Wilson and J. V. Headley, J. Phys. Chem. B, 2013, 117, 3659–3666 CrossRef CAS PubMed.
- M. H. Mohamed, L. D. Wilson, J. V. Headley and K. M. Peru, Phys. Chem. Chem. Phys., 2011, 13, 1112–1122 RSC.
- J. V. Headley, K. M. Peru, M. H. Mohamed, L. Wilson, D. W. McMartin, M. M. Mapolelo, V. V. Lobodin, R. P. Rodgers and A. G. Marshall, Energy Fuels, 2012, 27, 1772–1778 CrossRef.
- M. V. Shamov, S. Y. Bratskaya and V. A. Avramenko, J. Colloid Interface Sci., 2002, 249, 316–321 CrossRef CAS PubMed.
- S. Sathivel and W. Prinyawiwatkul, J. Am. Oil Chem. Soc., 2004, 81, 493–496 CrossRef CAS.
- M.-Y. Lee, K.-J. Hong, T. Kajiuchi and J.-W. Yang, Int. J. Biol. Macromol., 2005, 36, 152–158 CrossRef CAS PubMed.
- O. Gylienė, O. Nivinskienė and T. Vengris, Carbohydr. Res., 2008, 343, 1324–1332 CrossRef PubMed.
- L. D. Wilson and C. Xue, J. Appl. Polym. Sci., 2013, 128, 667–675 CrossRef CAS PubMed.
- L. D. Wilson, D. Y. Pratt and J. A. Kozinski, J. Colloid Interface Sci., 2013, 393, 271–277 CrossRef CAS PubMed.
- D. Y. Pratt, L. D. Wilson and J. A. Kozinski, J. Colloid Interface Sci., 2013, 395, 205–211 CrossRef CAS PubMed.
- M. N. V. R. Kumar, R. A. A. Muzzarelli, C. Muzzarelli, H. Sashiwa and A. J. Domb, Chem. Rev., 2004, 104, 6017–6084 CrossRef PubMed.
- K. M. Vårum and O. Smidsrød, in Polysaccharides, CRC Press, 2004, ch. 26, DOI:10.1201/9781420030822.
- W. S. Wan Ngah, L. C. Teong and M. A. K. M. Hanafiah, Carbohydr. Polym., 2011, 83, 1446–1456 CrossRef CAS PubMed.
- C. B. Li, S. Hein and K. Wang, Mater. Sci. Technol., 2008, 24, 1088–1099 CrossRef CAS PubMed.
- L. Poon, L. D. Wilson and J. V. Headley, Carbohydr. Polym., 2014, 109, 92–101 CrossRef CAS PubMed.
- J. W. Steed and J. A. Atwood, Supramolecular Chemistry, Wiley, West Sussex, UK, 2nd edn, 2009, pp. 888–893 Search PubMed.
- T. Allen, Particle Size Measurement: Volume 2: Surface Area and Pore Size Determination, Springer, London, UK, 1997 Search PubMed.
- K. Sing, Colloids Surf., A, 2001, 187–188, 3–9 CrossRef CAS.
- J. C. P. Broekhoff and J. H. de Boer, J. Catal., 1968, 10, 153–165 CrossRef CAS.
- I. Langmuir, J. Am. Chem. Soc., 1918, 40, 1361–1402 CrossRef CAS.
- H. M. F. Freundlich, J. Phys. Chem. A, 1906, 57, 385–470 CAS.
- R. Sips, J. Chem. Phys., 1948, 16, 490–495 CrossRef CAS PubMed.
- A. Gryshchenko and C. Bottaro, Int. J. Mol. Sci., 2014, 15, 1338–1357 CrossRef PubMed.
- J. Z. Knaul, S. M. Hudson and K. A. M. Creber, J. Polym. Sci., Part B: Polym. Phys., 1999, 37, 1079–1094 CrossRef CAS.
- N. R. Kildeeva, P. A. Perminov, L. V. Vladimirov, V. V. Novikov and S. N. Mikhailov, Russ. J. Bioorg. Chem., 2009, 35, 360–369 CrossRef CAS.
- A. H. Karoyo, P. S. Sidhu, L. D. Wilson and P. Hazendonk, J. Phys. Chem. B, 2013, 117, 8269–8282 CrossRef CAS PubMed.
- S. Lowell, J. E. Shields, M. A. Thomas and M. Thommes, Characterization of Porous Solids and Powders: Surface Area, Pore Size and Density, Springer, Netherlands, 2012 Search PubMed.
- L. Dehabadi and L. D. Wilson, Carbohydr. Polym., 2014, 113, 471–479 CrossRef CAS PubMed.
- M. Kruk and M. Jaroniec, Chem. Mater., 2001, 13, 3169–3183 CrossRef CAS.
- S. J. Gregg and K. S. W. Sing, Adsorption, surface area, and porosity, Academic Press, London, New York, 1982 Search PubMed.
- Z. Guo, S. Zeng, X. Lu, M. Zhou, M. Zheng and B. Zheng, Food Chem., 2015, 186, 223–230 CrossRef CAS PubMed.
- M. Shivashankar and B. K. Mandal, Trop. J. Pharm. Res., 2013, 12, 13–18 CAS.
- J. Ostrowska-Czubenko, M. Gierszewska and M. Pierog, J. Polym. Res., 2015, 22(153), 1–12 CAS.
- M. H. Mohamed, L. D. Wilson, K. M. Peru and J. V. Headley, J. Colloid Interface Sci., 2013, 395, 104–110 CrossRef CAS PubMed.
- C. Xu, H. Chen and F. Jiang, Colloids Surf., A, 2015, 479, 60–67 CrossRef CAS PubMed.
- Q. Gao, H. Zhu, W.-J. Luo, S. Wang and C.-G. Zhou, Microporous Mesoporous Mater., 2014, 193, 15–26 CrossRef CAS PubMed.
- M. Grundy and Z. Ye, J. Mater. Chem. A, 2014, 2, 20316–20330 CAS.
- L. D. Wilson, S. R. Siddall and R. E. Verrall, Can. J. Chem., 1997, 75, 927–933 CrossRef CAS.
- L. D. Wilson, in Water Conditioning & Purification Magazine, Tucson, AZ, 2014, vol. 56(12), pp. 28–33 Search PubMed.
- M. H. Mohamed, L. D. Wilson, J. V. Headley and K. M. Peru, Energy Fuels, 2015, 29, 3591–3600 CrossRef CAS.
- N. Sakkayawong, P. Thiravetyan and W. Nakbanpote, J. Colloid Interface Sci., 2005, 286, 36–42 CrossRef CAS PubMed.
- T. K. Saha, N. C. Bhoumik, S. Karmaker, M. G. Ahmed, H. Ichikawa and Y. Fukumori, Clean: Soil, Air, Water, 2011, 39, 984–993 CrossRef CAS PubMed.
- L. Poon, L. D. Wilson and J. V. Headley, Carbohydr. Polym., 2014, 109, 92–101 CrossRef CAS PubMed.
- S. Chatterjee, S. Chatterjee, B. P. Chatterjee, A. R. Das and A. K. Guha, J. Colloid Interface Sci., 2005, 288(1), 30–35 CrossRef CAS PubMed.
| This journal is © The Royal Society of Chemistry 2015 |

